

Abstract
Our aim was to test the hypothesis that depolarization-induced intracellular pH (pHi) shifts in restricted regions (dendrites) of mammalian neurones might be larger and faster than those previously reported from the cell soma. We used confocal imaging of the pH-sensitive dye, HPTS, to measure pH changes in both the soma and dendrites of whole-cell patch-clamped rat cerebellar Purkinje cells. In the absence of added CO2–HCO3−, depolarization to +20 mV for 1 s caused large (≈0.14 pH units) and fast dendritic acid shifts, whilst the somatic acidifications were significantly smaller (≈0.06 pH units) and slower. The pHi shifts were smaller in the presence of 5 % CO2–25 mm HCO3−-buffered saline (≈0.08 pH units in the dendrites and ≈0.03 pH units in the soma), although a clear spatiotemporal heterogeneity remained. Acetazolamide (50 μM) doubled the size of the dendritic acid shifts in the presence of CO2–HCO3−, indicating carbonic anhydrase activity. Removal of extracellular calcium or addition of the calcium channel blocker lanthanum (0.5 mm) inhibited the depolarization-evoked acid shifts. We investigated more physiological pHi changes by evoking modest bursts of action potentials (≈10 s duration) in CO2–HCO3−-buffered saline. Such neuronal firing induced an acidification of ≈0.11 pH units in the fine dendritic regions, but only ≈0.03 pH units in the soma. There was considerable variation in the size of the pHi shifts between cells, with dendritic acid shifts as large as 0.2-0.3 pH units following a 10 s burst of action potentials in some Purkinje cells. We postulate that these large dendritic pHi changes (pH microdomains) might act as important signals in synaptic function.
Neuronal electrical activity induces changes in intracellular pH (pHi; Ahmed & Connor, 1980; Schwiening et al. 1993; Trapp et al. 1996; Ballanyi & Kaila, 1998). There are a number of possible mechanisms that might underlie these shifts, but the shifts are generally considered to be too small to be of great physiological significance. Typically, depolarization under voltage clamp for > 10 s, or a burst of action potentials for > 1 min, evokes an acid shift of ≈0.2 pH units (Ahmed & Connor, 1980; Trapp et al. 1996). It has been hypothesised (Chesler, 1990; Tombaugh, 1998) that more dramatic pH changes may occur in the spatially restricted dendritic regions of neurones. Until now the recording of pHi in such regions has proved impossible (Tombaugh, 1998). In a recent study on isolated invertebrate neurones we provided the first evidence for activity-induced pHi microdomains in neurones (Schwiening & Willoughby, 2002). We found that the size and kinetics of depolarization-induced pHi shifts could vary within a single snail neurone. Changes in pHi in regions that were spatially more restricted (axon and lamellipodia) were many times larger than those seen in the cell body. High-resolution fluorescence imaging has previously revealed the distribution of large dendritic, and small somatic, calcium transients resulting from neuronal firing of cerebellar Purkinje cells (Tank et al. 1988). It is possible that a similar distribution of activity-induced pHi changes might exist in Purkinje cells. This is particularly likely since there are a number of mechanisms that link intracellular calcium with pH (Meech & Thomas, 1980; Schwiening et al. 1993; Werth & Thayer, 1994; Trapp et al. 1996). Here we compare directly somatic and dendritic activity-induced pHi shifts in rat cerebellar Purkinje cells.
We have used confocal imaging of the pyrene-based fluorescent pH indicator, 8-hydroxypyrene-1,3,6-trisulphonic acid (HPTS), to determine the distribution of electrically evoked pH changes in Purkinje cells under voltage- and current-clamp conditions. We have assessed the effects of using Hepes-buffered or CO2–HCO3−-buffered saline on the relative size and distribution of the acid shifts. In addition, we have investigated the calcium dependence of depolarization-induced pH changes in these cells. Preliminary data from this study has been presented previously to The Physiological Society (Willoughby & Schwiening, 2001).
METHODS
Cerebellar slice preparation
Sagittal cerebellar slices (200 μm thick) were prepared from Wistar rats (11-21 days old) killed humanely by cervical dislocation and decapitation in accordance with UK legislation. The slices were maintained at room temperature for at least 1 h prior to recording. The bathing solution contained (mm): 118 NaCl, 4.7 KCl, 2.5 CaCl2, 1.2 MgSO4, 25 NaHCO3 and 12 glucose, saturated with 95 % O2-5 % CO2 (pH 7.3). In some experiments NaHCO3 was replaced with Hepes, and the solution was left ungassed. Throughout the entire experiment the brain slices were maintained with the same pH buffer. We did not attempt to compare, in a single cell, the acute effects of adding and removing CO2–HCO3−-buffered saline. This avoided any problems associated with time-dependent rundown of the pHi shifts, incomplete washout of buffer, or secondary local ionic changes (e.g. intracellular sodium; see Knöpfel et al. 2000) possibly associated with pHi regulation from acute acid or alkali loads (Gaillard & DuPont, 1990). There was no obvious difference between the electrical activity of Purkinje cells in slices maintained in CO2–HCO3−-buffered saline and those maintained in Hepes-buffered saline, although slices maintained in CO2–HCO3− were generally viable for longer (up to 7 h). Slices were transferred to a recording chamber and superfused continuously at ≈2 ml min−1 at 18-24 °C. Picrotoxin or bicuculline (20 μM; Sigma) were added to the superfusing solution in all experiments.
Electrophysiology
Pipettes were prepared from borosilicate glass and had a resistance of 3-5 MΩ when filled with solution of (mm): 152 CsCl, 8 NaCl, 10 Hepes, 4 Mg-ATP, 0.3 Na3-GTP, 0.5 HPTS (Fluka) (final pH of 7.3). For current-clamp experiments CsCl was replaced with potassium gluconate. Potentials were amplified and clamped with an Axoclamp 2B amplifier (Axon Instruments).
Confocal imaging
Single-wavelength (excitation 458 nm) confocal images (≈5 Hz) of HPTS fluorescence (> 505 nm) were made using an upright Zeiss LSM 510 confocal microscope (× 40, 0.75 NA or × 63, 0.9 NA water-immersion objectives). The planar structure of the Purkinje cells enabled us to record simultaneously fluorescence from both the cell soma and a large portion of the dendritic arborization. The fluorescence appeared to be stable throughout the cell within 15-20 min of commencing whole-cell recording. To compare regional differences in pHi, four regions of interest (ROIs) were selected; the soma, primary dendrite (> 3 μm diameter), secondary dendrites (2-3 μm diameter) and tertiary dendrites (< 2 μm diameter). Although dendritic spines were often visible, the resolution was generally insufficient to reliably record transient changes in pHi in such structures. Pixel-based data analysis was performed using a specially written Visual Basic program to extract regional data. Absolute 458 nm-excited HPTS fluorescence from the fine dendritic regions was lower than that from the cell soma and primary dendrite. Possible reasons for this include the greater degree of light scatter in the dendritic (molecular) layer of the slice, the thickness of the optical slice (typically 2-5 μm) being greater than that of the dendritic region, or a lower concentration of dye in the dendrites due to slow diffusion into these structures. To correct for the difference in absolute fluorescence and allow comparison of regional pHi changes, data were plotted as relative shifts in background-subtracted HPTS fluorescence (F/F0), where F0 was the control period 2 s before the depolarization. This relative fluorescence shift was calibrated for ΔpH by assuming a starting pH of 7.3 and a pKHPTS of 7.10, using a re-arrangement of a simple form of the Grynkiewicz equation (see eqn (1) in Schwiening & Willoughby, 2002).
Statistics
The data are presented as means ± s.e.m., and n represents the number of experiments performed on different Purkinje cells. Significance was determined using Student's unpaired t test, unless stated otherwise.
RESULTS
Depolarization of Purkinje cells under voltage-clamp conditions induces regional intracellular acid shifts
Since this is the first study to examine depolarization-induced pHi changes in different regions of mammalian neurones, we began by measuring pHi shifts during depolarization under voltage-clamp conditions and in the nominal absence of CO2–HCO3−. This allowed a well-defined stimulus to be applied to the cell under conditions that minimize pH buffering and regulation. Figure 1A shows an example of the local pHi shifts recorded in a Purkinje cell during 1 s depolarizations to +20, +40 and 0 mV. Figure 1Ai shows a confocal image of HPTS fluorescence from a neurone patch-clamped in the whole-cell configuration. Four ROIs were selected: the cell soma (blue), primary dendrite (green), secondary dendrites (yellow) and tertiary dendrites (red). The relative shifts in HPTS fluorescence seen on depolarization are plotted in Figure 1Aii. Depolarization had little effect on pH-sensitive fluorescence from the soma. In contrast, transient falls in fluorescence were seen in the three dendritic regions. The falls in fluorescence correspond to intracellular acidifications (Schwiening & Willoughby, 2002). These dendritic acid shifts were smallest in the primary dendrite (7-16 % decrease), and largest and fastest in the fine (secondary and tertiary) dendrites (11-27 % decrease). Calibration of the F/F0 HPTS signal (see Methods) indicated that the 1 s depolarizations of the Purkinje cell shown in Fig. 1 elicited acid shifts of up to 0.29 pH units in the tertiary dendrites. On average, from 21 voltage-clamped cells, the tertiary dendritic F/F0 HPTS decrease evoked by a 1 s depolarization to +20 mV in Hepes-buffered saline was 12.5 ± 1.6 %, equivalent to a ≈ 0.14 ± 0.02 pH unit acidification. In the secondary dendrites the F/F0 HPTS signal decreased by 10.9 ± 1.5 % (≈0.12 ± 0.02 pH unit acidification), in the primary dendrites by 9 ± 1.2 % (≈0.10 ± 0.01 pH unit acidification), and by 5.2 ± 1.0 % in the soma (≈0.06 ± 0.01 pH unit acidification). We never observed a pHi increase evoked by depolarizations.
Figure 1. Regional intracellular pH (pHi) shifts in cerebellar Purkinje neurones evoked by 1 s depolarization.
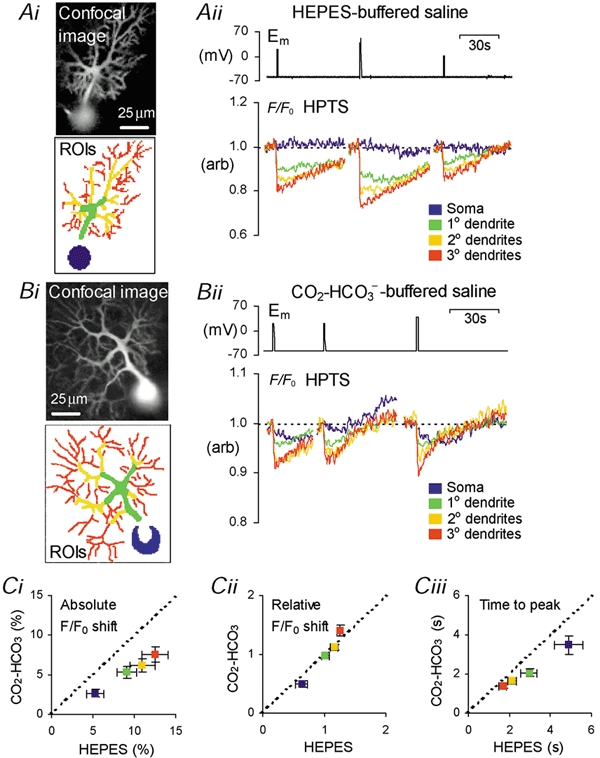
Ai, greyscale confocal image of 8-hydroxypyrene-1,3,6-trisulphonic acid (HPTS) fluorescence from a voltage-clamped Purkinje cell, and four regions of interest (ROIs) from which measurements were made. Aii, plots of membrane potential (Em) and HPTS fluorescence shifts (F/F0), from the ROIs, on 1 s depolarization to +20, +40 and 0 mV in Hepes-buffered saline. Bi, greyscale confocal image of HPTS fluorescence from another voltage-clamped Purkinje cell, and ROIs from which measurements were made. The saturated signal in the centre of the soma (white) was excluded. Bii, Em and HPTS fluorescence shifts, on 1 s depolarization to +20 and +40 mV in the presence of 5 % CO2–25 mm HCO3−. Ci, plot of mean HPTS fluorescence shift in CO2–HCO3− against the mean shift in the absence of added CO2–HCO3− for the four cellular regions following 1 s depolarization to +20 mV. Cii, mean HPTS fluorescence shift in each region, normalized to that across the whole cell during a 1 s depolarization to +20 mV in the presence and absence of added CO2–HCO3−. Ciii, mean data of time to peak pHi shift in each neuronal region, during a 1 s depolarization to +20 mV in the presence and absence of added CO2–HCO3−.
The effect of CO2–HCO3− on Purkinje cell depolarization-induced acid shifts
To examine the effects of CO2–HCO3− on local acid shifts in Purkinje neurones we performed a series of experiments under voltage-clamp conditions on cells superfused with 5 % CO2–25 mm HCO3−-buffered saline. Figure 1Bii shows the relative changes in pHi in four neuronal ROIs (Fig. 1Bi) during 1 s depolarizations. The depolarization-induced acid shifts are similar to those seen in nominally CO2–HCO3−-free saline (Fig. 1A). The largest acid transients occurred in the smallest dendrites, whilst smaller acid shifts were seen in the primary dendritic region, and in the soma. Taking data from 22 voltage-clamped cells superfused with CO2–HCO3−-buffered saline, a 1 s depolarization to +20 mV induced falls in the F/F0 HPTS signal of 7.6 ± 1.0 % (≈0.08 ± 0.01 pH unit acidification) in the tertiary dendrites, 6.2 ± 0.8 % in the secondary dendrites (≈0.07 ± 0.01 pH units), 5.3 ± 0.8 % in the primary dendrites (≈0.06 ± 0.01 pH units) and 2.7 ± 0.5 % (≈0.03 ± 0.01 pH units) in the soma. In Fig. 1C we compare the regional acid shifts evoked by 1 s depolarizations in the presence (y-axis) and the nominal absence (x-axis) of CO2–HCO3−. Figure 1Ci shows that the mean absolute acid shift in all neuronal regions was smaller in CO2–HCO3−-buffered saline than in Hepes buffered saline (P < 0.05). The same data, normalized to take account of the variability in the size of the acid shifts, are replotted in Fig. 1Cii. The dotted line (gradient = 1) indicates no effect of CO2–HCO3−-buffered saline on the pattern of regional pHi shifts compared to data obtained in Hepes-buffered saline. From Fig. 1Ci and ii we can see that under both conditions the acid shifts are larger in the finer dendritic regions, and although CO2–HCO3− reduced the absolute size of the acid shifts, the buffer has little effect on the regional pHi gradients. In Fig. 1Ciii we have plotted the time to peak depolarization-evoked acid shift in the presence of added CO2–HCO3− against the time taken in the absence of added CO2–HCO3−. Although the acid shifts developed more rapidly in the dendrites than in the soma, neither appeared to be sensitive to CO2–HCO3−. Changes in pHi in the dendritic regions developed significantly faster than those in the soma (P < 0.001, n = 21 in Hepes-buffered saline; P < 0.001, n = 22 in CO2–HCO3−-buffered saline). The times to peak acid shift in the absence of added CO2–HCO3− were 1.68 ± 0.19 s in the tertiary dendrites, compared to 2.13 ± 0.23 s in the secondary dendrites, 2.96 ± 0.40 s in the primary dendrites and 4.87 ± 0.68 s to peak acid shift in the cell soma. In CO2–HCO3−, acid shifts peaked at 1.40 ± 0.12 s in the tertiary dendrites, 1.65 ± 0.15 s in the secondary dendrites, 2.08 ± 0.21 s in the primary dendrites and 3.49 ± 0.47 s in the cell soma. It is likely that the mechanism(s) responsible for the larger acid shifts in fine dendritic regions are also responsible for the faster changes in pHi. Heterogeneity of the cellular pH changes could be due to the greater surface area to volume ratio of the dendrites and/or greater local densities of plasma membrane channels and transporters in these restricted neuronal regions (see Discussion). The pHi gradients produced by the differences in local pHi transients were still seen several seconds after the initial depolarization.
In vitro validation of regional F/F0 calibrations
The accuracy with which our fluorescence shifts can be converted to ΔpH depends largely upon knowledge of the starting pH before the shift. In Fig. 2A we show that when an alkaline (pH 8.00) HPTS solution is acidified in steps, the resultant pH can be calculated accurately from the measured sequential quenches in fluorescence over a wide pH range. This calculation can be used to predict the effect of the assumed starting pH on the calibration of a fluorescence shift. In Fig. 2B we show the calibration curves for two fluorescence shifts (5.2 and 12.5 %). It can be seen that when the starting pH is acidic the calculated ΔpH is relatively small. At pH < ≈6.5, ΔpH is constant for a given fluorescence shift. At alkaline pH, the pH shifts become extremely sensitive to the starting pH. One possible explanation for the difference in the size of regional pH shifts, evoked by depolarization, is the possibility of regional differences in steady-state pH. In Fig. 2C we have sought to quantify the relationship between the difference in size of the depolarization-evoked pH shifts, and the starting pH in each region. For the sake of this calculation we have assumed a fluorescence shift of 5.2 % in the soma and 12.5 % in the dendrites (mean Hepes data). In Fig. 2C the difference in ΔpH between the two regions is plotted as a function of the assumed starting pH in the soma. The five coloured lines are plotted for five different assumed starting pH values in the dendrites. Thus, at a soma pH of 7.5 and a dendritic pH of 6.5, the measured mean fluorescence shifts, we report here could be evoked by identical pH shifts. The continuous black line shows the difference in the size of the pH shifts assuming the dendritic pH follows the soma pH (i.e. in the absence of steady-state pH gradients). The vertical dashed line, at soma pH 7.3, shows the effect of assuming that the soma steady-state pH is in equilibrium with the patch-pipette solution. If this were the case, then an incredibly acidic dendritic region (pH 1.0) would be required to abolish the phenomenon of regional differences in pH shifts (see Discussion).
Figure 2. Calibration of F/F0 HPTS transients in different cellular regions.
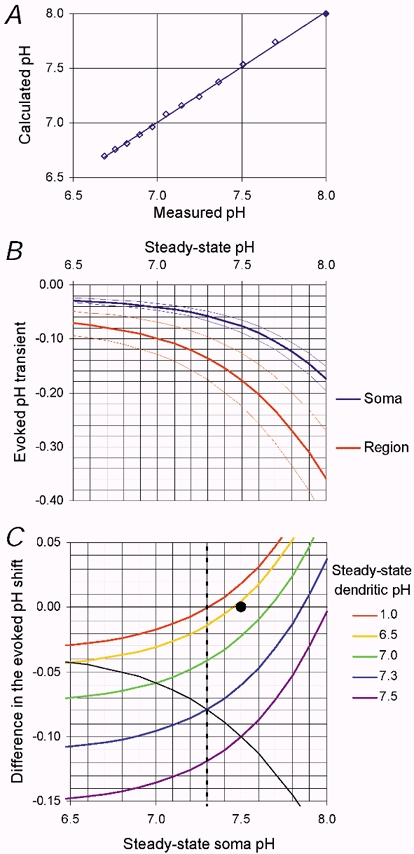
A, graph showing the relationship between the measured pH of 12 calibration (140 mm KCl, 10 mm Hepes, 0.5 mm HPTS) solutions and the value calculated from the relative falls (10 ± 1.9 %; mean ±s.d.) in the single-wavelength HPTS fluorescence (straight line shows least-squares fit where; slope = 1.01 and regression coefficient = 1.00). The calculation was based on two assumptions; first, that the most alkaline solution had a pH of 8.00 and second, a pK of 7.10 for HPTS. B, the relationship between the calculated pH transient size and the starting pHi for two sizes of fluorescence shifts. The blue lines (mean ± 1 s.d.) show the pH shift seen in the soma following a 1 s depolarization (5.2 ± 1.0 %), whilst the red lines (mean ± 1 s.d.) show the pH shift seen in the tertiary dendrites under the same conditions (12.5 ± 1.6 %). C, five curves showing the difference in the size of the depolarization-evoked pH shifts between the dendrites and the soma over a range of different assumed starting soma pH values. Each curve is plotted for a different dendritic starting pH with an F/F0 shift of 5.2 % for the soma and 12.5 % for the dendritic data. The vertical dashed line shows a soma pH of 7.3 (the patch-pipette solution). At a dendritic pH of ≈6.5 (•), a soma pH of 7.5 is required to make the regional depolarization-evoked pH transients equal in size. The black curve shows the difference in size between the regional pH transients assuming no steady-state pHi gradients throughout the cell.
Role of carbonic anhydrase activity in reducing the size of dendritic acid shifts
In Fig. 1 we showed that the peak size of depolarization-induced acid shifts was significantly smaller in the presence of 5 % CO2–25 mm HCO3−. We therefore examined the effects of carbonic anhydrase activity on depolarization-induced pHi shifts using the inhibitor acetazolamide (50 μM). Figure 3Ai shows a confocal image of a voltage-clamped Purkinje cell loaded with HPTS, and the dendritic ROI containing both secondary and tertiary dendrites from which the F/F0 data in Fig. 3Aii is plotted. Superfusion with acetazolamide for up to 5 min reversibly increased the size of the depolarization-evoked acid shift in the cell when superfused with CO2–HCO3−-buffered saline. This result was seen in seven similar experiments. The peak pH change seen in dendritic regions increased from 4.0 ± 0.5 to 8.3 ± 1.9 % F/F0 following application of the carbonic anhydrase inhibitor (P < 0.05). Three control experiments were performed to investigate the effects of acetazolamide on acid shifts evoked in cells superfused with Hepes-buffered, rather than CO2–HCO3−-buffered, saline. An example of such an experiment is shown in Fig. 3B. Superfusion with 50 μM acetazolamide for up to 5 min did not increase the size of depolarization-evoked acid shifts in Purkinje cell dendritic regions. The peak pH change in dendritic regions was 10.7 ± 3.0 % F/F0 under control conditions and 10.4 ± 1.9 % F/F0 in the presence of the carbonic anhydrase inhibitor. Interestingly, the mean values for the size of the acid shift in Hepes buffer and in CO2–HCO3− buffer plus acetazolamide are similar.
Figure 3. The effects of carbonic anhydrase inhibition on depolarization-induced acid shifts in Purkinje cell dendrites.
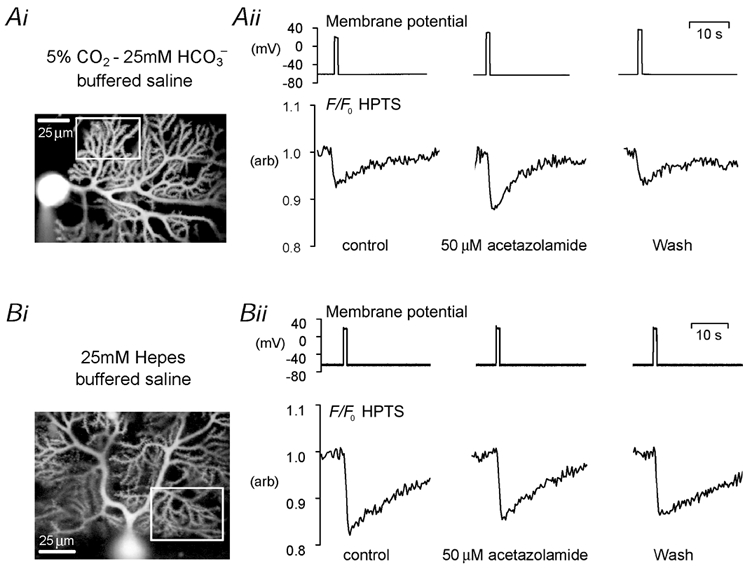
Ai, greyscale confocal image of a cerebellar Purkinje cell loaded with 500 μM HPTS via the patch pipette, and ROI (white box) from which fluorescence data are plotted. Aii, membrane potential, and F/F0 HPTS data from the selected region during three 1 s depolarizations to +20 mV. Addition of 50 μM acetazolamide to the 5 % CO2–25 mm HCO3−-buffered saline reversibly potentiated the size of the acid shift. Bi, greyscale confocal image and ROI (white box) from a different Purkinje cell loaded with 500 μM HPTS, superfused with Hepes-buffered saline. Bii, addition of 50 μM acetazolamide to the Hepes-buffered saline did not potentiate the size of the acid shifts evoked by 1 s depolarizations to +20 mV.
In mammalian enterocytes, pHi gradients are abolished in the presence of added CO2–HCO3− and carbonic anhydrase activity due to the facilitation of cytoplasmic proton mobility (Stewart et al. 1999). Enhanced proton mobility in neurones would greatly attenuate the dendritic pHi shifts whilst amplifying the pHi shifts in the soma. The presence of CO2–HCO3− significantly reduced the size of the depolarization-evoked acid shifts in all neuronal regions, consistent with a role for CO2–HCO3− as a hydrogen-ion buffer in Purkinje cells. However, the pHi gradients remained intact, suggesting that the carbonic anhydrase activity did not greatly facilitate proton diffusion between different structural regions of the cell.
Since CO2–HCO3− is well known to activate pHi regulation in a variety of neurones (Boron & De Weer, 1976; Thomas, 1976; Schwiening & Boron, 1994) we examined the rate of pHi recovery from the activity-induced acid load. Using a linear fit to the initial period of pHi recovery (2 s) we found that in the fine dendritic regions, pHi recovered at a rate of 0.323 ± 0.030 F/F0 units min−1 in Hepes-buffered saline, compared to 0.336 ± 0.052 F/F0 units min−1 in CO2–HCO3−-buffered saline. These data are consistent with the activation of a bicarbonate-dependent pHi-regulating mechanism that can counter the increase in buffering power. Thus, CO2–HCO3− may contribute to buffering activity-dependent pHi changes, but it has no effect on the rate of pHi recovery from acid loads.
Calcium dependence of dendritic acid shifts
Acid shifts in the soma have been shown to be dependent on calcium influx (Ahmed & Connor, 1980; Schwiening et al. 1993; Trapp et al. 1996) or bicarbonate fluxes (Kaila & Voipio, 1987). There is also some indirect evidence, from the calcium dependence of extracellular alkaline shifts (Grichtchenko & Chesler, 1996), that this might also be the case for dendritic intracellular acid shifts. In Fig. 4A we examine the effect of removing extracellular calcium in the presence of CO2–HCO3− on the dendritic acid shift evoked by depolarization to +20 mV for 1 s. In Fig. 4Aii we show the HPTS fluorescence shifts in a region of secondary and tertiary dendrites (see Fig. 4Ai) before, during and after extracellular calcium removal. The acid shift decreased by ≈50 % after 4 min in zero calcium (1 mm EGTA) Ringer solution. The time course of the washout of extracellular calcium is shown in more detail for three cells in Fig. 4Aiii. After 3.5-5 min in zero-calcium Ringer solution, the acid shift was reduced by ≈50 % (Fig. 4C, filled bars). It is possible that the remaining acid shift resulted from either incomplete removal of extracellular calcium, or a second, calcium-independent mechanism. To distinguish between these two possibilities we applied 0.5 mm lanthanum, which is known to block all the voltage-gated calcium influx into cerebellar Purkinje neurones (Gruol et al. 1996). These experiments were performed in nominally CO2–HCO3−-free solutions to avoid precipitating the lanthanum. Figure 4B shows an example of the irreversible inhibition of the acid shifts typically seen following the application of lanthanum. Figure 4C shows the mean data from six similar experiments. Addition of lanthanum inhibited the depolarization-induced acid shifts by ≈90 % on average. These results are therefore consistent with dendritic acid shifts resulting from calcium influx, although the source of the protons remains unclear.
Figure 4. The effect of inhibiting calcium entry on the size of depolarization-evoked acid shifts in Purkinje cell dendrites.
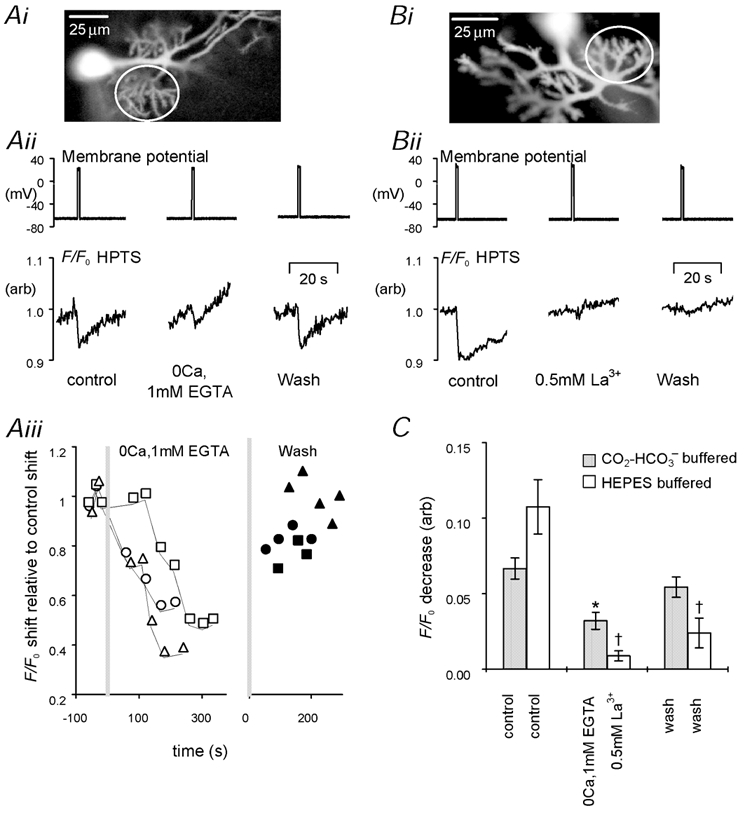
Ai, greyscale confocal image of HPTS fluorescence from a voltage-clamped Purkinje cell showing the ROI (white circle). Aii, the effect of 1 s depolarization on HPTS F/F0 signal before, during and after the removal of extracellular calcium in the presence of CO2–HCO3−. Aiii, time course of the declining F/F0 shift induced by extracellular calcium removal in three separate cells. The grey lines indicate the period of calcium removal. The x-axis is broken to allow the plots to be aligned both during calcium washout and calcium readdition. Bi, confocal image of Purkinje cell with region indicated from which fluorescence was plotted. Bii, the irreversible effect of 0.5 mm lanthanum on the depolarization-induced F/F0 fall. This was performed in Hepes-buffered saline as lanthanum precipitated in the presence of added HCO3−. C, mean data showing the effect of calcium removal (filled bars, n = 3) and lanthanum addition (open bars, n = 6) on the size of depolarization-induced acid shifts (* P < 0.05, †P < 0.01 when compared to control: paired t test).
Dendritic acid shifts evoked by action potential firing in Purkinje cells
Although depolarization under voltage-clamp conditions allows a well-defined stimulus to be applied to a cell, we wished to investigate more physiological dendritic pH shifts. Such pHi shifts might occur during action potential firing. To evoke these we whole-cell patch clamped Purkinje cells and held them under current-clamp conditions using small amounts of hyperpolarizing current to prevent action potential firing. To induce electrical activity, the hyperpolarizing current was reduced, or a small amount of depolarizing current (typically ≈200 pA) was injected. As before, the slices were superfused with saline containing 20 μM picrotoxin (or bicuculline), to block inhibitory inputs to the Purkinje cells and aid the spread of the neuronal activity throughout the cell. The action potentials elicited varied in size, shape and frequency between cells, and indeed over time in a single cell, thereby complicating the analysis of the resultant pHi shifts. Examples of action potential-evoked acid shifts from two separate experiments are shown in Fig. 5. Figure 5Ai and Bi show somatic and dendritic ROIs from which the F/F0 data is plotted in Fig. 5Aii and Bii, respectively. In both cells, ≈10 s of positive current was used to evoke a burst of action potentials. Despite the electrophysiological variation, the regional pHi shifts were similar. Each burst was accompanied by regional acid shifts of varying amplitude. The fastest and largest pHi changes were recorded in the fine neuronal dendrites (shown in red), where a steady acidification of 0.1-0.2 pH units developed during the firing period. The somatic region of cell in Fig. 5A showed a steady acid shift that was much smaller and developed throughout the recording period. The slowing of action potential firing rate during the 10 s depolarization in Fig. 5B was accompanied by a reduction in the rate of acidification in the fine dendrites. Changes in pHi in the primary dendrites were approximately half the size of those seen in the fine dendritic regions.
Figure 5. Regional acid shifts evoked by action potential (AP) firing.
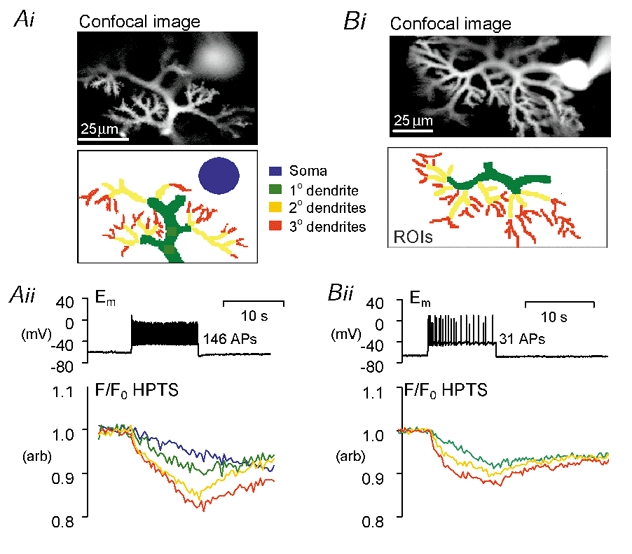
Ai, Confocal fluorescence image of a patch-clamped Purkinje cell and ROIs from which fluorescence has been plotted in Aii. Aii, an extract from an experiment showing the pH-sensitive fluorescence shift caused by a ≈10 s burst of APs, evoked by a 240 pA depolarizing current. The AP firing rate was consistent throughout the burst. Bi, confocal fluorescence image of a patch-clamped Purkinje neurone (soma region with saturating fluorescence) and dendritic ROIs from which fluorescence has been plotted in Bii. Bii, an extract from an experiment in which a 230 pA depolarizing current, for ≈ 10 s elicited a burst of APs showing adaptation. The fine dendritic regions show a biphasic pHi shift.
Spatiotemporal patterns of acid shifts during 10 s of action potential firing were examined in 17 cells in total. The average decrease in F/F0 HPTS signal was; 10.3 ± 1.7 % in the tertiary dendrites (≈0.11 pH unit acidification), although acid shifts as large as 0.2-0.3 pH units were observed in some cells. Other neuronal regions showed an average F/F0 HPTS decrease of 9.2 ± 1.5 % in the secondary dendrites (≈0.10 pH units), 6.1 ± 1.1 % in the primary dendrites (≈0.07 pH units) and 2.8 ± 0.6 % in the soma (≈0.03 pH units). The number of action potentials that fired during each 10 s period of depolarization was 97 ± 18 (n = 17).
Figure 6 shows another example of Purkinje cell regional acid shifts during the injection of depolarizing current. Figure 6A shows a patch-clamped Purkinje neurone with extensive dendritic arborization. In Fig. 6B and C it can be seen that large dendritic acid shifts occur when the depolarization is sufficient to elicit action potentials. The steady-state depolarization induced by the depolarizing current alone causes little pHi shift. This observation rules out artefactual fluorescence shifts due to iontophoretic effects of dye leakage from the patch pipette. In Fig. 6D we have plotted fluorescence shifts from two apparently similar fine dendritic regions (see the black and grey circles in Fig. 6A). The fluorescence shifts seen in the two regions appear different, despite similar absolute fluorescence intensities and morphology. A similar, or indeed greater, variability in the size of acid shifts, within a single morphologically defined region, was seen in ≈30 % of the cells analysed. This suggests that activity-evoked pHi changes in dendritic structures are governed by more than simply their surface area to volume characteristics.
Figure 6. Local differences in activity-induced acid shifts within fine dendritic regions of the Purkinje cell arborization.
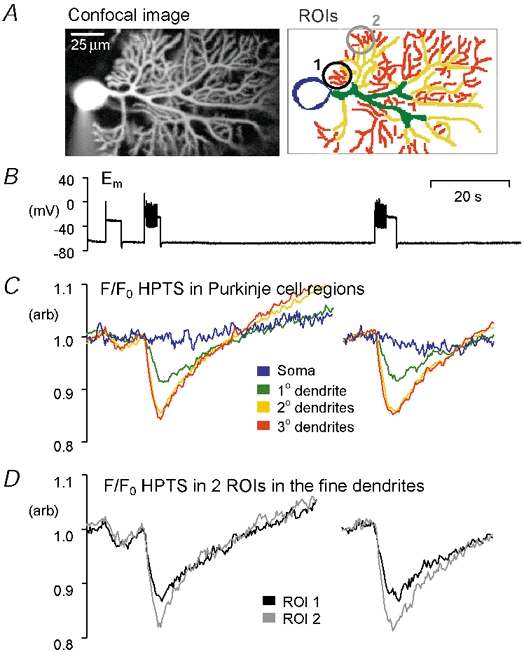
A, confocal image of a whole-cell patch-clamped Purkinje cell loaded with 500 μM HPTS (optical slice ≈4 μm thick), and image showing ROIs from which F/F0 HPTS data were plotted. B, membrane potential (Em) trace recorded at the cell soma. Depolarization was evoked by positive current injection (≈250 pA). C, F/F0 data for the soma, primary, secondary and tertiary dendritic regions. D, F/F0 data for two fine dendritic ROIs during the same period bursts of APs. The cerebellar slice was superfused with CO2–HCO3−-buffered saline containing 20 μM picrotoxin.
DISCUSSION
In this study we report that electrical activity can evoke transient, non-uniform acid shifts in rat cerebellar Purkinje cells. This is the first time that regional activity-induced pHi shifts have been demonstrated in a mammalian neuronal system, and has three important consequences. Firstly the dendritic pHi shifts are larger than hitherto reported for the cell soma. Secondly, their kinetics are faster, and thirdly the pHi shifts can be localized to particular active regions.
Activity-induced acid shifts and cytosolic pH gradients
The link between neuronal depolarization, calcium influx and intracellular acidification has been investigated for over 20 years in a range of neurones (e.g. Ahmed & Connor, 1980; Ballanyi & Kaila, 1998). A variety of mechanisms have been identified that might generate pH changes as a consequence of neuronal depolarization and cytosolic calcium increase; passive binding of calcium to buffers in exchange for protons (Meech & Thomas, 1980), mitochondrial calcium uptake (Werth & Thayer, 1994), plasma membrane calcium extrusion (Schwiening et al. 1993; Trapp et al. 1996) and stimulation of metabolism (Zhan et al. 1998). However, all these workers have treated the neuronal cytoplasm as a single compartment with a uniform pH. Studies of cytosolic calcium changes during electrical activity have shown a non-uniformity of the calcium transients evoked (Tank et al. 1988; Konnerth et al. 1992; Eilers et al. 1995). Although the calcium rise might induce a local pHi change, it was widely assumed that high proton mobility and buffering, pHi regulation and low transmembrane acid fluxes would ensure pHi uniformity. Indeed, we can find only two previous references to neuronal cytoplasmic pH gradients. In 1989, Dickens and colleagues reported regional variations in the pHi of neuronal PC12 cells. They observed that extending neurites were, under steady-state conditions, 0.2-0.3 pH units more alkaline than the cell soma. More recently, we have shown that electrical activity in isolated invertebrate neurones can evoke transient cytoplasmic pH gradients, even in the presence of CO2–HCO3− (Schwiening & Willoughby, 2002).
Regional acid shifts in cerebellar Purkinje cells
Using confocal imaging techniques we have observed local changes in pHi within the cell soma and the dendritic regions. In agreement with previous studies, we found that electrical activity evoked small acid shifts in the soma of the Purkinje cells. However, the acid shifts induced in the dendrites during these stimulation protocols were much larger and faster, generating pH microdomains. The dendritic acid shifts were as large as 0.2-0.3 pH units for a modest burst of action potentials (10 s duration), with relatively rapid onset. Previous reports have shown that > 1 min of cell firing is required to evoke a global cellular acid shift of similar amplitude (Trapp et al. 1996). In vivo recordings of Purkinje cell electrical activity have revealed spontaneous bursts of action potential firing that can last 5-15 s, separated by quiescent periods of similar duration (Llinás & Sugimori, 1980). Our findings suggest that this spontaneous activity would be sufficient to induce physiologically significant, transient, dendritic pHi changes. However, we should note that our experiments were all performed at room temperature. It is possible that at 37 °C the kinetics of the pHi shifts are faster, and this may in turn affect the amplitude of the transients.
The regional acid shifts evoked by electrical activity were significantly reduced by the presence of the physiological buffer 5 % CO2–25 mm HCO3−, and inhibition of carbonic anhydrase activity enhanced the size of the acid shifts. These results are broadly expected from the role of CO2–HCO3−, catalysed by carbonic anhydrase, as a hydrogen ion buffer.
Effect of dialysis with Hepes from the patch pipette
Both the Hepes (10 mm) and HPTS (0.5 mm) in our patch solutions will have buffered the intracellular pHi shifts. In addition, some of the experiments presented here would have been performed before the complete dialysis of the Purkinje cell. Thus, these added pH buffers might have been differentially distributed throughout the cell, with a higher concentration at the soma than in the terminal dendrites. This raised soma buffering would have attenuated the pH shifts. However, the effect on the distribution of pH shifts would probably have been small, since 10 mm Hepes has a maximum buffering power of 5.75 mm at pH 7.55, its pK. Assuming an intrinsic buffering power of 11 mm, one might expect the pH transients to have been reduced by, at most, one third. This effect is not large enough to account for the difference we report between the soma and dendrites, even assuming no Hepes in the dendrites. Furthermore, since Hepes has less than half the molecular weight of HPTS, and less charge, it is likely to diffuse faster than HPTS. Since we know HPTS fluorescence, when judged with a thin confocal slice, was fairly uniform throughout the cell, it seems improbable that there were large intracellular Hepes gradients. Furthermore, in the presence of CO2–HCO3− the intracellular Hepes will have been proportionally much less important as a pH buffer. Nevertheless, in order to test this we performed experiments in the absence of added intracellular Hepes. Without Hepes in the patch pipette the pH transients were magnified uniformly throughout the cell. Conversely, in the presence of 30 mm Hepes in the patch pipette the pH transients were reduced, but not abolished.
Accuracy of F/F0 HPTS calibrations
The single wavelength measurements of pH-dependent fluorescence shifts have been calibrated using an equation derived from in vitro data (Schwiening & Willoughby, 2002). This equation allows the pH shift to be calculated from a given fluorescence shift if the pK of HPTS is known and a starting pH can be estimated. The accuracy of this calibration is therefore dependent upon the estimate of the starting pH. Throughout this paper we have assumed that the starting pH is 7.3, the pH of the patch-pipette solution, in all regions. If resting pHi were more alkaline than this then our calibration would have under-estimated the size of the pH shifts. Equally a more acidic pHi would make our reported pH shifts an over-estimate. We have quantified this relationship between pH shift size and resting pH in Fig. 2B. It is also possible that resting pHi is not uniform across the Purkinje cell. Indeed, little is known about the spatial relationship between the acid loading and pH-regulating mechanisms. Considering our mean acid shifts in Hepes, an extreme pH gradient within the cell, pH 6.5 in the dendrites and pH 7.5 in the soma, would nullify the difference between the soma and dendritic acid shifts. In the case of CO2–HCO3−, a pH of 1 would be required in the dendrites to make the acid shifts equal in size! But such large differences in the steady-state pHi values could not account for the different kinetics of the regional acid shifts. It seems unlikely to us that ‘steady-state’ regional pH, even in the presence of CO2–HCO3− is uniform throughout such a ramified arborization, and the absolute size of the acid shifts are likely to vary throughout the dendritic tree.
Mechanisms underlying the pH microdomains
The mechanisms that underlie the activity-induced acid shifts appear to be calcium dependent. Small acid shifts recorded from neuronal cell bodies during electrical activity have been linked to calcium extrusion, via the plasma membrane calcium ATPase (PMCA), in exchange for protons (Schwiening et al. 1993; Trapp et al. 1996). The PMCA is expressed at high density in Purkinje cell dendritic regions (Hillman et al. 1996) and might be responsible (at least in part) for the large dendritic acid shifts reported in this paper. The same mechanism may account for the transient extracellular alkaline shifts seen in cerebellar tissue during stimulation of presynaptic excitatory parallel fibres (Kraig et al. 1993). Chesler & Rice (1991) found the transient extracellular alkaline shifts to be much greater in the molecular layer of the cerebellum (Purkinje cell dendritic region) than the Purkinje layer (somatic region). These regional extracellular pH measurements parallel the pHi measurements reported here. Other potential sources of the activity-induced acid shifts in Purkinje cells include proton release from an intracellular source such as the mitochondria (Werth & Thayer, 1994), or channel-mediated HCO3− transport (Kaila & Voipio, 1987; Luckermann et al. 1997). The acidifications we report in this study are unlikely to be mediated via HCO3− fluxes through GABA-gated chloride channels, as they are larger in the nominal absence of HCO3−, are not blocked by the GABAA antagonists and depend upon calcium influx. The acid shift may be larger in dendritic regions due to their greater surface area to volume ratio than the cell soma. Movement of proton equivalents into or out of the plasma cytosol will result in more dramatic changes in pH in more spatially restricted regions. However, we have shown that the pHi shifts seen in regions with similar surface area to volume ratio can also vary greatly within a single cell (Fig. 6D). It is possible that spread of the depolarizing current may shape this distribution as much as the regional architecture. Previous studies have shown that it is very difficult to establish a good space clamp of an adult Purkinje cell, and that there is a significant reduction of somatic depolarizing potentials 50 μm from the cell soma (De Schutter & Bower, 1994; Stuart & Hausser, 1994). Although a somatically evoked action potential is greatly attenuated by the electrotonic properties of the Purkinje cell, it has been suggested that a high frequency train of somatic spikes, under caesium-rich conditions, can produce a steady depolarization of the distal dendrites (Rapp et al. 1994). It is probable, in this study, that the dendrites were less depolarized than the soma. If we were able to achieve a better space clamp, the depolarization-evoked acid shifts would probably be even greater. Furthermore, pHi heterogeneity may be enhanced by regional differences in resting pHi and proton buffering. The intrinsic proton buffering power of rat cerebellar Purkinje cells in primary culture is estimated to be ≈11 mm (Gaillard & DuPont, 1990). These authors also predict that the total proton buffering power should increase to 37 mm in 5 % CO2–25 mm HCO3− buffered saline. These values appear to be based on global pHi measurements from single Purkinje cells. It is not known how local buffering values may differ within a single cell.
Conclusion
Using confocal imaging and the pH-sensitive dye HPTS we have been able to demonstrate that neuronal electrical activity can produce large intracellular acid shifts in regions that are spatially restricted (dendrites). The sensitivity of HPTS over the physiological pH range, strong fluorescence signal, speed of diffusion into the distal dendrites (observed in this study) and the lack of inhibition of the PMCA (unlike 2′,7′-bis (2-carboxyethyl)-5,6-carboxyfluorescein; Gatto & Milanick, 1993) make it a useful tool for such measurements. The dendritic acid shifts, evoked by action potential firing in CO2–HCO3− buffer, are sufficiently large to alter cellular activity. Hence, we propose that the acid shifts may be involved in modulating processes such as synaptic function. Such pH signalling might act globally throughout the dendritic tree, or in very localized regions that receive strong presynaptic excitatory inputs. These highly localised pH signals would be sculpted by regional pH-regulating mechanisms and diffusive pathways that have not been investigated to date. It is possible that some activity-dependent synaptic responses, previously ascribed to either the passage of time or the influx of calcium, might be mediated by changes in local pH. These findings provide a new perspective for the importance of activity-dependent pHi shifts and their role in neuronal function.
Acknowledgments
We thank the MRC for financial support (G9900364), Jon Holdich for expert technical help, the MRC calcium co-operative (G9900182) for useful discussions, and Roger Thomas for his critical reading of the manuscript.
REFERENCES
- Ahmed Z, Connor JA. Intracellular pH changes induced by calcium influx during electrical activity in molluscan neurons. Journal of General Physiology. 1980;75:403–426. doi: 10.1085/jgp.75.4.403. [DOI] [PMC free article] [PubMed] [Google Scholar]
- Amos BJ, Pocock G, Richards CD. On the role of bicarbonate as a hydrogen ion buffer in rat CNS neurones. Experimental Physiology. 1996;81:623–632. doi: 10.1113/expphysiol.1996.sp003963. [DOI] [PubMed] [Google Scholar]
- Ballanyi K, Kaila K. Activity-evoked changes in intracellular pH. In: Kaila K, Ransom BR, editors. pH and Brain Function. New York: Wiley-Liss; 1998. pp. 291–308. chap. 16. [Google Scholar]
- Boron WF, De Weer P. Active proton transport stimulation by CO2/HCO3−, blocked by cyanide. Nature. 1976;259:240–241. doi: 10.1038/259240a0. [DOI] [PubMed] [Google Scholar]
- Chesler M. The regulation and modulation of pH in the nervous system. Progress in Neurobiology. 1990;34:401–427. doi: 10.1016/0301-0082(90)90034-e. [DOI] [PubMed] [Google Scholar]
- Chesler M, Rice ME. Extracellular alkaline acid pH shifts evoked by iontophoresis of glutamate and aspartate in turtle cerebellum. Neuroscience. 1991;41:257–267. doi: 10.1016/0306-4522(91)90214-9. [DOI] [PubMed] [Google Scholar]
- De Schutter E, Bower JM. An active membrane model of the cerebellar Purkinje cell I. Stimulation of current clamps in slice. Journal of Neurophysiology. 1994;71:375–400. doi: 10.1152/jn.1994.71.1.375. [DOI] [PubMed] [Google Scholar]
- Dickens CJ, Gillespie JI, Greenwell JR. Interactions between intracellular pH and calcium in single-mouse neuroblastoma (N2A) and pheochromocytoma cells (PC12) Quarterly Journal of Experimental Physiology and Cognate Medical Sciences. 1989;74:671–679. doi: 10.1113/expphysiol.1989.sp003319. [DOI] [PubMed] [Google Scholar]
- Eilers J, Augustine GJ, Konnerth A. Subthreshold synaptic Ca2+ signalling in fine dendrites and spines of cerebellar Purkinje neurons. Nature. 1995;373:155–158. doi: 10.1038/373155a0. [DOI] [PubMed] [Google Scholar]
- Gaillard S, Dupont JL. Ionic control of intracellular pH in rat cerebellar Purkinje cells maintained in culture. Journal of Physiology. 1990;425:71–83. doi: 10.1113/jphysiol.1990.sp018093. [DOI] [PMC free article] [PubMed] [Google Scholar]
- Gatto C, Milanick MA. Inhibition of the red blood cell calcium pump by eosin and other fluorescein analogues. American Journal of Physiology. 1993;264:C1577–1586. doi: 10.1152/ajpcell.1993.264.6.C1577. [DOI] [PubMed] [Google Scholar]
- Grichtchenko I, Chesler M. Calcium and barium-dependent extracellular alkaline shifts evoked by electrical activity in rat hippocampal slices. Neuroscience. 1996;75:1117–1126. doi: 10.1016/0306-4522(96)00293-x. [DOI] [PubMed] [Google Scholar]
- Gruol DL, Netzeband JG, Parsons KL. Ca2+ signaling pathways linked to glutamate receptor activation in the somatic and dendritic regions of cultured cerebellar Purkinje neurons. Journal of Neurophysiology. 1996;76:3325–3340. doi: 10.1152/jn.1996.76.5.3325. [DOI] [PubMed] [Google Scholar]
- Hillman DE, Chen S, Bing R, Penniston JT, Llinás R. Ultrastructural localization of the plasmalemmal calcium pump in cerebellar neurons. Neuroscience. 1996;72:315–324. doi: 10.1016/0306-4522(95)00518-8. [DOI] [PubMed] [Google Scholar]
- Kaila K, Voipio J. Postsynaptic fall in intracellular pH induced by GABA-activated bicarbonate conductance. Nature. 1987;330:163–165. doi: 10.1038/330163a0. [DOI] [PubMed] [Google Scholar]
- Knöpfel T, Anchisi D, Alojado ME, Tempia F, Strata P. Elevation of intradendritic sodium concentration mediated by synaptic activation of metabotropic glutamate receptors in cerebellar Purkinje cells. European Journal of Neuroscience. 2000;12:2199–2204. doi: 10.1046/j.1460-9568.2000.00122.x. [DOI] [PubMed] [Google Scholar]
- Konnerth A, Dreessen J, Augustine GJ. Brief dendritic calcium signals initiate long-lasting synaptic depression in cerebellar Purkinje cells. Proceedings of the National Academy of Sciences of the USA. 1992;89:7051–7055. doi: 10.1073/pnas.89.15.7051. [DOI] [PMC free article] [PubMed] [Google Scholar]
- Kraig RP, Ferreira-Filho CR, Michelson C. Alkaline and acid transients in cerebellar microenvironment. Journal of Neurophysiology. 1983;49:831–850. doi: 10.1152/jn.1983.49.3.831. [DOI] [PubMed] [Google Scholar]
- Llinás R, Sugimori M. Electrophysiological properties of in vitro Purkinje cell dendrites in mammalian cerebellar slices. Journal of Physiology. 1980;305:197–213. doi: 10.1113/jphysiol.1980.sp013358. [DOI] [PMC free article] [PubMed] [Google Scholar]
- Luckermann M, Trapp S, Ballanyi K. GABA- and glycine-mediated fall of intracellular pH in rat medullary neurones in situ. Journal of Neurophysiology. 1997;77:1844–1852. doi: 10.1152/jn.1997.77.4.1844. [DOI] [PubMed] [Google Scholar]
- Meech RW, Thomas RC. Effect of measured calcium chloride injections on the membrane potential and internal pH of snail neurones. Journal of Physiology. 1980;298:111–129. doi: 10.1113/jphysiol.1980.sp013070. [DOI] [PMC free article] [PubMed] [Google Scholar]
- Rapp M, Segev I, Yarom Y. Physiology, morphology and detailed passive models of guinea-pig cerebellar Purkinje cells. Journal of Physiology. 1994;474:101–118. doi: 10.1113/jphysiol.1994.sp020006. [DOI] [PMC free article] [PubMed] [Google Scholar]
- Schwiening CJ, Boron WF. Regulation of intracellular pH in pyramidal neurons from the rat hippocampus by Na+-dependent Cl−-HCO3− exchange. Journal of Physiology. 1994;475:59–67. doi: 10.1113/jphysiol.1994.sp020049. [DOI] [PMC free article] [PubMed] [Google Scholar]
- Schwiening CJ, Kennedy HJ, Thomas RC. Calcium-hydrogen exchange by the plasma membrane Ca-ATPase of voltage-clamped snail neurons. Proceedings of the Royal Society B. 1993;253:285–289. doi: 10.1098/rspb.1993.0115. [DOI] [PubMed] [Google Scholar]
- Schwiening CJ, Willoughby D. Depolarization-induced pH microdomains and their relationship to calcium transients in isolated snail neurones. Journal of Physiology. 2002;538:371–382. doi: 10.1113/jphysiol.2001.013055. [DOI] [PMC free article] [PubMed] [Google Scholar]
- Stewart AK, Boyd CA, Vaughan-Jones RD. A novel role for carbonic anhydrase: cytoplasmic pH gradient dissipation in mouse small intestine enterocytes. Journal of Physiology. 1999;516:209–217. doi: 10.1111/j.1469-7793.1999.209aa.x. [DOI] [PMC free article] [PubMed] [Google Scholar]
- Stuart G, Häusser M. Initiation and spread of sodium action potentials in cerebellar Purkinje cells. Neuron. 1994;13:703–712. doi: 10.1016/0896-6273(94)90037-x. [DOI] [PubMed] [Google Scholar]
- Tank DW, Sugimori M, Connor JA, Llinás RR. Spatially resolved calcium dynamics of mammalian Purkinje cells in cerebellar slice. Science. 1988;242:773–777. doi: 10.1126/science.2847315. [DOI] [PubMed] [Google Scholar]
- Thomas RC. The effect of carbon dioxide on the intracellular pH and buffering power of snail neurones. Journal of Physiology. 1976;255:715–735. doi: 10.1113/jphysiol.1976.sp011305. [DOI] [PMC free article] [PubMed] [Google Scholar]
- Tombaugh GC. Intracellular pH buffering shapes activity-independent Ca2+ dynamics in dendrites of CA1 interneurons. Journal of Neurophysiology. 1998;80:1702–1712. doi: 10.1152/jn.1998.80.4.1702. [DOI] [PubMed] [Google Scholar]
- Trapp S, Luckermann M, Kaila K, Ballanyi K. Acidosis of hippocampal neurones mediated by a plasmalemmal Ca2+/H+ pump. NeuroReport. 1996;7:2000–2004. doi: 10.1097/00001756-199608120-00029. [DOI] [PubMed] [Google Scholar]
- Werth JL, Thayer SA. Mitochondria buffer physiological calcium loads in cultured rat dorsal root ganglion neurons. Journal of Neuroscience. 1994;14:348–356. doi: 10.1523/JNEUROSCI.14-01-00348.1994. [DOI] [PMC free article] [PubMed] [Google Scholar]
- Willoughby D, Schwiening CJ. Action potential firing induces large acid shifts in rat cerebellar Purkinje cell dendrites. Journal of Physiology. 2001;536.P:122P. [Google Scholar]
- Zhan RZ, Fujiwara N, Tanaka E, Shimoji K. Intracellular acidification induced by membrane depolarization in rat hippocampal slices: roles of intracellular Ca2+ and glycolysis. Brain Research. 1998;780:86–94. doi: 10.1016/s0006-8993(97)01149-9. [DOI] [PubMed] [Google Scholar]