

Abstract
During fictive locomotion the excitability of adult cat lumbar motoneurones is increased by a reduction (a mean hyperpolarization of ≈6.0 mV) of voltage threshold (Vth) for action potential (AP) initiation that is accompanied by only small changes in AP height and width. Further examination of the experimental data in the present study confirms that Vth lowering is present to a similar degree in both the hyperpolarized and depolarized portions of the locomotor step cycle. This indicates that Vth reduction is a modulation of motoneurone membrane currents throughout the locomotor state rather than being related to the phasic synaptic input within the locomotor cycle. Potential ionic mechanisms of this locomotor-state-dependent increase in excitability were examined using three five-compartment models of the motoneurone innervating slow, fast fatigue resistant and fast fatigable muscle fibres. Passive and active membrane conductances were set to produce input resistance, rheobase, afterhyperpolarization (AHP) and membrane time constant values similar to those measured in adult cat motoneurones in non-locomoting conditions. The parameters of 10 membrane conductances were then individually altered in an attempt to replicate the hyperpolarization of Vth that occurs in decerebrate cats during fictive locomotion. The goal was to find conductance changes that could produce a greater than 3 mV hyperpolarization of Vth with only small changes in AP height (< 3 mV) and width (< 1.2 ms). Vth reduction without large changes in AP shape could be produced either by increasing fast sodium current or by reducing delayed rectifier potassium current. The most effective Vth reductions were achieved by either increasing the conductance of fast sodium channels or by hyperpolarizing the voltage dependency of their activation. These changes were particularly effective when localized to the initial segment. Reducing the conductance of delayed rectifier channels or depolarizing their activation produced similar but smaller changes in Vth. Changes in current underlying the AHP, the persistent Na+ current, three Ca2+ currents, the ‘h’ mixed cation current, the ‘A’ potassium current and the leak current were either ineffective in reducing Vth or also produced gross changes in the AP. It is suggested that the increased excitability of motoneurones during locomotion could be readily accomplished by hyperpolarizing the voltage dependency of fast sodium channels in the axon hillock by a hitherto unknown neuromodulatory action.
During fictive locomotion in adult cat, spinal motoneurones exhibit changes in intrinsic membrane properties during the transition from the resting to the locomotor state. These state-dependent changes include a reduction in the post-spike afterhyperpolarization (AHP) (Brownstone et al. 1992; Schmidt, 1994) and a change in the relation between intracellular current injection and firing frequency (Brownstone et al. 1992; Fedirchuk et al. 1998). Krawitz et al. (2001) recently described another state-dependent change in motoneurone excitability accompanying the transition to locomotion: a hyperpolarization of the voltage threshold (Vth) for action potential (AP) initiation. While the mechanisms for this enhancement of motoneuronal excitability are unknown, the authors postulated that this effect might be mediated by neuromodulators released during locomotor activity (Krawitz et al. 2001).
The primary aim of the present study was to determine possible ionic mechanisms that might account for hyperpolarization of Vth in cat lumbar motoneurones during fictive locomotion. To this end, we built three models corresponding to three biophysical types of motoneurones (S, slow; FR, fast, fatigue resistant; FF, fast fatigable) with properties resembling those of real motoneurones recorded in vivo. The models were built with five compartments (axon, initial segment, soma, proximal dendrite and distal dendrite) of unequal size that approximated a simplified anatomical structure of real motoneurones. The passive membrane properties of the models were based on data from cat spinal motoneurones. Parameters for the 10 active conductances included in the models were taken primarily from the literature for mammalian spinal motoneurones. The ten conductances were: fast sodium (gNa), persistent sodium (gNaP), delayed rectifier potassium (gK(DR)), A-current (gK(A)), calcium-dependent potassium (gK(AHP)), T-type calcium (gCa,T), L-type calcium (gCa,L), N-type calcium (gCa,N), h-current (gh) and potassium leak current (gleak). The models were constrained to the biophysical properties of adult cat spinal motoneurones, and target values for the simulations were taken from intracellular in vivo electrophysiological recordings of motoneurones firing during fictive locomotion. Because the hyperpolarization of Vth has been observed in all types of motoneurones (Krawitz et al. 2001), the FF, FR and S models of motoneurones were constructed and used to detect common changes in active properties that might produce the Vth hyperpolarization during locomotion. It was shown in our recent study (Krawitz et al. 2001) and confirmed here that the Vth hyperpolarization occurs in both the excitatory and inhibitory phases of the fictive step cycle. This suggests that a modulation of ion channels during the locomotor state was responsible for the hyperpolarization of Vth rather than direct postsynaptic effects in only one phase of the step cycle.
The simulation results predict that the selective modulation of sodium and/or delayed-rectifier channels in the axon hillock/initial segment are likely to be ionic mechanisms through which Vth may be controlled in all types of motoneurones. Portions of this work have been presented in abstract form (Dai et al. 1998a,b).
METHODS
Anatomical structure
The geometry of the models was that of a simplified cylindrical structure (Fig. 1A). Since the hyperpolarization of Vth was shown to be not directly linked to the periodic synaptic excitation and inhibition during fictive locomotion (see Krawitz et al. 2001 and Results in this paper), the effects of synaptic inputs were not further considered in the models. The dendrites of the model motoneurones were simplified as two compartments. The diameter and length of the proximal dendrite compartment were adjusted to make the amplitude of the SD spike appropriate (Coombs et al. 1957). The size of the distal dendrite was set arbitrarily because it had a relatively small effect on spike generation and action potential shape in these models. In addition to the two dendritic compartments, the models had an axon, initial segment, and soma for a total of five compartments, and conserved the surface membrane area of initial segment and soma (Conradi 1969; Cullheim et al. 1987). The size of the axon compartment was adjusted to produce an appropriate initial segment spike (Coombs et al. 1957).
Figure 1. Single cell models and initial properties.
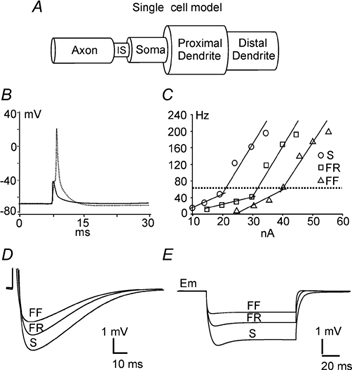
A, three types of single cell models (S, FR and FF) with five compartments (axon, initial segment (IS), soma, proximal dendrite and distal dendrite) were built that retained the macro structure of cat lumbar motoneurones important for the generation of anti- and orthodromic action potentials. B, overlap of the SD and initial segment spikes produced by the S-type model motoneurone. The amplitude of the SD spike is ≈67 mV and the initial segment spike ≈30 mV. C, frequency-current (f-I) relation produced by step current injection into the soma compartments of the three types of model cell (S, FR and FF). The frequency was calculated by dividing the number of spikes by the duration (500 ms) of each step current. The slopes of the primary range for the three models are 3.4, 1.8 and 3.6 Hz nA−1, respectively (below the horizontal dotted line), and the slopes of the secondary range are 12, 13 and 11 Hz nA−1 (above the dotted line). D, truncated SD spikes taken from the antidromic single spikes produced by the three types of the model cell. Spikes were overlapped on the alignment of their resting membrane potentials. The afterhyperpolarization (AHP) durations are 100, 85 and 80 ms for the S, FR and FF type models, respectively, and the amplitudes of the AHP are 4, 3 and 2 mV, respectively. E, passive responses of the models to an injection of −2 nA of current into the soma compartment. The voltage trajectories are aligned on the resting membrane potentials. The membrane hyperpolarizations produced by a −2 nA current injection were −3.2 mV for the S-type model cell, −2.0 mV for the FR-type and −1.2 mV for the FF-type.
Three types of model motoneurones were built based on the assumption that the different properties of the biophysical types of motoneurone were determined by their anatomical structure (size) and passive and active properties. Studies by Cullheim et al. (1987) suggested that there is little difference in the averaged soma diameters of the F- and S-type cells, but the dendritic trees of F-type motoneurones have more complex branching than S-type. Our models followed the same principle. The FR-, FF- and S-type of model motoneurones had the same size of axon, initial segment and soma compartments. The only difference was the size of dendrite compartments (Table 1).
Table 1.
Structural characteristics of the motoneurone models and their cable parameters
| MN type | Diameter (μm) | Length (μm) | RM(Ωcm2) | RA (Ω cm) | CM (μF cm−2) |
|---|---|---|---|---|---|
| S-type | |||||
| Axon | 10 | 400 | 7000 | 20 | 1.0 |
| Initial segment | 6 | 100 | 7000 | 20 | 1.0 |
| Soma | 10 | 360 | 7000 | 20 | 1.0 |
| Proximal dendrite | 40 | 500 | 7000 | 60 | 1.0 |
| Distal dendrite | 30 | 400 | 7000 | 60 | 1.0 |
| FR-type | |||||
| Axon | 10 | 400 | 5000 | 20 | 1.0 |
| Initial segment | 6 | 100 | 5000 | 20 | 1.0 |
| Soma | 10 | 360 | 5000 | 20 | 1.0 |
| Proximal dendrite | 40 | 700 | 5000 | 60 | 1.0 |
| Distal dendrite | 30 | 500 | 5000 | 60 | 1.0 |
| FF-type | |||||
| Axon | 10 | 400 | 4000 | 20 | 1.0 |
| Initial segment | 6 | 100 | 4000 | 20 | 1.0 |
| Soma | 10 | 360 | 4000 | 20 | 1.0 |
| Proximal dendrite | 40 | 700 | 4000 | 60 | 1.0 |
| Distal dendrite | 30 | 500 | 4000 | 60 | 1.0 |
Our simplification of the dendrites ignored electrotonic properties resulting from branching and termination of the dendrites. The total electrotonic lengths are 0.59, 0.79 and 0.89 for S-, FR- and FF-type model motoneurones, respectively. These values are smaller than those reported for real motoneurones and reflect the rather small distal dendritic compartments in the present models. This reduction would hinder examination of the response to synaptic inputs, but is unlikely to influence the spike initiation in the initial segment and soma under investigation here.
Passive parameters
Each compartment (Table 1) had a specific membrane capacitance (CM) of 1.0 μF cm−2. Specific membrane resistance (RM) was the same in all five compartments and was set to 7000, 5000 and 4000 Ω cm2 for S-, FR- and FF-type, respectively. These values were chosen to give theoretical values of the membrane time constant (RMCM) of the model motoneurone comparable to that of the corresponding type of cat lumbar motoneurone reported by Hochman & McCrea (1994a,b). Specific axial resistance (RA) was set to 20 Ω cm in the axon, initial segment and soma compartments for all three types of model motoneurones and was adjusted to 60 Ω cm in the dendrite compartments to make the spike height and repetitive firing properties appropriate (e.g. Coombs et al. 1957; Kernell 1965). These parameters are summarized in Table 1.
Active parameters
To model the repetitive firing behaviour of motoneurones, a variety of ionic currents were introduced into some or all compartments. We first chose nine major active conductances (gNa, gK(DR), gK(A), gK(AHP), gCa,T, gCa,L, gCa,N, gh, gleak) for the models that have been widely found in mammalian motoneurones, including cat, rat and mouse motoneurones (Binder et al. 1996). A tenth conductance, a persistent sodium conductance (gNaP), was later added to the models based on a recent report that this conductance was essential for initiation of spikes during rhythmic firing in cat spinal motoneurones (Lee & Heckman 2001). As the actual kinetics of these conductances are not known in adult cat spinal motoneurones, parameters for the equations were drawn from a wide range of experimental and theoretical results.
gNa
The fast sodium conductance was included in the axon, initial segment and soma compartments. The state variable of this conductance was based on Traub's model (1977) for cat spinal motoneurones (Araki & Terzuolo, 1962), where the voltage dependency of the initial segment gNa was about 10 mV more hyperpolarized than that of the somatic gNa. In our models, the voltage dependency of the initial segment gNa was further shifted to the hyperpolarizing direction by 5 mV for the S- and FR-type and by 6 mV for the FF-type motoneurones. The density of the maximum conductance (gmax) was set to 120, 240 and 200 mS cm−2 for axon, initial segment and soma compartments, respectively, in all three models. In Traub's model (1977) the gmax of sodium channels in the initial segment compartment was set three times larger than that in the soma compartment, resulting in a lower Vth within the initial segment compartment. Our models achieved the Vth difference between the initial segment and soma compartments with a smaller difference between the gmax by negatively shifting the voltage dependency of the initial segment gNa.
gK(DR)
The delayed rectifier potassium conductance was included in the axon, initial segment and soma compartments. The state variable for this channel was taken from Traub (1977) for cat spinal motoneurones, with an activation of initial segment gK(DR) also 10 mV more hyperpolarized from the somatic gK(DR). The values of gmax were set to 40, 110 and 35 ms cm−2 for axon, initial segment and soma compartment, respectively, in all three models.
gK(A)
The A-current was included in the soma compartment. Parameters for this conductance were based on a previous report for rat motoneurones (Safronov & Vogel, 1995). In our models, the voltage dependency of both activation and inactivation curves was positively shifted by 10 mV in order to match the recordings of fast A-current from guinea-pig trigeminal motoneurones (Chandler et al. 1994). The gmax was set to 5.5 mS cm−2 for all three models, roughly based on the report by Safronov & Vogel (1995).
gh
The h-current was included in the soma compartment. The state variable for h-current of spinal motoneurones was based on Binder (1996). The gmax was set to 6.5, 6.5 and 4.5 mS cm−2 for S-, FR- and FF-type model motoneurones, respectively. These settings, along with leak current, resulted in an appropriate input resistance in the models.
gCa,T
The T-type calcium conductance was included in the soma compartment with parameters based on Tegner et al. (1997) for lamprey neurones. However, the voltage dependency of the state variables (both activation and inactivation) was positively shifted by 20 mV to approximate the recordings from neonatal rat hypoglossal motoneurones (Viana et al. 1993a; Umemiya & Berger, 1994) and mouse motoneurones (Mynlieff & Beam, 1992). The gmax was set to 4 mS cm−2 for all three models.
gCa,N
The N-type calcium conductance was included in the soma and proximal dendrite compartments with parameters of turtle motoneurones from Booth et al. (1997). In our models a 10 mV shift in the depolarizing direction was made for the voltage dependency of the conductance in order to make this channel high-voltage activated (HVA). The gmax was set to 12 and 1.5 mS cm−2 for the soma and proximal dendrite compartments, respectively, in all three types of the model motoneurones. Current from this channel was used to gate the AHP conductance (gK(AHP)).
gCa,L
The L-type calcium conductance was included in the soma and proximal dendrite compartments with parameters of turtle motoneurones from Booth et al. (1997). The voltage activation was positively shifted by 10 mV to make the channel relatively high-voltage activated and to approximate the behaviours of L-type calcium channels in rat hippocampal CA3 pyramidal neurones (Avery & Johnston, 1996). The activation of L-type calcium channels in spinal cat motoneurones was about 10-30 mV positive to the resting membrane potential (Schwindt & Crill, 1980). The gmax was set to 2 mS cm−2 for the soma and 0.33 mS cm−2 for the proximal dendrite compartment in all three models.
gK(AHP)
The AHP conductance was included in the soma and proximal dendrite compartments. This conductance was dependent on the intracellular calcium concentration, which was determined by activation of gCa,N. Parameters for this channel were based on Traub et al. (1991) for guinea-pig CA3 pyramidal neurones. The rate constants were adjusted to generate a small time constant, which reduced accumulation of AHP current and produced an appropriate repetitive firing behaviour and f-I relationship (Kernell, 1965). The gmax was set to 8, 10 and 18 mS cm−2 for the soma, and 3, 6 and 6 mS cm−2 for the proximal dendrite compartment for the S-, FR- and FF-types of model motoneurones, respectively.
gleak
The leak current was included in the soma and proximal dendrite compartments. It was a potassium conductance, having an effect on input resistance and resting membrane potential. The gmax was set to 0.35, 0.6 and 0.9 ms cm−2 for the soma, and 0.3, 0.6 and 1.5 ms cm−2 for the proximal dendrite compartment for the S-, FR- and FF-types of model motoneurones, respectively. These settings resulted in an appropriate input resistance and resting membrane potential.
gNaP
The persistent sodium conductance was included in the initial segment and soma compartments. gNaP activated about 10 mV negative to the fast gNa with a magnitude ≈1 % of the fast INa (Crill, 1996). Parameters for gNaP in our model were modified from the somatic gNa for cat spinal motoneurones. The inactivation of state variables was removed, and the activation voltage was negatively shifted by 10 mV. The gmax was set to 12 mS cm−2 (≈5 % of initial segment gNa) for initial segment compartment and 3 mS cm−2 (≈1.5 % of somatic gNa) for soma compartment in all three models.
Cable equations
The simulations were done in the GENESIS environment (Bower & Beeman, 1998) on Pentium PCs running the Linux operating system. The time step for all the simulations was set to 0.05 ms. Three variations of a five compartment single cell models (Fig. 1A) were built. In general, the cable equation for compartment k (=2, 3 or 4) can be written as:
| (1) |
where Vk-1, Vk and Vk+1 are membrane potentials of the compartments k – 1, k and k + 1; gk-1,k and gk,k + 1 are conductances between the compartments k – 1 and k and compartments k and k + 1; Ck is the capacitance of the compartment k; Iinjected,k is the injected current to the compartment k and Iionic,k is the ionic current of the compartment k. For the soma compartment Iionic,k is written as
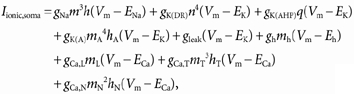 |
(2) |
where gNa is the maximum conductance for fast Na+ channels and the maximum conductances through other channel types are expressed as follows: gK(DR), delayed rectifier K+; gK(AHP), Ca2+-dependent K+; gK(A), A-currents; gleak, leak currents; gh, h-current; gCa,T, T-type Ca2+; gCa,N, N-type Ca2+; and gCa,L, L-type Ca2+. ENa, EK, ECa and Eh are equilibrium potentials for Na+, K+, Ca2+ and h-currents and equal to 55 mV, −75 mV, 80 mV and −55 mV, respectively. Letters m, h, n and q (with or without subscripts) are membrane state variables that are defined by the Hodgkin-Huxley-type equation:
| (3) |
where steady-state value X∞ = α/(α+ β) and time constant τ = 1/(α+ β).
The intracellular calcium concentration ([Ca2+]i) in the soma and dendrite compartments satisfies the following equation (Traub et al. 1991):
| (4) |
where B is a scaling constant in arbitrary units and set to −17.402 in the soma compartment and −10.769 in the dendrite compartment. τCa is a time constant, the rate of decay of [Ca2+]i. It is set to 13.33 ms for both soma and dendrite compartments. ICa is equivalent to the N-type Ca2+ current.
The passive parameters of the models are shown in Table 1, rate constants in Table 2 and the membrane properties of the resultant model motoneurones in Table 3.
Table 2.
Rate constants in Hodgkin–Huxley equations
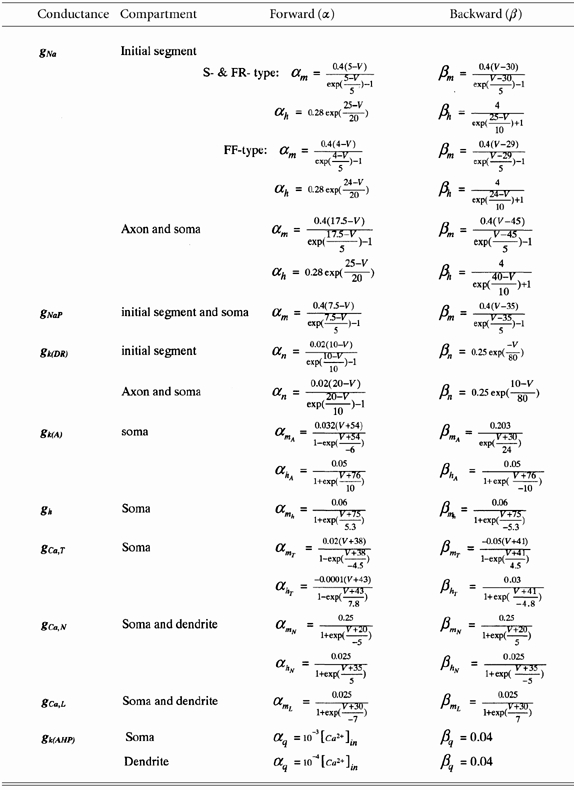
Table 3.
Membrane properties of three motoneurone types produced by the models
| Properties of model cell | S-type model cell | FR-type model cell | FF-type model cell |
|---|---|---|---|
| Rin (MΩ)* | 1.6 (1.77 ± 0.7) | 1.0 (0.91 ± 0.2) | 0.6 (0.62 ± 0.1) |
| Rheobase (nA)* | 6.0 (4.3 ± 2.5) | 13.0 (11.6 ± 3.1) | 23.0 (19.7 ± 5.1) |
| τm(ms)* | 7.0 (7.0 ± 2.0) | 5.0 (5.1 ± 1.1) | 4.0 (4.4 ± 0.9) |
| AHP duration (ms)* | 100 (110.5 ± 31.5) | 85.0 (81.9 ± 17.1) | 80.0 (79.5 ± 21.4) |
| AHP amplitude (mV)* | 4.0 (4.8 ± 2.0) | 3.0 (3.1 ± 1.1) | 2.0 (2.3 ± 0.9) |
| AP height (mV)† | 67.0 (58.5 ± 9.7) | 62.4 (58.5 ± 9.7) | 68.0 (58.5 ± 9.7) |
| AP width (ms)† | 3.7 (2.2 ± 0.4) | 3.4 (2.2 ± 0.4) | 3.3 (2.2 ± 0.4) |
| Vth(mV)† | −47.2 (−44.1 ± 9.3) | −46.7 (−44.1 ± 9.3) | −49.0 (−44.1 ± 9.3) |
| Resting Em(mV)† | −65.0 (−66.8 ± 6.2) | −67.0 (−66.8 ± 6.2) | −70.0 (−66.8 ± 6.2) |
Values outside parentheses are the results from simulations in the three types of model cells. Rin was measured from membrane hyperpolarizationproduced by longpulse (−2 nA, 100 ms) current injection into the soma compartment. Vth, AP height and width were measured from an average of the spikes elicited by a ramp of current injected into the soma compartment. AHP duration and amplitude were measured from a single SD-spike evoked by an antidromic short pulse (1 m) to the axon compartment. Values in parentheses are means (s.d.) of measurements obtained experimentally in adult cat motoneurones
The method used to measure AP height and Vth in this paper was different from that used in Hochman & McCrea (1994a,b,c). This resulted in different values ofthe AP height and Vth in Table 3 from those in Hochman & McCrea.
Electrophysiological behaviour of the models
The self-imposed criteria that the model had to meet to be accepted as a suitable representation of a spinal motoneurone were: (1) an input resistance, a membrane time constant, AHP and rheobase comparable to those reported for a cat lumbar motoneurone; (2) an initial segment spike that is separable from the somatodendritic spike (SD spike); (3) a realistic frequency-current (f-I) relationship; and (4) a Vth within the range of the experimental data.
To achieve different membrane properties for each type of model motoneurone, the voltage dependency of the initial segment gNa, the gmax of somatic and dendritic gK(AHP) and gleak and the gmax of somatic gh were altered. The target values defining different cell types were taken from adult cat motoneurones (Hochman & McCrea, 1994b,c; Krawitz et al. 2001). These included input resistance, rheobase current, time constant, AHP duration and amplitude, AP height and Vth. The resting membrane potential (Em) and AP width of the models are resultant values (see Table 3).
Some of the resulting biophysical properties of the model motoneurones are illustrated in Fig. 1. Figure 1B (dotted line) shows an antidromic action potential (SD spike) elicited by injecting a pulse of current (15 nA, 1 ms) into the axon compartment. Hyperpolarization of the soma by injecting a −2 nA current into the soma compartment blocked the SD portion of this action potential leaving the smaller initial segment spike (continuous line). The f-I relations are illustrated in Fig. 1C, and the characteristics of the AHPs are shown in Fig. 1D. The response to a −2 nA, 100 ms duration current pulse injected in the soma compartment is shown in Fig. 1E.
To be consistent with measurements obtained from the experimental data, Vth of an action potential was defined as the membrane potential at which dV/dt ≥ 10 mV ms−1 (Brownstone et al. 1992; Krawitz et al. 2001). This membrane potential was then used as the reference value to calculate the height of the action potential, which was considered to be the voltage difference between the Vth and the peak value of the AP. The width of the AP was defined as the time interval between the depolarization and the repolarization of the membrane potentials equal to the Vth. Table 3 shows the resulting parameter values from these simulations.
Our recent experimental data (n = 38, Krawitz et al. 2001) reported a mean value of voltage threshold of −44.1 ± 9.3 mV, with firing evoked by a mean depolarization of 22.6 ± 9.0 mV from resting membrane potential (−66.8 ± 6.2 mV). The voltage thresholds for the models are −47.2 mV for the S-type, −46.7 mV for the FR type and −49.0 mV for the FF-type. About 20 mV of depolarization is needed above resting membrane potentials (S-type: −65 mV; FR-type: −67 mV; and FF-type: −70 mV) to reach the spike threshold. These values are thus within the range of those obtained in decerebrate (Krawitz et al. 2001) and anaesthetized cats (Pinter et al. 1983; Gustafsson & Pinter, 1984).
The repetitive firing evoked by low intensity current injection in the models was similar to that reported for real motoneurones (e.g. Kernell, 1965). The slope of the secondary range of the f-I relation produced by the models did not perfectly match that of cat lumbar motoneurones, which should be within the range of 3-8 Hz nA−1 (Kernell, 1965). The present models produced a relatively high firing frequency due to a saturation of AHP current and a large depolarization produced by the L-type calcium channels in response to high current injections (see f-I curves above the dotted line in Fig. 1C). To avoid this affecting the reliability of our simulation results, the currents injected into the model cells for all simulations were maintained within the primary range of the f-I curves. In addition, the AP width generated by our models in the control condition (Table 3) was about 1 ms larger than the experimental data. This did not influence analysis of simulation results since we were primarily interested in the changes in AP width between simulated control and locomotor conditions.
Constraints for computer simulation of Vth hyperpolarization
This modelling study was based on our recent observation (Krawitz et al. 2001) of Vth hyperpolarization during fictive locomotion (Fig. 2D) where it was noted that hyperpolarization of Vth could occur in the absence of obvious changes in spike amplitude or duration. To create a conservative target value for the present simulation the three cases in which Vth was hyperpolarized more than 19 mV were ignored, resulting in a mean value of 6.2 ± 3.9 mV (n = 35) for Vth hyperpolarization. Experimentally, about 50 % of the cells displayed a Vth hyperpolarization of 3-9 mV (see Fig. 2D). This range was used as the boundary within which the change in Vth (ΔVth) had to fall to be considered a possible mechanism. Data from nine motoneurones in the Krawitz et al. (2001) study were re-analysed to evaluate changes in spike size and shape width during fictive locomotion to provide additional data to constrain the present simulations. During fictive locomotion AP height increased by a mean value of 2.6 ± 6 mV (ranging from −1.6 to 17.3 mV) and AP width by 0.5 ± 0.6 ms (from −0.1 to 1.6 ms). There was no correlation between Vth hyperpolarization and the increase in AP height (r2 = 0.44, P = 0.051) and only a weak correlation between the Vth hyperpolarization and the increase in AP duration (r2 = 0.66, P = 0.007). Therefore, we set less than 3 mV as a desirable change in AP height (ΔH) with an upper boundary of ≤ 10 mV and less than 0.5 ms for change in AP width (ΔW) with an upper boundary of ≤ 1.2 ms. Thus we were most interested in those simulations where (1) Vth hyperpolarized ≥ 3.0 mV; (2) AP height increased ≤ 10 mV; and (3) AP width increased ≤ 1.2 ms.
Figure 2. Intracellular recording from a cat lumbar motoneurone (Krawitz et al. 2001).
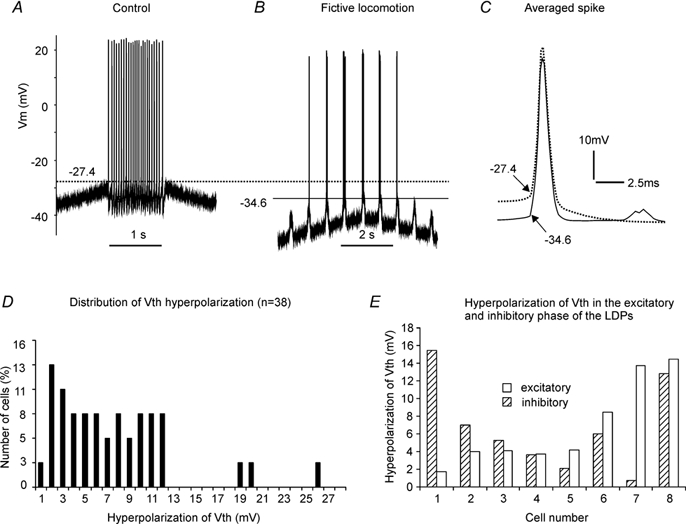
Spikes were evoked by injecting triangular currents (not shown) into the motoneurone before (A) and during fictive locomotion (B). The averaged spikes made from the firing in A and B, respectively, were overlapped in C to show the differences in voltage threshold (Vth), AP height and AP width between control (dotted line) and fictive locomotion (dark line). In this example, the mean Vth, averaged spike height and averaged spike width were −27.4 mV, 52.2 mV and 2.0 ms, respectively, in control and −34.6 mV, 55.9 mV and 2.3 ms, respectively, during fictive locomotion. The motoneurone showed a 7.2 mV hyperpolarization in mean Vth, 3.7 mV increase in AP height and 0.3 ms increase in AP width during fictive locomotion. The distribution of Vth hyperpolarization from 38 motoneurones (Krawitz et al. 2001) is shown in D. Sixteen per cent of the cells displayed a Vth hyperpolarization of 1-3 mV, 47 % of the cells within 3-9 mV, 29 % of the cells within 9-12 mV and 8 % of the cells over 12 mV. Hyperpolarization of Vth measured from eight motoneurones in both the excitatory (open bars) and inhibitory phase (hatched bars) of the LDPs is shown in E (see text for detail). The measurement of Vth and action potential amplitude and width is described in the Methods section. Voltage calibration bar for A and B is shown in A.
Modulation of conductance was simulated in a wide range by altering the maximum conductance or shifting the state variables of the conductance. The simulation ranges for each conductance were: gNa increased up to 200 %; m and h left shifted up to 10 mV; gK(DR) reduced up to 90 %; n right shifted up to 10 mV; gNaP increased up to 300 %; m left shifted up to 10 mV; gK(AHP) reduced up to 90 %; gK(A) reduced up to 90 %; gh increased up to 150 %; gCa,T, gCa,L and gCa,N increased up to 200 %; and gleak increased up to 200 %. The results in Table 4 were collected within these ranges where the simulation results could be produced with minimal amount of the conductance modulation within the constraints outlined above.
Table 4.
Effects of changing individual conductances on threshold properties and spike shape of the models
| ΔVth (mV) | ΔH (mV) | ΔW (ms) | ΔIr (nA) | ||||||||||||||
|---|---|---|---|---|---|---|---|---|---|---|---|---|---|---|---|---|---|
| g | Change in gmax | S | FR | FF | Mean | S | FR | FF | Mean | S | FR | FF | Mean | S | FR | FF | Mean |
| Experimental values | — | — | — | −6.2 | — | — | — | 3.0 | — | — | — | 0.5 | — | — | — | N/A | |
| Initial Segment (I.S.) | |||||||||||||||||
| gNa | shift m & h by-3 mV | −5.6 | −5.7 | −5.2 | −5.5 | 7.0 | 9.3 | 3.0 | 6.4 | 1.2 | 1.3 | 0.5 | 1.0 | −4.0 | −7.0 | −9.0 | −6.7 |
| increased by 50 % | −5.5 | −5.3 | −5.0 | −5.3 | 8.0 | 9.0 | 7.0 | 8.0 | 0.7 | 0.9 | 0.7 | 0.8 | −2.0 | −4.0 | −6.0 | −4.0 | |
| gK(DR) | shift n by 5 mV | −3.0 | −3.5 | −3.0 | −3.2 | 4.2 | 4.7 | 3.0 | 4.0 | 0.3 | 0.7 | 0.0 | 0.3 | −2.0 | −2.0 | −2.0 | −2.0 |
| reduced by 70 % | −3.1 | −3.7 | −3.0 | −3.3 | 5.3 | 7.0 | 5.0 | 5.8 | 0.5 | 0.9 | 0.0 | 0.5 | −2.0 | −2.0 | −2.0 | −2.0 | |
| gNaP | added to I.S. and soma | −1.7 | −1.8 | −1.5 | −1.7 | 4.1 | 6.2 | 5.2 | 5.2 | 1.0 | 0.9 | 0.3 | 0.7 | 0.0 | 0.0 | 0.0 | 0.0 |
| increased by 150% | −2.9 | −3.4 | −3.0 | −3.1 | 6.9 | 9.5 | 7.7 | 8.0 | 1.3 | 1.2 | 0.6 | 1.0 | −1.0 | −1.0 | −1.0 | −1.0 | |
| shift m by −5 mV | −3.2 | −3.4 | −3.0 | −3.2 | 6.6 | 8.5 | 6.2 | 7.1 | 1.6 | 1.3 | 0.5 | 1.1 | −1.0 | −1.0 | 0.0 | −0.7 | |
| Soma | |||||||||||||||||
| gNa | shift m by −4 & h by- 6 mV | −3.1 | −3.7 | −3.0 | −3.3 | −1.0 | 0.0 | −1.2 | −0.7 | 0.7 | 0.5 | 0.0 | 0.4 | −1.0 | −1.0 | −1.0 | −1.0 |
| increased by 100% | −2.0 | −1.5 | −1.5 | −1.7 | 13.0 | 18.0 | 16.0 | 15.7 | 2.3* | 0.4 | 0.0 | 0.9 | −1.0 | −1.0 | −1.0 | −1.0 | |
| gK(DR) | shift n by 5 mV | −2.3 | −3.0 | −2.0 | −2.4 | 3.1 | 6.2 | 4.0 | 4.4 | 1.3 | 1.4 | 0.5 | 1.1 | −1.0 | −2.0 | −1.0 | −1.3 |
| reduced by 50% | −1.5 | −1.0 | −1.0 | −1.2 | 1.6 | 2.6 | 2.0 | 2.1 | 2.6* | 1.2 | 1.0 | 1.6 | 0.0 | 0.0 | 0.0 | 0.0 | |
| gK(AHP) | reduced by 50% | 0.0 | 0.0 | 0.0 | 0.0 | 0.0 | 0.0 | 0.0 | 0.0 | 0.0 | 0.0 | 0.0 | 0.0 | 0.0 | 0.0 | 0.0 | 0.0 |
| gK(A) | reduced by 50% | 0.0 | 0.0 | 0.0 | 0.0 | 0.0 | 0.0 | 0.0 | 0.0 | 0.0 | 0.0 | 0.0 | 0.0 | 0.0 | 0.0 | 0.0 | 0.0 |
| gh | increased by 50% | 0.0 | 0.0 | 0.0 | 0.0 | 0.0 | 0.0 | 0.0 | 0.0 | 0.0 | 0.0 | 0.0 | 0.0 | 0.0 | 0.0 | 0.0 | 0.0 |
| gCaT | increased by 100% | 0.0 | 0.0 | 0.0 | 0.0 | 0.0 | 0.0 | 0.0 | 0.0 | 0.0 | 0.0 | 0.0 | 0.0 | −1.0 | −1.0 | −1.0 | −1.0 |
| gCaL | increased by 100% | 0.0 | 0.0 | 0.0 | 0.0 | 0.0 | 0.0 | 0.0 | 0.0 | 0.0 | 0.0 | 0.0 | 0.0 | −1.0 | −1.0 | −1.0 | −1.0 |
| gCaN | increased by 100% | 0.0 | 0.0 | 0.0 | 0.0 | 0.0 | 0.0 | 0.0 | 0.0 | 0.0 | 0.0 | 0.0 | 0.0 | 0.0 | 0.0 | 0.0 | 0.0 |
| gLeak | increased by 100% | 0.0 | 0.0 | 0.0 | 0.0 | 0.0 | 0.0 | 0.0 | 0.0 | 0.0 | 0.0 | 0.0 | 0.0 | 2.0 | 2.0 | 3.0 | 2.3 |
| gNaP | increased by 150% | −2.2 | −2.5 | −1.9 | −2.2 | 7.7 | 8.9 | 8.4 | 8.3 | 4.1 | 3.2 | 2.3 | 3.2 | −1.0 | −1.0 | −1.0 | −1.0 |
| shift m by −5 mV | −2.2 | −2.4 | −1.7 | −2.1 | 5.7 | 7.5 | 5.9 | 6.4 | 3.6* | 1.4 | 0.4 | 1.8 | −1.0 | −1.0 | 0.0 | −0.7 | |
| Combination of initial segment and soma | |||||||||||||||||
| gNa | shift m by-3 & h mV | −4.8 | −5.3 | −4.8 | −5.0 | 0.0 | 0.7 | 0.0 | 0.2 | 1.1 | 0.8 | 0.4 | 0.8 | −2.0 | −5.0 | −4.0 | −3.7 |
| shift m & h by −2 mV | −4.8 | −5.3 | −4.4 | −4.8 | 2.5 | 7.4 | 5.5 | 5.1 | 1.2 | 1.0 | 0.4 | 0.9 | −1.0 | −3.0 | −4.0 | −2.7 | |
| increased by 50% | −5.4 | −5.7 | −5.1 | −5.4 | 15.6 | 19.4 | 17.0 | 17.3 | 1.4 | 1.3 | 0.5 | 1.1 | −1.0 | −3.0 | −4.0 | −2.7 | |
| gK(DR) | shift n by 5 mV | −3.5 | −4.0 | −3.0 | −3.5 | 4.3 | 8.0 | 5.6 | 6.0 | 2.0 | 1.5 | 0.0 | 1.2 | −1.0 | −3.0 | −3.0 | −2.3 |
| reduced by 50% | −2.5 | −3.1 | −2.2 | −2.6 | 3.0 | 7.0 | 4.6 | 4.9 | 3.0* | 1.9 | 0.3 | 1.7 | −1.0 | −2.0 | −2.0 | −1.7 | |
| gNaP | increased by 150% | −3.2 | −3.1 | −3.1 | −3.1 | 10.1 | 11.5 | 10.1 | 10.6 | 5.0* | 3.9* | 1.7 | 3.5 | −1.0 | −1.0 | −1.0 | −1.0 |
| shift m by −5 mV | −3.2 | −3.4 | −3.0 | −3.2 | 7.8 | 9.0 | 7.2 | 8.0 | 3.7* | 1.7 | 0.5 | 1.9 | −2.0 | −2.0 | −1.0 | −1.7 | |
| gNa | increased by 30 % and | ||||||||||||||||
| gK(DR) | reduced by 30% | −4.5 | −5.2 | −4.3 | −4.7 | 12.0 | 16.0 | 13.0 | 13.7 | 3.2* | 1.8 | 0.4 | 1.8 | −1.0 | −3.0 | −3.0 | −2.3 |
| gNa | shift m & h by-2 mV and | ||||||||||||||||
| gK(DR) | shift n by 2 mV | −6.2 | −5.6 | −4.3 | −5.4 | 6.4 | 7.4 | 3.3 | 5.7 | 3.2* | 3.0* | 0.6 | 2.3 | −4.0 | −5.0 | −5.0 | −4.7 |
Changes less than 1 mV in membrane potential or 0.3 ms in AP width or 1 nA in rheobase with respect to control were assigned to 0.gmax: the maximum conductance. m and h: state variables of sodium conductance; n: state variable of potassium conductance (delayed rectifier). The persistent sodium conductance (gNaP) was added to the models to test its effect on Vth. The simulation results for other conductances were collected in the models without including gNaP. All values in the above table represent changes from the control condition where the gNaP was absent. Symbol Δ: changes in Vth, AP height (H), AP width (W) or rheobase (Ir).
AP width is measured from across a double spike as shown in Fig. 4C.
Experimental data
Motoneurones receive excitatory and inhibitory synaptic inputs from locomotor networks during fictive locomotion. These alternating synaptic inputs result in membrane potential oscillations, termed locomotor drive potentials (LDPs). In order to test if the Vth hyperpolarization might be induced directly by excitatory synaptic inputs, we previously measured the Vth in both excitatory (depolarizing) and inhibitory (hyperpolarizing) phases of the LDPs of motoneurones (Krawitz et al. 2001). Here we analysed an additional eight cells to more rigorously examine this issue. The Vth during the excitatory component of the LDP was measured from the spike train induced by MLR stimulation, and the Vth during the inhibitory component of the LDP was measured from the spike train elicited by a single pulse with the minimum amount of current (5-25 nA, 0.2 s) required for repetitive firing. The details of the surgical procedures and data collection methods were described in Krawitz et al. (2001).
RESULTS
Effect of synaptic inputs on Vth
Experimental results from eight cat lumbar motoneurones showed that all motoneurones displayed hyperpolarization of Vth in both the excitatory phase and the inhibitory phase of the LDPs compared to the Vth measured at rest (Fig. 2E). Three of the eight motoneurones exhibited a more hyperpolarized Vth in the inhibitory phase than that in the excitatory phase (cells 1-3 in Fig. 2E), while four of them displayed a more hyperpolarized Vth in the excitatory phase than that in the inhibitory phase (cells 5-8 in Fig. 2E). One motoneurone showed no apparent difference in Vth between the two phases (cell 4 in Fig. 2E). See Fig. 4 in Krawitz et al. ( 2001) for reference.
These experimental results show that the hyperpolarization of Vth induced by fictive locomotion is not simply a result of periodic membrane depolarization during the fictive step cycle. If the Vth change were dependent on the postsynaptic depolarizations, the Vth measured in the inhibitory phase of the LDP would have been always more depolarized than that measured in the excitatory phase. Instead, further analysis of the experimental data reveals a modulation of Vth in both phases of the fictive locomotion that supports our previous conclusion that the Vth hyperpolarization was locomotor-state not membrane potential dependent (Krawitz et al. 2001).
Electrophysiological basis for the simulations
Figure 2 illustrates experimental data forming the framework of the simulations in this study. During the non-locomotion (control) condition repetitive firing of the motoneurone was evoked by a triangular shaped current injection (Fig. 2A). As measured at the point where the change in membrane potential was 10 mV ms−1 (see Methods), the Vth for the first spike was −27.4 mV. During fictive locomotion, the Vth was hyperpolarized for all spikes, with the Vth of the first spike being −34.6 mV (Fig. 2B). Averaged action potentials occurring in the two conditions are overlaid in Fig. 2C. Note the small increase in spike height (3.7 mV) and width (0.3 ms) as the Vth hyperpolarized by 7.2 mV during locomotion (continuous trace). The example in Fig. 2 is representative of the experimental finding that while there is a significant hyperpolarization of Vth, the size and shape of the action potential are little changed. The distribution of Vth hyperpolarization from 38 motoneurones (Krawitz et al. 2001) is shown in Fig. 2D.
A series of computer simulations were done with the objective of identifying ionic currents likely to be responsible for mediating the hyperpolarization of Vth that occurs during fictive locomotion. The protocol for these simulations was to inject a triangular-shaped current ramp into the model motoneurones similar to that used to evoke firing in vivo (e.g. Fig. 2). Typically the current ramps during simulation started from a value of −2 nA and rose to a peak amplitude of 15-30 nA with a total duration of 5 s. Responses in the ‘control’ condition were then recorded using model neurones with the conductances outlined in Table 2 and parameters as described in Methods. Responses during ‘locomotion’ were those in which a conductance was altered as described in the left column of Table 4. The resulting effects on Vth, AP shape and rheobase current were measured. The results are shown in Table 4. For simplicity, all illustrations in this paper were taken from the S-type model motoneurone.
Influence of somatic currents on Vth
Reducing AHP current
Previous experimental results have shown that the amplitude of the post-spike afterhyperpolarization (AHP) in spinal motoneurones is decreased during locomotion by 18-59 % (Brownstone et al. 1992). The current underlying the AHP is mediated by an apamin-sensitive, Ca2+-activated K+ channel (Viana et al. 1993b) and is sensitive to modulation by various neurotransmitters (Sah, 1996). We used the motoneurone models to test whether a reduction in the conductance of the IK(AHP) could account for both the reduced AHP and the hyperpolarization of Vth observed in the locomotor state (Fig. 3).
Figure 3. Reducing IK(AHP) does not affect Vth.
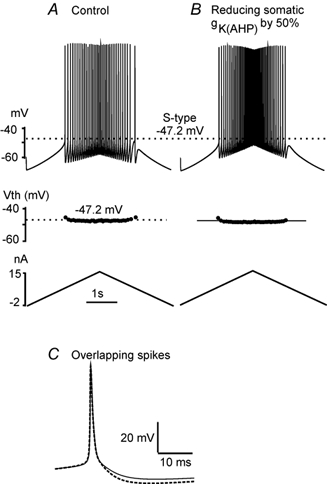
Triangular currents (15 nA, 5 s, starting from −2 nA; shown at the bottom in A and B) were injected into the soma compartment of the S-type model cell to make the cell fire in two conditions (A and B). Each dot in the middle panels of A and B is the Vth for the corresponding spike in the top panels. A, in control, the mean Vth was −47.2 ± 0.3 mV (dotted lines in top and middle panels in A and B). B, a decrease in the maximum conductance of the IK(AHP) by 50 % resulted in a reduction in the amplitude of the AHP by ≈25 % (reducing ≈1.0 mV) with little hyperpolarization (< 0.3 mV) of Vth (dark line in the middle panel of B) and no changes in spike height or width. C, the first four spikes from A and B were averaged and then overlapped. The dotted line is for the averaged control spike, and the dark line for the averaged spike where gK(AHP) was reduced by 50 %.
A triangular ramp of current (bottom panels in Fig. 3A and B) was injected into the soma compartment of the S-type model cell to induce repetitive firing under two conditions: control (Fig. 3A) and 50 % reduction of gK(AHP) (Fig. 3B). Vth for each spike is plotted as a dot in the middle panels in Fig. 3A and B, and the averaged spikes taken from Fig. 3A and B are overlapped in Fig. 3C. The mean value of Vth was −47.2 ± 0.3 mV in control (dotted line in the middle panel of Fig. 3A), and this changed by less than 0.3 mV in the test condition. The simulation results illustrate that a 25 % reduction in the amplitude of the AHP produced by decreasing IK(AHP) is unlikely to be the mechanism responsible for hyperpolarizing Vth during fictive locomotion.
Increasing sodium current
Changes in somatic sodium conductance hyperpolarized Vth to some extent. Equal shifts of the activation and inactivation curves of somatic sodium conductance resulted in large increases in the height of the action potential (not shown). In order to maintain the size and shape of the action potential within reasonable limits (see Methods), an unequal shift of the activation and inactivation curves was required. Figure 4A (left panel) illustrates the effect of shifting the activation curve (m) by 4 mV and the inactivation curve (h) by 6 mV in the hyperpolarizing direction. This shift produced a smaller product of hm3 with peak activation occurring about 5 mV more hyperpolarized than control (right panel, Fig. 4A). Shifting the voltage dependence of the somatic sodium conductance to the left reduced the Vth to −50.3 mV, a 3.1 mV hyperpolarization with respect to control Vth (Fig. 4Bb) and produced an action potential that was 1 mV smaller and 0.7 ms wider. The inset shows the averaged spikes from the control (dotted line) and test condition (continuous line) superimposed.
Figure 4. Altering somatic INa alters Vth.
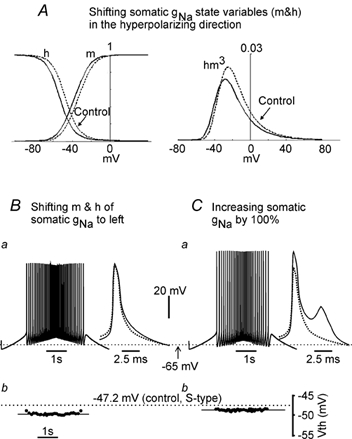
The S-type model cell was made to fire under two conditions (B and C) by injecting triangular current (the same as that used in Fig. 3) into the soma compartment. Vth for each spike shown in panels Ba and Ca was plotted as a dot in Bb and Cb, respectively. The first four spikes in each condition were averaged and then overlapped on the averaged spike of control taken from Fig. 3C (insets in Ba and Ca, dotted-line spike for control). The dotted line crossing panels Ba and Ca represents the resting membrane potential of −65 mV, and the dotted line crossing panels Bb and Cb represents the mean value of the Vth of −47.2 mV for the S-type model cell in the control condition. A, curves of the state variable m and h were shifted to the hyperpolarizing direction by 4 and 6 mV, respectively (left panel). This resulted in a left-ward shift of product of hm3 (right panel). Dotted lines stand for control and dark lines for shifted curves. B, Vth could be hyperpolarized by unevenly shifting the state variables of gNa (shown in A) with small changes in spike height and width. C, increasing the somatic max gNa resulted in a large increase in spike height and width.
In the second test condition (Fig. 4C) the maximum somatic sodium conductance (gNa) was increased by 100 %. This produced a relatively small hyperpolarization of the Vth, with changes in height and width that were outside the simulation boundaries. Increasing gNa resulted in a mean Vth of −49.3 mV, i.e. a 2.1 mV hyperpolarization with respect to control but also a 13 mV increase in action potential amplitude, a 2.3 ms increase in width and the generation of a double spike (inset in Fig. 4Ca).
Altering other currents
The effects of modulation of other somatic currents and the associated effects on Vth are summarized in Table 4. Aside from changes in sodium (gNa) or delayed rectifier (gK(DR)) conductances, changes in other somatic currents had limited effects on the Vth, although in many cases the current threshold of the models was altered (see right column of Table 4).
Influence of initial segment currents on Vth
The effects of changing the INa and IK(DR) currents in the initial segment are shown in Fig. 5. Responses to the same triangular current injection used in Fig. 3 and Fig. 4 are shown in the top panels, and the corresponding Vth for each spike is shown as a dot in the middle panels. The averaged spikes from each condition (dark lines) are overlapped on the averaged spike of control (dotted line spikes) and shown in the bottom panels. Figure 5A shows that a 50 % increase in maximal conductance of initial segmental INa produced a 5.5 mV hyperpolarization of Vth, with an 8 mV increase in amplitude and little increase (0.7 ms) in width of the action potential. Shifting the state variables of the initial segment gNa in the hyperpolarizing direction also resulted in a hyperpolarization of Vth. Figure 5B shows an equal shift in the activation and inactivation voltages of the initial segment gNa to the left by 3 mV produced a 5.6 mV hyperpolarization of Vth with a 7 mV increase in the AP height and a 1.2 ms increase in the AP width. These changes were similar to those produced by shifting state variables for the somatic gNa.
Figure 5. Hyperpolarization of Vth could be produced by increasing the initial segment INa or decreasing the initial segment IK(DR).
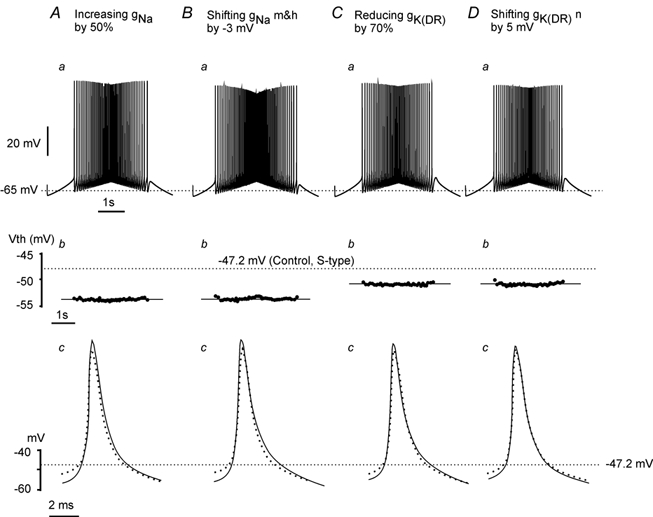
Triangular currents (as used in Fig. 3) were injected into the soma compartment of the S-type model cell to make the cell repetitively fire in four conditions (A, B, C and D). Vth for each spike shown in Aa, Ba, Ca and Da are plotted in Ab, Bb, Cb and Db, and the average of the first four spikes in each condition is superimposed on the control spike (dotted line) in Ac, Bc, Cc and Dc. The dotted line crossing the top panels represents the resting membrane potential of −65 mV, and the dotted lines crossing the middle and bottom panels represent the mean value of the Vth of −47.2 mV for the S-type model cell measured in control. A, increasing the maximum initial segment gNa hyperpolarized the Vth by 5.5 mV with moderate increases in AP height (8.0 mV) and width (0.7 ms). B, shifting the initial segment gNa state variables m and h to the hyperpolarizing direction lowered the Vth by 5.6 mV and resulted in a 7.0 mV increase in AP height and 1.2 ms increase in AP width. C, reducing the max initial segment gK(DR) produced a hyperpolarization of the Vth by 3.1 mV and caused a small increase in AP height (5.3 mV) and width (0.5 ms). D, shifting the state variable of initial segment gK(DR) in the depolarizing direction hyperpolarized the Vth by 3.0 mV with little increase in AP height (4.2 mV) and width (0.3 ms).
Unlike the change in somatic gK(DR), a 70 % decrease in the maximum conductance of gK(DR) in the initial segment produced a 3.1 mV hyperpolarization of Vth with a 5.3 mV increase in amplitude of the action potential and little increase (0.5 ms) in the AP width (Fig. 5C). A similar result could be also produced by positively shifting the state variable n of the initial segment gK(DR) by 5 mV (Fig. 5D).
Combining changes in initial segment and somatic currents
The effects of altering both initial segment and somatic INa and IK(DR) on Vth are summarized in Table 4. In general, a combined modulation of both initial segment and somatic gNa or gK(DR) does not lower Vth much more than modulating the initial segment gNa or gK(DR) alone. These results suggest a dominant role of initial segment conductances, the sodium conductance in particular, in modulating the Vth.
The results of a combined modulation of gNa and gK(DR) in both the initial segment and soma are shown in the bottom two rows in Table 4. The Vth was hyperpolarized by 4.5 mV when initial segment-somatic gNa was increased by 30 % and the initial segment-somatic gK(DR) was reduced by 30 %. This resulted in a 12.0 mV increase in AP height and a 3.2 ms increase in AP width (double spike). With a relatively small increase in AP height (6.4 mV) and width (3.2 ms, double spike), a 6.2 mV Vth hyperpolarization could also be produced by a 2 mV shift of the initial segment-somatic gNa state variables (m and h) to the left and a 2 mV shift of the initial segment-somatic gk(DR) state variable (n) to the right.
Effect of persistent sodium current on Vth
In addition to examining the effect of the rapidly inactivating, low-voltage-activated sodium current (INa), a persistent sodium current (INaP) was incorporated into the model. Unlike the other simulations, INaP was set to zero in control conditions and increased during the simulated locomotor state. Compared to the fast INa, the INaP had a smaller effect on Vth for the same amount of conductance modulation (either enhancing the maximum conductance or shifting the voltage dependency to the left). Addition of the gNaP to both the initial segment and soma compartments hyperpolarized the Vth by 1.7 mV with small changes in AP height (4.1 mV) and width (1.0 ms) (Fig. 6A, middle trace). Increasing the initial segment gNaP by 150 %, in an attempt to lower the Vth further, resulted in a 2.9 mV hyperpolarization of Vth, a 6.9 mV increase in AP height and a 1.3 ms increase in AP width. A 3.2 mV Vth hyperpolarization could be produced by negatively shifting the voltage activation of the initial segment gNaP by 5 mV, but this also caused a 6.6 mV increase in AP height and a 1.6 ms increase in AP width (Fig. 6B).
Figure 6. Altering gNaP affects Vth and spike shape.
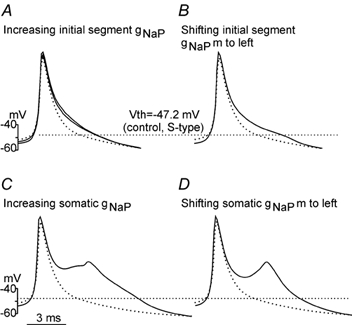
Repetitive firing of the S-type model cell was evoked by a triangular current injection as shown in Fig. 3. Averaged spikes (dark line) from each condition (A-D) are superimposed on the control spike (dotted line). The straight dotted line crossing panels A-D represents the mean value of Vth (−47.2 mV) measured in control. A, addition of gNaP to both the initial segment compartment with gNaP= 12 mS cm−2 (≈5 % of initial segment gNa) and soma compartment with gNaP= 6 mS cm−2 (≈1.5 % of somatic gNa) hyperpolarized the Vth by 1.7 mV and resulted in a 4.1 mV increase in AP height and 1.0 ms increase in width (middle trace). Increasing the initial segment gNaP by 150 % lowered the Vth by 2.9 mV with a 6.9 mV increase in AP height and a 1.3 ms increase in width. B, negatively shifting the activation curve of the initial segment gNaP by 5 mV hyperpolarized Vth by 3.2 mV and increased the spike height (6.6 mV) and width (1.6 ms). C, increasing the somatic gNaP by 150 % hyperpolarized the Vth by 2.2 mV with a 7.7 mV increase in AP height and 4.1 ms increase in AP width. D, shifting the activation voltage of somatic gNaP to the left by 5 mV hyperpolarized the Vth by 2.2 mV and resulted in a double spike with a 5.7 mV increase in the AP height and a 3.6 ms increase in AP width.
Compared to the initial segment gNaP, modulation of somatic gNaP had a smaller effect on Vth but a larger effect on AP size and shape. A 150 % increase in the somatic gNaP resulted in a 2.2 mV hyperpolarization of Vth and a significant distortion of the shape of the action potential and (Fig. 6C). The Vth could be hyperpolarized to the same amount by a 5 mV left-shift of the activation voltage of the somatic gNaP causing a large change (double spike) in shape of the spike (Fig. 6D).
Enhancing both the initial segment and somatic gNaP did not lower Vth significantly more than modulating the initial segment gNaP alone but resulted in a relatively larger increase in spike size and width. The Vth could be hyperpolarized by 3.2 mV by either increasing the initial segment and somatic gNaP by 150 % or negatively shifting the activation voltage of the initial segment-somatic gNaP by 5 mV (not illustrated, see results in Table 4). Both modulations caused a large increase in spike width and more than a 7 mV increase in spike height.
DISCUSSION
Three types of cat lumbar motoneurone models (S-, FR- and FF-type) were built using passive and active properties based on experimental data. The input resistance, rheobase, membrane time constant and Vth of the model motoneurones were similar to those observed in cat lumbar motoneurones (Hochman & McCrea 1994b,c). Experimental results used for setting values of desirable changes for computer simulations included a mean Vth hyperpolarization of 6.2 mV with a favoured increase in action potential height of less than 3 mV and a favoured increase in action potential width of less than 0.5 ms. Simulation results do not show qualitative differences in the mechanisms for altering the Vth in the three different biophysical types of model motoneurones. Simulation results suggest that the selective modulation of sodium and/or delayed-rectifier channels in the initial segment are candidate ionic mechanisms for the hyperpolarization of Vth that occurs in adult cat spinal motoneurones during fictive locomotion.
Mechanisms unlikely to contribute to Vth hyperpolarization during locomotion
Excluded ionic mechanisms
Seven of the ionic conductances (gK(AHP), gK(A), gh, gCa,T, gCa,L, gCa,N and gleak) included in the models had no effect on the Vth when the maximum conductance through these channels was changed (Table 4). Initially we anticipated that currents such as gK(A), gh and gCa,T, which are active at subthreshold membrane potentials, would have an important role in determining Vth. However simulations show that compared to the fast sodium current these conductances have little effect on Vth either because their activation time constants are relatively long or because the induced currents are relatively small. In general increasing these conductances had little or no effect on current threshold (right column, Table 4). Other mechanisms excluded because of their small effect on Vth (< 3.0 mV) or large effect on the action potential amplitude or width were: (1) increasing the maximum conductance of somatic gNa; (2) decreasing the maximum conductance of the somatic gK(DR); (3) shifting the voltage dependency of the somatic gK(DR) to the right; and (4) increasing the somatic gNaP.
Effect of rate of change of membrane potential on Vth
Spike threshold in cat spinal motoneurones can be hyperpolarized by a rapid membrane depolarization produced by a current pulse in both anaesthetized (Powers & Binder 1996) and decerebrate cats (data from Krawitz et al. 2001). The mechanism underlying this type of Vth hyperpolarization was recently investigated using a single cell model (Dai et al. 2000). The simulation results suggested that Vth hyperpolarization produced by rapid membrane potential changes could be due to a more rapid activation of the fast sodium conductance, which induces a relatively large amount of INa in the subthreshold range of the membrane potential and thus results in a lowering of the Vth. It is important to note that only the first spike in a train shows a reduced Vth due to these rapid depolarizations (Dai et al. 2000). In contrast, in both the present simulations (Fig. 5) and during fictive locomotion (Krawitz et al. 2001) Vth was lowered for all spikes. Furthermore, the extent of Vth hyperpolarization induced by a rapid depolarization is smaller (mean 3.8 mV; Powers & Binder, 1996; 2.5 in data from Krawitz et al. 2001) than that observed during fictive locomotion (mean 8.0 mV, Krawitz et al. 2001). Finally, the membrane potential oscillations occurring during fictive locomotion are considerably slower than those produced by square current pulses. These observations argue against the rhythmic changes in motoneurone membrane potential per se being primarily responsible for threshold lowering during locomotion. Instead it is more likely that Vth lowering during locomotion results from the actions of as yet unknown neuromodulatory mechanisms acting on motoneurone membrane currents.
Possible mechanisms for mediating Vth hyperpolarization
Simulations show that Vth can be hyperpolarized by modulations of gNa or gK(DR) that either change maximum channel conductance or shift the voltage dependency of channel opening and closing (i.e. alter the state variables). Of these putative mechanisms, enhancing initial segment gNa plays a dominant role in hyperpolarizing the Vth (≈6 mV) while at the same time producing only small increases in spike height (< 8 mV) and width (< 1 ms). In contrast increasing somatic gNa by shifting the voltage dependency (i.e. more channels open at a hyperpolarized membrane potential) produces only a relatively small amount of Vth hyperpolarization (< 3.5 mV) while increasing somatic gNa increases action potential height more than 15 mV. The four conductance changes found to hyperpolarize the Vth to an extent approaching that occurring during locomotion while maintaining the action potential within acceptable limits were: (1) increasing the initial segment maximum conductance of gNa by 50 %; (2) shifting the initial segmental gNa voltage dependency in the hyperpolarizing direction by 3 mV; (3) reducing the maximum conductance of initial segment gK(DR) by 70 %; and (4) shifting the initial segment gK(DR) voltage dependency in the depolarizing direction by 5 mV (Table 4). The first two increase the absolute amount of sodium current in the subthreshold range while the other two produce a relative increase in the inward current by reducing the outward IK(DR). All four changes increase the net inward current at subthreshold membrane potentials and thus hyperpolarize Vth. Previous studies on the fast potassium conductance (delayed rectifier) showed that its activation in cat spinal motoneurones could induce a large (≈30 nA) outward current when the membrane potential was brought 20 mV positive to the resting potential (Barrett et al. 1980). Thus a reduction of this current during locomotion could result in an increase in the relative amount of inward current and hence reduce Vth.
Neuromodulators acting on Na+ or K+ channels located in the initial segment would seem to be the most effective for threshold reduction. However, the present study does not exclude the possibility that modulation of multiple channel types simultaneously could produce changes in Vth, AP height and width during fictive locomotion. The potential for this interaction was only superficially explored in the present study by combining modulation of gNa and gK(DR) in both the initial segment and soma (see bottom two rows in Table 4)
The INaP in cat motoneurones activates quickly and at more hyperpolarized membrane potentials than the fast sodium current. Thus it could potentially contribute to subthreshold inward currents even though it is estimated to make up only 1 % of the fast sodium current (Crill, 1996). Our simulations suggest, however, that increasing INaP alone is unlikely to be responsible for Vth lowering during fictive locomotion since it greatly affects action potential shape with only modest reductions in Vth. The present simulations did not explore the possibility that changes in this conductance during locomotion might affect other aspects of motoneurone behaviour such as the f-I gain during rhythmic firing (Lee & Heckman 2001). In guinea-pig brainstem motoneurones INaP appears important in mediating bistable membrane behaviours and evoking plateau potentials in trigeminal motoneurones (Hsiao et al. 1998), and regulating firing rate in facial motoneurones (Nishimura et al. 1989). Also relevant in this regard is the report that the activation of INaP can be shifted in the hyperpolarizing direction by activation of protein kinase C in mouse neocortical neurones (Astman et al. 1998).
Modulation of sodium channels
The earliest intracellular studies suggested that the initial segment was the site of action potential initiation in cat motoneurones (Brock et al. 1953). Simulations summarized in Table 4 suggest that modulation of initial segment sodium currents may play an important role in lowering Vth during locomotion. The possible contribution of changes in somatic gNa to decreasing Vth (Table 4) may be an overestimation since the simulations assumed a similar density of Na+ channels in the soma and initial segment. In cultured spinal neurones and retinal ganglion cells the density of Na+ channels in the soma is much lower than in the initial segment (Catterall, 1981; Wollner & Catterall, 1986). This results in about 80 % of the inactivating Na+ current in dorsal horn neurones coming from the initial segment/axon (see Safronov, 1999).
There is mounting evidence that the sodium current is a target for modulation by neurotransmitters. Modulation of sodium channels has been shown to control the input-output relations in neostriatal cells and to regulate firing patterns of pyramidal neurones (see Cantrell & Catterall, 2001). Voltage-dependent activation and inactivation of sodium channels can be modified by extracellular toxin binding (Cestèle et al. 1998; Catterall, 1992), raising the possibility that voltage dependency may be amenable to physiological modulation. Azouz & Gray (2000) suggest that in cat visual cortical neurones an increased availability of sodium channels would be responsible for a lowering of voltage threshold which enhances the sensitivity of cortical neurones to synchronous synaptic inputs. These studies raise the possibility that the Na+ channel is a potential target for modulation during activity in several places in the nervous system (also see Cantrell & Catterall 2001).
In both the present simulations and experimental results (Krawitz et al. 2001) the hyperpolarization of Vth reduces both the current and the amount of membrane potential depolarization required to reach threshold. Such locomotor-state-dependent changes could substantially facilitate motoneurone recruitment during locomotion (Dai et al. 1999; Krawitz et al. 2001). The challenge is to find potential neuromodulatory substances that may be released with the onset of locomotion and mediate this alteration of motoneurone excitability.
Conclusions
The state-dependent hyperpolarization of Vth during fictive locomotion will increase motoneurone excitability and is suspected to play an important role in motoneurone recruitment during locomotion (Dai et al. 1999; Krawitz et al. 2001). Our simulation results suggest that the mechanisms producing this dynamic change in the biophysical properties of spinal motoneurones may be a receptor-activated modulation of the Na+ and/or delayed rectifier K+ channels. Furthermore, the simulations suggest that the most effective modulation of Vth will occur if the receptor-activated modulation is targeted on the initial segment. These predictions are amenable to testing in future experiments.
Acknowledgments
The authors gratefully acknowledge the excellent technical assistance provided by Kim Madec, Maria Setterbom, Gilles Detillieux and Matt Ellis, and gratefully thank Dr D. P. Bashor for suggestions on an earlier version of this paper. Y.D. thanks the Manitoba Neurotrauma Program for studentship support; K.E.J. acknowledges the fellowship support of the Manitoba Neurotrauma Program; B.F. thanks the Manitoba Division of the Canadian Paraplegic Association for salary support. This work was funded by a MRC of Canada grant to L.M.J.
REFERENCES
- Araki T, Terzuolo CA. Membrane currents in spinal motoneurones associated with the action potential and synaptic activity. Journal of Neurophysiology. 1962;25:772–789. doi: 10.1152/jn.1962.25.6.772. [DOI] [PubMed] [Google Scholar]
- Astman N, Gutnick MJ, Fleidervish IA. Activation of protein kinase C increases neuronal excitability by regulating persistent Na+ current in mouse neocortical slices. Journal of Neurophysiology. 1998;80:1547–1551. doi: 10.1152/jn.1998.80.3.1547. [DOI] [PubMed] [Google Scholar]
- Avery RB, Johnston D. Multiple channel types contribute to the low voltage-activated calcium current in hippocampal CA3 pyramidal neurons. Journal of Neuroscience. 1996;16:5567–5582. doi: 10.1523/JNEUROSCI.16-18-05567.1996. [DOI] [PMC free article] [PubMed] [Google Scholar]
- Azouz R, Gray CM. Dynamic spike threshold reveals a mechanism for synaptic coincidence detection in cortical neurones in vivo. Proceedings of the National Academy of Sciences of the USA. 2000;97:8110–8115. doi: 10.1073/pnas.130200797. [DOI] [PMC free article] [PubMed] [Google Scholar]
- Barrett EF, Barrett JN, Crill WE. Voltage-sensitive outward currents in cat motoneurones. Journal of Physiology. 1980;304:251–276. doi: 10.1113/jphysiol.1980.sp013323. [DOI] [PMC free article] [PubMed] [Google Scholar]
- Binder M, Heckman CJ, Powers R. The physiological control of motoneurone activity. In: Rowell LB, Shepherd JT, editors. Handbook of Physiology, section 12, Regulation and Integration of Multiple System. New York: Oxford Univrsity Press; 1996. pp. 3–53. [Google Scholar]
- Booth V, Rinzel J, Keihn O. Compartmental Model of vertebrate motoneurones for Ca2+-dependent spiking and plateau potentials under pharmacological treatment. Journal of Neurophysiology. 1997;78:3371–3385. doi: 10.1152/jn.1997.78.6.3371. [DOI] [PubMed] [Google Scholar]
- Bower JM, Beeman D. The Book of GENESIS. 2. New York: Springer-Verlag; 1998. [Google Scholar]
- Brock LG, Coombs JS, Eccles JC. Intracellular recording from antidromically activated motoneurones. Journal of Physiology. 1953;122:429–461. doi: 10.1113/jphysiol.1953.sp005013. [DOI] [PMC free article] [PubMed] [Google Scholar]
- Brownstone RM, Jordan LM, Kriellaars DJ, Noga BR, Shefchyk SJ. On the regulation of repetitive firing in lumbar motoneurones during fictive locomotion in the cat. Experimental Brain Research. 1992;90:441–455. doi: 10.1007/BF00230927. [DOI] [PubMed] [Google Scholar]
- Cantrell AR, Catterall WA. Neuromodulation of Na+ channels: An unexpected form of cellular plasticity. Nature Reviews Neuroscience. 2001;2:397–406. doi: 10.1038/35077553. [DOI] [PubMed] [Google Scholar]
- Catterall WA. Localization of sodium channels in cultured neural cells. Journal of Neuroscience. 1981;1:777–783. doi: 10.1523/JNEUROSCI.01-07-00777.1981. [DOI] [PMC free article] [PubMed] [Google Scholar]
- Catterall WA. Cellular and molecular biology of voltage-gated sodium channels. Physiological Reviews. 1992;72:S15–S48. doi: 10.1152/physrev.1992.72.suppl_4.S15. [DOI] [PubMed] [Google Scholar]
- Cestèle S, Qu Y, Rogers JC, Rochat H, Scheuer T, Catterall WA. Voltage sensor-trapping: enhanced activation of sodium channels by b-scorpion toxin bound to the S3-S4 loop in domain II. Neuron. 1998;21:919–931. doi: 10.1016/s0896-6273(00)80606-6. [DOI] [PubMed] [Google Scholar]
- Chandler SH, Hsaio C, Inoue T, Goldberg LJ. Electrophysiological properties of guinea pig trigeminal motoneurones recorded in vitro. Journal of Neurophysiology. 1994;71:129–145. doi: 10.1152/jn.1994.71.1.129. [DOI] [PubMed] [Google Scholar]
- Conradi S. Observations on the ultrastructure of the axon hillock and initial axon segment of lumbosacral motoneurones in the cat. Acta Physiologica Scandinavica. 1969;(suppl. 332):65–84. [PubMed] [Google Scholar]
- Coombs JS, Curtis DR, Eccles JC. The interpretation of spike potentials of motoneurones. Journal of Physiology. 1957;139:198–231. doi: 10.1113/jphysiol.1957.sp005887. [DOI] [PMC free article] [PubMed] [Google Scholar]
- Crill WE. Persistent sodium current in mammalian central neurons. Annual Review of Physiology. 1996;58:349–362. doi: 10.1146/annurev.ph.58.030196.002025. [DOI] [PubMed] [Google Scholar]
- Cullheim S, Fleshman JW, Glenn LL, Burke RE. Membrane area and dendritic structure in type-identified triceps surae alpha-motoneurones. Journal of Comparative Neurology. 1987;255:68–81. doi: 10.1002/cne.902550106. [DOI] [PubMed] [Google Scholar]
- Dai Y, Bashor DP, Fedirchuk B, Jordan LM. Motoneuron threshold hyperpolarization: alteration of population output predicted by a large scale simulation. Society for Neuroscience Abstracts. 1999;25:664. [Google Scholar]
- Dai Y, Jones KE, Fedirchuk B, Jordan LM. Computer simulation: A study of excitability of the cat lumbar motoneurones during fictive locomotion. Society for Neuroscience. 1998b Abstracts 24, 427.11. [Google Scholar]
- Dai Y, Jones KE, Fedirchuk B, Jordan LM. Effects of voltage trajectory on action potential voltage threshold in simulations of cat spinal motoneurones. Neurocomputing. 2000:23–33. 105–111. [Google Scholar]
- Dai Y, Jones KE, Fedirchuk B, Krawitz S, Jordan LM. Modeling the lowering of motoneurone Voltage threshold during fictive locomotion. Annals of the New York Academy of Sciences. 1998a:492–495. doi: 10.1111/j.1749-6632.1998.tb09085.x. [DOI] [PubMed] [Google Scholar]
- Fedirchuk B, McCrea DA, Dai Y, Jones KE, Jordan LM. Motoneurone frequency/current relationships during fictive locomotion in the cat. Society for Neuroscience Abstracts. 1998;24:652. [Google Scholar]
- Gustafsson B, Pinter MJ. An investigation of threhsold properties among cat spinal alpha-motoneurones. Journal of Physiology. 1984;357:453–483. doi: 10.1113/jphysiol.1984.sp015511. [DOI] [PMC free article] [PubMed] [Google Scholar]
- Hochman S, McCrea DA. Effects of chronic spinalization on ankle extensor motoneurones. I. Composite monosynaptic Ia EPSPs in four motoneuron pools. Journal of Neurophysiology. 1994a;71:1452–1466. doi: 10.1152/jn.1994.71.4.1452. [DOI] [PubMed] [Google Scholar]
- Hochman S, McCrea DA. Effects of chronic spinalization on ankle extensor motoneurones. II. Motoneurone electrical properties. Journal of Neurophysiology. 1994b;71:1468–1479. doi: 10.1152/jn.1994.71.4.1468. [DOI] [PubMed] [Google Scholar]
- Hochman S, McCrea DA. Effects of chronic spinalization on ankle extensor motoneurones. III. Composite Ia EPSPs in Motoneurones separated into motor unit types. Journal of Neurophysiology. 1994c;71:1480–1490. doi: 10.1152/jn.1994.71.4.1480. [DOI] [PubMed] [Google Scholar]
- Hsiao C, Negro CAD, Trueblood PR, Chandler SH. Ionic basis for serotonin-induced bistable membrane properties in guinea pig trigeminal motoneurones. Journal of Neurophysiology. 1998;79:2847–2856. doi: 10.1152/jn.1998.79.6.2847. [DOI] [PubMed] [Google Scholar]
- Kernell D. High-frequency repetitive firing of at lumbosacral motoneurones stimulated by long-lasting injected currents. Acta Physiologica Scandinavica. 1965;65:74–86. doi: 10.1111/j.1748-1716.1965.tb04081.x. [DOI] [PubMed] [Google Scholar]
- Krawitz S, Fedirchuk B, Dai Y, Jordan LM, McCrea DA. State-dependent hyperpolarization of voltage threshold enhances motoneurone excitability during fictive locomotion in the cat. Journal of Physiology. 2001;532:271–281. doi: 10.1111/j.1469-7793.2001.0271g.x. [DOI] [PMC free article] [PubMed] [Google Scholar]
- Lee RH, Heckman CJ. Essential role of a fast persistent inward current in action potential initiation and control of rhythmic firing. Journal of Neurophysiology. 2001;85:472–475. doi: 10.1152/jn.2001.85.1.472. [DOI] [PubMed] [Google Scholar]
- Mynlieff M, Beam KG. Characterization of voltage-dependent calcium currents in mouse motoneurons. Journal of Neurophysiology. 1992;68:85–92. doi: 10.1152/jn.1992.68.1.85. [DOI] [PubMed] [Google Scholar]
- Nishimura Y, Schwindt PC, Crill WE. Electrical properties of facial motoneurones in brainstem slices from guinea pig. Brain Research. 1989;502:127–142. doi: 10.1016/0006-8993(89)90468-x. [DOI] [PubMed] [Google Scholar]
- Pinter MJ, Curtis RL, Hosko MJ. Voltage threshold and excitability among variously sized cat hindlimb motoneurones. Journal of Neurophysiology. 1983;50:644–657. doi: 10.1152/jn.1983.50.3.644. [DOI] [PubMed] [Google Scholar]
- Powers PK, Binder MD. Experimental evaluation of input-output models of motoneuron discharge. Journal of Neurophysiology. 1996;75:367–379. doi: 10.1152/jn.1996.75.1.367. [DOI] [PubMed] [Google Scholar]
- Safronov BV. Spatial distribution of Na+ and K+ channels in spinal dorsal horn neurones: role of the soma, axon and dendrites in spike generation. Progress in Neurobiology. 1999;59:217–241. doi: 10.1016/s0301-0082(98)00051-3. [DOI] [PubMed] [Google Scholar]
- Safronov BV, Vogel W. Single voltage-activated Na+ and K+ channels in the somata of rat motoneurones. Journal of Physiology. 1995;487:91–106. doi: 10.1113/jphysiol.1995.sp020863. [DOI] [PMC free article] [PubMed] [Google Scholar]
- Sah P. Ca2+-activated K+ currents in neurons: types, physiological roles and modulation. Trends in Neurosciences. 1996;19:150–154. doi: 10.1016/s0166-2236(96)80026-9. [DOI] [PubMed] [Google Scholar]
- Schmidt BJ. Afterhyperpolarization modulation in lumbar motoneurones during locomotor-like rhythmic activity in the neonatal rat spinal cord in vitro. Experimental Brain Research. 1994;99:214–222. doi: 10.1007/BF00239588. [DOI] [PubMed] [Google Scholar]
- Schwindt PC, Crill WE. Properties of a persistent inward current in normal and TEA-injected motoneurons. Journal of Neurophysiology. 1980;43:1700–1724. doi: 10.1152/jn.1980.43.6.1700. [DOI] [PubMed] [Google Scholar]
- Tegner J, Hellgren-Kotaleski J, Lansner A, Grillner S. Low-voltage-activated calcium channels in the lamprey locomotor network: simulation and experiment. Journal of Neurophysiology. 1997;77:1795–1812. doi: 10.1152/jn.1997.77.4.1795. [DOI] [PubMed] [Google Scholar]
- Traub RD. Motoneurones of different geometry and the size principle. Biological Cybernetics. 1977;25:163–176. doi: 10.1007/BF00365213. [DOI] [PubMed] [Google Scholar]
- Traub RD, Wong RKS, Miles R, Michelson H. A model of a CA3 hippocampal pyramidal neuron incorporating voltage-clamp data on intrinsic conductances. Journal of Neurophysiology. 1991;66:635–650. doi: 10.1152/jn.1991.66.2.635. [DOI] [PubMed] [Google Scholar]
- Umemiya M, Berger AJ. Properties and function of low- and high-voltage-activated Ca2+ channels in hypoglossal motoneurons. Journal of Neuroscience. 1994;14:5652–5660. doi: 10.1523/JNEUROSCI.14-09-05652.1994. [DOI] [PMC free article] [PubMed] [Google Scholar]
- Viana F, Bayliss DA, Berger AJ. Calcium conductances and their role in firing behaviour of neonatal rat hypoglossal motoneurones. Journal of Neurophysiology. 1993a;69:2137–2149. doi: 10.1152/jn.1993.69.6.2137. [DOI] [PubMed] [Google Scholar]
- Viana F, Bayliss DA, Berger AJ. Multiple potassium conductances and their role in action potential repolarization and repetitive firing behavior of neonatal rat hypoglossal motoneurons. Journal of Neurophysiology. 1993b;69:2150–2163. doi: 10.1152/jn.1993.69.6.2150. [DOI] [PubMed] [Google Scholar]
- Wollner DA, Catterall WA. Localization of sodium channels in axon hillocks and initial segments of retinal ganglion cells. Proceedings of the National Academy of Sciences of the USA. 1986;83:8424–8428. doi: 10.1073/pnas.83.21.8424. [DOI] [PMC free article] [PubMed] [Google Scholar]