Abstract
Glucose-responsive (GR) neurons from hypothalamic nuclei are implicated in the regulation of feeding and satiety. To determine the role of intracellular ATP in the closure of ATP-sensitive K+ (KATP) channels in these cells and associated glia, the cytosolic ATP concentration ([ATP]c) was monitored in vivo using adenoviral-driven expression of recombinant targeted luciferases and bioluminescence imaging. Arguing against a role for ATP in the closure of KATP channels in GR neurons, glucose (3 or 15 mm) caused no detectable increase in [ATP]c, monitored with cytosolic luciferase, and only a small decrease in the concentration of ATP immediately beneath the plasma membrane, monitored with a SNAP25–luciferase fusion protein. In contrast to hypothalamic neurons, hypothalamic glia responded to glucose (3 and 15 mm) with a significant increase in [ATP]c. Both neurons and glia from the cerebellum, a glucose-unresponsive region of the brain, responded robustly to 3 or 15 mm glucose with increases in [ATP]c. Further implicating an ATP-independent mechanism of KATP channel closure in hypothalamic neurons, removal of extracellular glucose (10 mm) suppressed the electrical activity of GR neurons in the presence of a fixed, high concentration (3 mm) of intracellular ATP. Neurons from both brain regions responded to 5 mm lactate (but not pyruvate) with an oligomycin-sensitive increase in [ATP]c. High levels of the plasma membrane lactate-monocarboxylate transporter, MCT1, were found in both cell types, and exogenous lactate efficiently closed KATP channels in GR neurons. These data suggest that (1) ATP-independent intracellular signalling mechanisms lead to the stimulation of hypothalamic neurons by glucose, and (2) these effects may be potentiated in vivo by the release of lactate from neighbouring glial cells.
Neurons located in baso-medial regions of the hypothalamus are implicated in the regulation of satiety and feeding behaviour (Oomura et al. 1969; Levin et al. 1999). Thus, ablation of hypothalamic centres such as the ventromedial hypothalamic nucleus (VMH) leads to over-eating and obesity (Borg et al. 1994), whereas destruction of the lateral hypothalamic area (LHA) results in hypophagia and weight loss (Leibowitz, 1984). The VMH, along with the arcuate nucleus (ARC), is the major target of the satiety factor and obese (ob) gene product, leptin (Zhang et al. 1994). These hypothalamic centres contain both glucose-responsive (GR) neurons, which respond to increases in glucose concentration with an increased firing rate, and glucose-sensitive (GS) neurons, whose electrical activity is decreased with increasing concentrations of the sugar (Levin et al. 1999), as well as glucose non-responsive neurons.
The mechanisms underlying the regulation of neuronal activity by glucose are presently undefined. The ability of sulphonylureas such as tolbutamide to depolarise VMH and ARC hypothalamic neurons (Ashford et al. 1990; Spanswick et al. 1997), and the expression within the hypothalamus of the islet/liver form of glucokinase (hexokinase IV) (Jetton et al. 1994), have implicated a signalling mechanism for glucose analogous to that believed to operate in pancreatic islet β-cells (Prentki et al. 1997; Rutter, 2001). In the latter case, increases in the free cytosolic ATP concentration ([ATP]c) (Kennedy et al. 1999), resulting from enhanced mitochondrial metabolism of glucose carbons (Panten et al. 1973), probably leads to the closure of an ATP-sensitive K+ (KATP) channel. This, in turn, suppresses the efflux of K+ ions (Boschero et al. 1988), leading to depolarisation of the plasma membrane (Henquin & Meissner, 1984), and the firing of action potentials. The opening of voltage-sensitive L-type Ca2+ channels (Safayhi et al. 1997), and influx of Ca2+ ions (Grapengiesser et al. 1989; Theler et al. 1992), then causes exocytosis (Pouli et al. 1998; Lang, 1999; Rorsman et al. 2000). Our recent studies, using recombinant targeted luciferases (Kennedy et al. 1999; Ainscow & Rutter, 2001), have supported the above model for β-cell glucose-signalling, by demonstrating that increases in free [ATP]c occur in both islets and isolated β-cells in response to elevations in glucose concentration over the physiological range (3-16 mm).
In contrast to β-cells, the role of [ATP]c changes in the response of hypothalamic neurons to glucose is less clear (Mobbs et al. 2001). Moreover, biochemical measurements of changes in total ATP content are complicated by the presence in hypothalamic cultures or slices of glial and other cells, such that any changes may not necessarily reflect alterations within the neurons themselves. On the other hand, the role of the support cells as generators of signalling molecules (Magistretti, 2000) has previously received little attention with regard to glucose sensing by the hypothalamus.
To circumvent these problems, we apply here dynamic bioluminescence imaging to record [ATP]c in real-time during challenge of neurons and glial cells with glucose or other nutrient stimuli. Using adenovirus-based vectors (Ainscow & Rutter, 2001) to express luciferases with high efficiency in neurons and associated glia, we show by photon-counting imaging that: (a) [ATP]c changes in hypothalamic neurons in response to [glucose] elevation (from 0 to 3 or 15 mm) are below the level of detection in this assay (≈2 %), both in the bulk cytosol and immediately beneath the plasma membrane, suggesting that mechanisms other than changes in [ATP]c are responsible for the regulation of KATP channels in these cells; (b) hypothalamic glia respond to 3 or 15 mm glucose with robust increases in [ATP]c, and (c) neurons respond to lactate (but not pyruvate) with increases in [ATP]c. These data therefore provide evidence for both a direct, intracellular mechanism of KATP channel regulation which does not involve increases in cytosolic [ATP], as well as a separate, intercellular signalling mechanism, mediated by lactate released from neighbouring glial cells.
METHODS
Neuronal isolation and culture
All procedures used conformed with the UK Animals (Scientific Procedures) Act 1986. Two Wistar rat pups, 2-4 days postnatal, were used in each preparation of neuronal tissue. The pups were humanely killed by cervical dislocation. Following decapitation, the basomedial region of the hypothalamus and the cerebellum were removed. The brain tissue from the two separate regions was then transferred to a solution of Hepes-buffered saline (HBS) consisting of (mm): NaCl 125, KCl 2.7, Hepes 5, glucose 3, pH 7.4, and then finely chopped. The tissue was then digested in HBS supplemented with 1 mg ml−1 protease XIV (Sigma, Poole, Dorset, UK) and 1 mg ml−1 protease X (Sigma) for 30 min at 25 °C with occasional shaking. Following digestion, hypothalamic and cerebellar tissue were each transferred to three aliquots of 2 ml HBS and gently triturated using flame-polished Pasteur pipettes. The cells were pelleted by centrifugation at 1000 g for 4 min then resuspended and bulked in 2 ml of Dulbecco's modified Eagle's medium (DMEM; Sigma) supplemented with 10 % (v/v) fetal bovine serum (Life Technologies), 11 mm glucose, 2 mm glutamine, 5 μg ml−1 insulin, 10 μg ml−1 penicillin and 10 μg ml−1 streptomycin. The cells were centrifuged as above then resuspended in 0.5 ml of the above medium. Approximately 20 μl of cell suspension was spotted onto poly-l-lysine-coated glass coverslips or 35 mm plastic Petri dishes and left to attach to the support by incubation for 1 h under an atmosphere of 5 % CO2-95 % O2 at 37 °C. DMEM, supplemented as above, was then added and the cells were cultured overnight. The medium was then changed to neurobasal medium (Life Technologies) supplemented with N2 serum (Life Technologies), 2 mm glutamine, 10 μg ml−1 penicillin and 10 μg ml−1 streptomycin. After 4-6 days of culture the medium was supplemented with 5 μM arabinosylcytosine (Sigma) to inhibit glial cell growth. Cells were used 6-9 days following isolation.
Viral generation and infection
Synthesis of an adenovirus encoding cDNA for enhanced green fluorescent protein (eGFP) and cytosol-targeted firefly luciferase (AdCMVcLuc) has been described previously (Ainscow & Rutter, 2001). The adenovirus encoding eGFP and a SNAP25–luciferase chimaera was based on plasmid pmLuc (Kennedy et al. 1999). The SV40 immediate early gene promoter of this plasmid was replaced by digestion with Bgl II and Stu I and insertion of the 938 bp Bgl II-Eco RV fragment of pcDNA3 containing the CMV immediate early promoter. The entire promoter, coding sequence and polyadenylation signal from the resulting plasmid was excised with Bgl II and Sal I and ligated into the adenoviral shuttle vector pAdTrack (He et al. 1998) that had been digested with the same enzymes. Recombination of this plasmid with the pAdeasy-1 (He et al. 1998), amplification in human embryonic kidney (HEK) 293 cells and CsCl purification were carried out as reported previously (Ainscow et al. 2000).
Cells were infected by addition of purified virus at an approximate multiplicity of infection (MOI) of 100 infectious particles per cell, for a period of 4 h, after which the incubation medium was changed. Imaging was performed 16-24 h post infection. Whilst the efficiency of neuronal infection was improved if cells were cultured in plastic Petri dishes rather than on poly-l-lysine-treated glass coverslips (results not shown), qualitatively no difference was seen in the response of cells cultured on either support.
Bioluminescence, Ca2+ and NAD(P)H imaging
Bioluminescence imaging was carried out using a Photek ICCD 216TM imaging system (Photek Ltd, East Sussex, UK) attached to a Zeiss X70 Axiovert inverted microscope with a × 20 objective, essentially as described previously (Kennedy et al. 1999). Briefly, cells were maintained at 37 °C on a heated stage in Krebs-Ringer bicarbonate (KRB) medium comprising (mm): NaCl 125, KCl 3.5, CaCl2 1.5, MgSO4 0.5; KH2PO4 0.5, NaHCO3 2.5, Hepes-Na 10, pH 7.4, equilibrated with 95 % O2-5 % CO2, and supplemented with 0.5 μM luciferin immediately before imaging. Additions to the medium were made using a remotely operated syringe. Neurons were distinguished from glia by their morphology and high birefringence when viewed under phase contrast illumination. Infection with adenovirus was tracked by monitoring eGFP expression using the same microscope (mercury arc lamp illumination, excitation and emission filters from Chroma Technology, Brattleboro, VT, USA) (Ainscow et al. 2000). For luciferase imaging, light output from individual cells was recorded with an integration period of 10 s and normalised to that in the absence of glucose or respiratory inhibitors.
Imaging of [Ca2+] was performed essentially as described previously (Ainscow et al. 2000) with the exception that cells were loaded with 5 μM fura-2 AM (Sigma) for 20 min in the presence of 0.05 % Pluronic F-127 (BASF, Mount Olive, NJ, USA) and glucose-free KRB solution was used in all incubations. Ratiometric images (350 nm/380 nm) were collected at 2 s intervals, using a Perkin-Elmer imaging system, and data were expressed as changes in fluorescence ratio. Tolbutamide and glucose were added directly via the superfusate. Data were obtained from the soma of individual neurons (6-12 days in culture).
Confocal imaging of NAD(P)H autofluorescence was carried out using a Leica inverted SP2 system with a × 40 objective and a coherent UV laser (excitation line 364 nm, emission 400-500 nm) (Ainscow et al. 2000). The response of cells to the addition of glucose or lactate is reported as the relative change in fluorescence normalised to that in the absence of substrate. The same system was used for imaging mitochondrial membrane potential using tetramethyl rhodamine ethyl ester, as described previously (Kennedy et al. 1999).
To assess lactate accumulation during the above incubations, samples were taken at the end of experiments and assayed for lactate content as described (Bergmeyer, 1965).
Immunocytochemistry
Expression of lactate-monocarboxylate transporter (MCT) isoforms (Poole et al. 1996; Zhao et al. 2001) and the plasma membrane localisation of the SNAP25–luciferase chimaera (Kennedy et al. 1999) in neurons and glia were confirmed by immunocytochemistry. Cells were fixed by treatment with acetone at 4 °C for 10 min and permeabilised with 0.2 % Triton X-100. Luciferase targeting was monitored with a rabbit anti-luciferase polyclonal primary antibody (Promega) and revealed using a tetramethyl rhodamine-conjugated anti-rabbit immunoglobulin G secondary antibody (Promega). Antibodies raised in rabbit to MCT isoforms 1 and 2 (Poole et al. 1996) were a kind gift from Professor Andrew Halestrap, University of Bristol, UK, and were revealed using an Alexafluor 488-conjugated anti-rabbit immunoglobulin G secondary antibody (Molecular Probes). Confocal imaging was performed using the above confocal system with a × 63 objective and excitation lines of 488 and 568 nm.
Electrophysiology
Male Sprague-Dawley rats (50-100 g) were anaesthetised with enflurane (4 % v/v) and decapitated. The brain was rapidly removed and immersed in artificial cerebrospinal fluid (aCSF) containing (mm): NaCl 127, KCl 1.9, KH2PO4 1.2, CaCl2 2.4, MgCl2 1.3, NaHCO3 26, d-glucose 10, equilibrated with 95 % O2-5 % CO2, pH 7.4. Coronal slices (350 μm) containing the arcuate nucleus were prepared using a vibratome. Slices were incubated at room temperature in oxygenated aCSF for a minimum period of 1 h. For slice recordings, sections were transferred to the recording chamber where they were submerged, fixed in position between two grids, whilst being continuously perfused with aCSF at a rate of 5-10 ml min−1.
Whole-cell recordings were made in the current-clamp mode using an Axopatch-1D amplifier (Axon Instruments), at room temperature (18-22 °C). Recording electrodes (resistance 3-10 MΩ) were filled with an intracellular solution containing (mm): potassium gluconate 130, KCl 10, MgCl2 0.1, CaCl2 0.05, EGTA-Na3 0.5, Hepes 10, Na2ATP 3, biocytin 10 (pH 7.4; osmolarity 310-315 mosmol l−1, adjusted as required with sucrose). Experiments were viewed on-line on both an oscilloscope and a chart recorder. Data were recorded by a digital tape recorder and stored on DAT tape enabling off-line analysis. Changes in input resistance were examined by monitoring membrane potential responses to negative, rectangular current pulses (10-40 pA, 500 ms, 0.3 Hz) injected via the recording electrode. Applications of glucose-free aCSF or tolbutamide were made via the bath perfusion system.
Single channel recordings were made from hypothalamic neurons acutely isolated by enzymatic treatment of coronal slices containing the medial hypothalamus, as described previously (Spanswick et al. 1997). In brief, sections containing the ARC + VMH were incubated with oxygenated aCSF containing 1 mg ml−1 protease XIV (Sigma) for 1 h at room temperature. Sections were washed five times in 30 ml aCSF and then resuspended in aCSF (5 ml) prior to gentle trituration. Neurons were plated onto concanavalin A- (Sigma) treated culture dishes for 20 min before patching. Cell-attached recordings were made using an Axopatch 200A amplifier at room temperature with patch pipettes (5-10 MΩ) filled with electrode solution containing (mm): KCl 140, CaCl2 1, MgCl2 1, Hepes 10, pH 7.2. The bath solution consisted of (mm): NaCl 135, KCl 5, CaCl2 1, MgCl2 1, Hepes 10, glucose 3, pH 7.4. Mean channel activity was measured as NfPo (where Nf is the number of functional channels and Po is the open probability), as described previously (Lee et al. 1995) over a 120 s period using pCLAMP6 software (Fetchan).
Statistics
Data are presented as the means ± s.e.m. of the number of cells analysed, from at least three independent experiments. Unless stated otherwise, significance tests were performed using Student's two-tailed t test. For imaged data, in order to generate the averaged response to a stimulus, time course data from the individual cells were averaged over the time period of incubation in that condition excluding the first 100 s following the addition in all cases. P < 0.05 was considered significant.
RESULTS
Response of NAD(P)H to elevated glucose concentrations in hypothalamic and cerebellar neurons and glia
To confirm the presence in hypothalamic cultures of GR neurons, changes in intracellular free calcium ions ([Ca2+]i) upon addition of the sulphonylurea tolbutamide were monitored after cell loading with the ratiometric dye fura-2. GR neurons are expected to respond with a robust increase in [Ca2+]i resulting from the presence of abundant KATP channels (Levin et al. 1999). Sixty per cent of cells (18/30 from three different preparations) displayed an increase in [Ca2+]i upon addition of tolbutamide (200 μM; Fig. 1A). Moreover, all neurons that responded to tolbutamide also responded to a subsequent challenge with 15 mm glucose with repetitive [Ca2+]i spikes (Fig. 1A). By contrast, tolbutamide- and glucose-induced [Ca2+]i changes were not observed in glia from cultures of hypothalamic cells or in neurons and glia from the cerebellum (not shown).
Figure 1. Glucose-induced changes in NAD(P)H fluorescence in neuronal cultures.
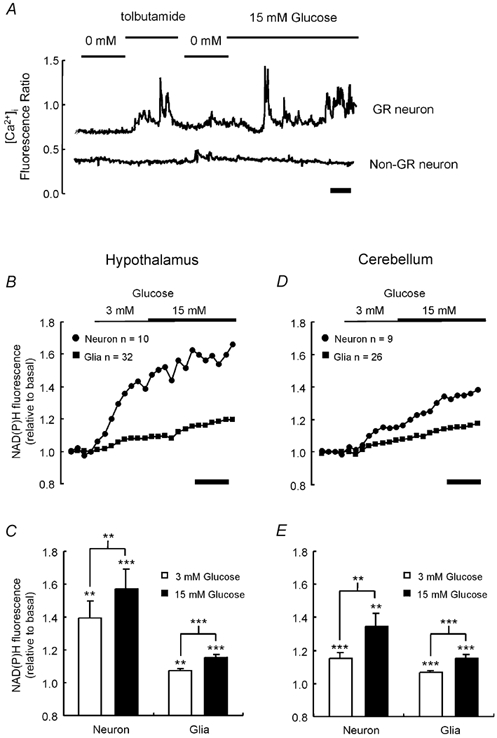
A, changes in [Ca2+]i were monitored in fura-2-loaded cells, as described in Methods. Tolbutamide (200 μM) and glucose (15 mm) were added as indicated. B-E, changes in cellular autofluorescence, indicative of mitochondrial NAD(P)H concentration, were monitored by confocal microscopy in neurons and glia from hypothalamic (B) and cerebellar (D) neuronal cultures in response to a successive increase in glucose from 0 to 3 to 15 mm. In C and E, the mean ± s.e.m. response of each cell type at greater than 100 s post addition is also given. Significant changes in autofluorescence from basal levels and between additions were assessed using Student's t test; ** P < 0.01; *** P < 0.001. In A, B and D, calibration bars represent 200 s.
We next explored the effects of changes in glucose concentration, over two distinct ranges, on metabolism within neurons and glia from the two brain regions. We considered this to be important as the physiological range of concentrations to which the hypothalamus is usually exposed is controversial at present (Silver & Erecinska, 1998; Mobbs et al. 2001). Nevertheless, at a glucose concentration of 5-6 mm in the blood, Silver & Erikinska (1998) measured a concentration of 2-3 mm in the rat hypothalamus, suggesting that this may be the resting level in normoglycaemic animals. However as the blood-brain barrier is weak in this region of the brain there exists the possibility that ARC neurons in particular may sample glucose concentrations akin to those present in the plasma. Thus, by increasing [glucose] from 3 to 15 mm, we also explored the responses of hypothalamic neurons over this higher range. Importantly, this latter concentration range is one over which glucokinase (Iynedjian, 1993), the expression of which has been demonstrated recently in the VMH (Yang et al. 1999; Lynch et al. 2000), responds optimally to the sugar.
Cellular autofluorescence upon excitation with near UV light was used as an indicator of the redox state of the cells, which is likely to mainly reflect changes in the concentration of NADH (and NAD(P)H) within the mitochondrial matrix (Panten et al. 1973). Both hypothalamic (Fig. 1B and C) and cerebellar (Fig. 1D and E) cultured neurons displayed a dramatic and significant increase in cellular autofluorescence upon addition of 3 mm glucose. This was significantly enhanced, by approximately 20 %, upon further elevation of [glucose] to 15 mm in neurons from either brain region. Glia in cultures of either hypothalamus- or cerebellum-derived cells showed a smaller, but significant, increase in NAD(P)H fluorescence on increasing glucose from 0 to 3 or from 3 to 15 mm (Fig. 1B-E).
Response of [ATP]c to elevated glucose concentrations in hypothalamic and cerebellar neurons and glia
Live cell imaging of cytosolic free [ATP] with expressed luciferases has been previously used to monitor the dynamic response of pancreatic β-cells to glucose (Kennedy et al. 1999). Application of this technique to neuronal cultures enabled the response of individual cells to be examined and also allowed discrimination between the responses of neurons and glia within a heterogeneous population.
To provide a highly efficient means of gene transfer, adenoviral vectors were used (see Methods). These vectors drove luciferase expression in > 85 % of both glia and neurons (not shown and Fig. 2A). We first estimated the resting concentration of ATP in each cell type after permeabilisation of the plasma membrane with 20 μg ml−1 digitonin and incubation with 10 mm MgATP. These conditions are calculated to give approximately 90 % maximal luciferase activity, assuming a Km of luciferase for MgATP of 1.2 mm (Kennedy et al. 1999). This strategy revealed resting cytosolic ATP concentrations well within the dynamic range for detection by luciferase (0.9 ± 0.1 mm, mean ± s.e.m. for neurons, mean of eight individual cells from three separate preparations; 1.4 ± 0.2 mm for glia, 13 cells from three preparations, P < 0.05 with respect to hypothalamic neurons).
Figure 2. Glucose-induced changes in [ATP]c.
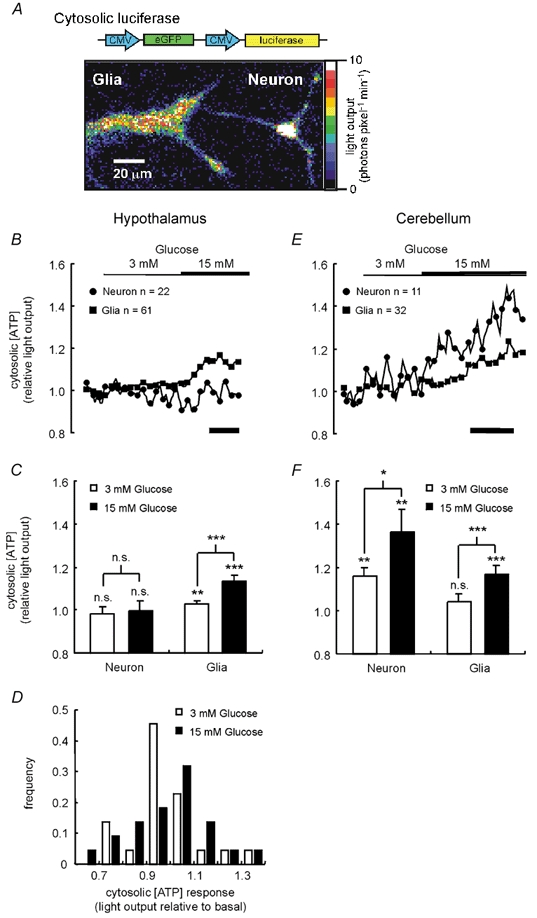
A, neuronal cultures were infected with virus AdCMVcLuc (Ainscow & Rutter, 2001), bearing cDNA encoding humanised firefly luciferase and eGFP each under a CMV promoter. Successfully infected individual glia and neurons, identified by eGFP expression, could be imaged and their light output, and thus [ATP]c, could be recorded in the presence of 0.5 μM luciferin. Shown is a pseudo-colour image of the light output from cultured hypothalamic cells. B and E, the dynamic response of [ATP]c to stepped increases of [glucose] from 0 to 3 to 15 mm was imaged in neurons and glia isolated from the hypothalamus (B) or the cerebellum (E). Mean values (± s.e.m.) of the responses at time points later than 100 s after each increase in glucose concentration are given in C and F. D, a histogram of the individual responses of the hypothalamic neurons to both glucose concentrations failed to reveal any differential response of a subpopulation of cells. Significant changes from basal light output or differences between the effects of different additions were assessed by Student's t test: n.s., not significant; * P < 0.05; ** P < 0.01; *** P < 0.001. For clarity, in B and E data points are shown only at 60 s intervals. In B and E, calibration bars represent 200 s.
Figure 2 shows the dynamic responses of [ATP]c to an elevation of [glucose] from 0 to 3 and then to 15 mm in neurons and glia from the hypothalamus (Fig. 2B and C) and the cerebellum (Fig. 2E and F). Surprisingly, no detectable increase in [ATP]c was observed in hypothalamic neurons upon increases in [glucose] to either concentration (Fig. 2B and C). We next tested whether the absence of any detectable change in [ATP]c when analysed over a population of cells within a field may reflect an increase in only a subpopulation of neurons. However, as apparent from the normal distribution of changes in response to either 3 or 15 mm glucose shown in Fig. 2D, no evidence for such behaviour was apparent. Glial cells within the same cultures showed a small but significant increase in [ATP]c when the glucose concentration was raised from 0 to 3 mm, and an additional increase at 15 mm glucose (Fig. 2C).
In neurons isolated from the cerebellum, the resting cytosolic ATP concentration was 0.6 ± 0.1 mm (mean ± s.e.m. of seven cells from three different preparations). Cerebellar neurons also displayed an increase in luciferase bioluminescence when the glucose concentration was raised from 0 to either 3 or subsequently 15 mm (Fig. 2E and F). However, cerebellar glia (resting [ATP]c = 1.5 ± 0.4 mm, 18 cells from three preparations, P < 0.01 with respect to cerebellar neurons) responded in an identical manner to that observed for hypothalamic glia (Fig. 2E and F).
Given the morphology of neurons, and in particular the presence of neurite extensions, it seemed possible that local ‘subdomains’ of [ATP]c may exist within these cells. Such changes may conceivably go undetected using untargeted (cytosolic) luciferase; indeed, we have previously reported differential responses of subcellular compartments of [ATP] to glucose in pancreatic β-cell lines, which have a much simpler morphology than hypothalamic neurons (Kennedy et al. 1999). In order to address this possibility, we therefore generated an adenoviral vector, AdCMVpmLuc, encoding a SNAP25–luciferase chimaera (Kennedy et al. 1999). The subcellular localisation of this chimaera at the plasma membrane of hypothalamic neurons was confirmed by immunocytochemistry (Fig. 3A), as most clearly seen in the cell soma (Fig. 3A, centre panel). Although no significant changes in [ATP] beneath the plasma membrane ([ATP]pm) were observed either in the cell body or in neurite extensions upon an increase in [glucose] from 0 to 3 mm, further elevation of [glucose] to 15 mm again revealed differences between the responses of hypothalamic and cerebellar neurons. Thus, hypothalamic neurons displayed a significant decrease in [ATP]pm over the range 3-15 mm glucose (Fig. 3B and C), perhaps indicative of enhanced ATP consumption due to increased firing (see below). By contrast, cerebellar neurons displayed a significant elevation of [ATP]pm during incubation with 15 mm glucose (Fig. 3B and C), as observed with the cytosolic luciferase (Fig. 2E). Thus, it appears that differences in glucose-induced ATP generation or turnover exist between neurons isolated from these two different regions. Moreover, the intriguing observation that, in hypothalamic neurons, [ATP]pm (Fig. 3B and C), but not [ATP]c (Fig. 2B and C), declined following an increase in glucose from 3 to 15 mm demonstrates that microgradients in the concentration of this nucleotide are indeed created in hypothalamic neurons after nutrient stimulation, but do not lead to changes which could explain the closure of KATP channels under these conditions.
Figure 3. Glucose-induced changes in [ATP]pm in neurons.
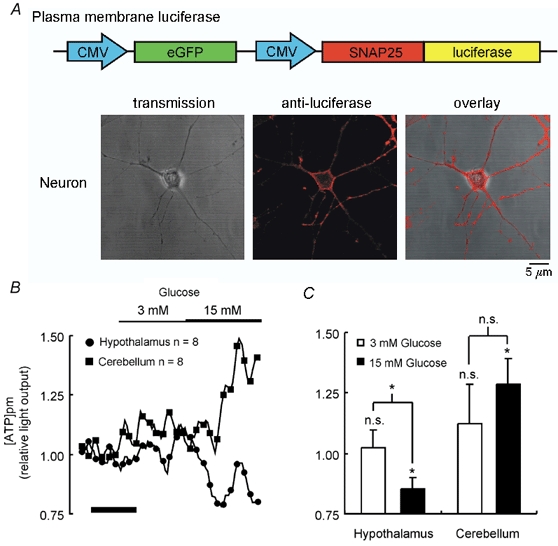
A, neuronal cultures were infected with adenovirus (AdCMVpmLuc) encoding plasma membrane-targeted luciferase and successful targeting of luciferase to the plasma membrane of neurons was detected by immunocytochemistry using a polyclonal anti-luciferase primary antibody and confocal microscopy (A; see Methods). B, dynamic response of light output and thus [ATP]pm to elevation of [glucose] to 3 and 15 mm monitored in neurons from the hypothalamus and cerebellum. C shows the mean ± s.e.m. response at greater than 100 s post addition. Significant changes in light output from basal levels, and differences between the effects of different additions, were assessed using Student's t test: n.s., not significant; * P < 0.05. In B, the calibration bar represents 200 s.
ATP synthesis and consumption are closely balanced in hypothalamic neurons
In order to understand the apparently paradoxical failure of hypothalamic neurons to respond to an increase in glucose concentration with an increase in [ATP]c, despite an increase in mitochondrial metabolism (as reported by elevated NAD(P)H fluorescence; Fig. 1B and C), we next investigated the possibility that increased ATP production during challenge with elevated glucose concentrations may be balanced by an essentially identical increase in ATP consumption. Indeed, since GR neurons increase their firing rates in high [glucose] (Ashford et al. 1990; Mobbs et al. 2001), it could be predicted that ATP demand may increase too. In particular, a major ATP-consuming activity during neuronal firing is likely to be the Na+-K+-ATPase activity involved in maintenance of ionic gradients across the plasma membrane.
Figure 4 shows the response of [ATP]c in hypothalamic neurons and glia to the addition of 0.1 mg ml−1 ouabain, added to inhibit Na+-K+-ATPase activity, followed by 15 mm glucose. Ouabain did not cause a significant change in [ATP]c in either neurons or glia. However, subsequent elevation of [glucose] to 15 mm caused a 19.8 ± 3.4 % (n = 8 cells; P < 0.01vs. basal) increase in light output from neurons. If the additions were made in the reverse order, then 15 (vs. 3) mm glucose induced no significant (5.6 ± 5.1 %; n = 8; P > 0.05vs. basal) increase in light output whereas subsequent addition of ouabain caused a 21.2 ± 5.8 % (P < 0.01vs. basal) increase in light output (not shown). These results thus suggest that there is an increase in Na+-K+-ATPase activity during glucose stimulation of hypothalamic neurons, and that this pump is indeed a substantial consumer of ATP during neuronal firing.
Figure 4. Presence of ouabain reveals glucose-induced elevation of [ATP]c in hypothalamic neurons.
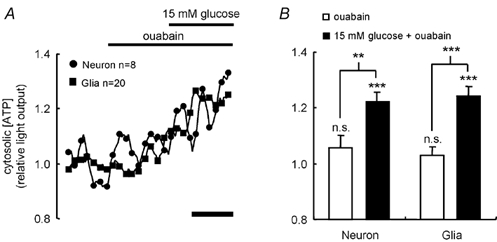
A, the dynamic response of [ATP]c in neurons and glia derived from the hypothalamus was monitored during the successive addition of 0.1 mg ml−1 ouabain and 15 mm glucose, as described in Fig. 2.B shows the average responses of the two different cell types. Significant changes from basal light output or reponses to the additions were assessed using Student's t test: n.s., not significant; ** P < 0.01; *** P < 0.001. In A, the calibration bar represents 200 s.
Differential fuel metabolism by neurons and glia
The metabolic interactions between glia and neurons have been the subject of much recent study (Pellerin et al. 1998; Magistretti, 2000). Such metabolic communication between glia and neurons may be particularly relevant to the activation of GR neurons, which has been proposed to occur via a metabolic sensing mechanism as proposed for the pancreatic β-cell (Levin et al. 1999).
The metabolism of neurons and glia isolated from both the hypothalamus and cerebellum was therefore investigated further to determine whether metabolic coupling between cells may play a role in glucose sensing. The response of [ATP]c to glucose in the presence of oligomycin, an inhibitor of the mitochondrial Fo-F1ATP-synthase (Nicholls, 1982), was monitored first. When applied to neurons from either brain region, oligomycin induced a significant decrease in neuronal [ATP]c, but had no affect on glial [ATP]c (Fig. 5). Subsequent addition of 15 mm glucose had no effect on steady-state neuronal [ATP]c, suggesting that, at least in the cerebellar neurons, there is a requirement for mitochondrial ATP synthesis in order for glucose to elevate [ATP]c.
Figure 5. Differential glucose metabolism in neurons and glia.
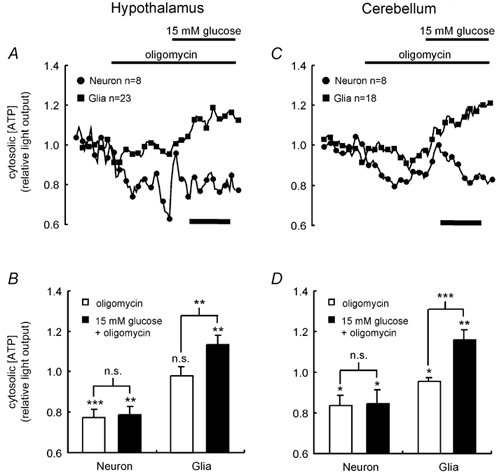
A and C, the dynamic response of [ATP]c in neurons and glia derived from the hypothalamus (A) or cerebellum (C) was monitored during the successive addition of 1 μg ml−1 oligomycin and 15 mm glucose, as described in Fig. 2.B and D show the average responses of the two different cell types. Significant changes of light output from basal values, and responses to the additions, were assessed by Student's t test: n.s., not significant; * P < 0.05; ** P < 0.01; *** P < 0.001. In A and C, calibration bars represent 200 s.
In contrast, glia displayed an approximate 20 % increase in light output upon [glucose] elevation (from 0 to 15 mm), equal to that seen in the absence of oligomycin (Fig. 5). Thus, ATP synthesis from glucose appears to be independent of mitochondrial function in glial cells and thus principally due to anaerobic glycolysis. In support of this view, addition of oligomycin to glial cells had no impact on mitochondrial membrane potential, assayed using the potential-sensitive dye, tetramethyl rhodamine ethyl ester (not shown). This lack of response is in contrast to the well-defined effect of oligomycin to increase mitochondrial membrane potential in isolated mitochondria (Rolfe et al. 1994), as well as in situ in a range of cell and tissue types (Brown, 1992), including hepatocytes (Brown et al. 1990), perfused skeletal muscle (Rolfe & Brand, 1996) and pancreatic islet MIN6 β-cells (E. K. Ainscow & G. A. Rutter, unpublished observations).
Role of lactate in the regulation of hypothalamic neuron firing
If glial cells metabolise glucose largely by glycolytic metabolism, then it could be predicted that they release lactate as the end product. This raises the possibility that neighbouring neurons might then metabolise this released lactate oxidatively. Addition of 5 mm lactate to neurons and glia isolated from either brain region caused a significant (P < 0.01) increase in the NAD(P)H autofluorescence, with a larger response in neurons than in glia (Fig. 6A and D). The response of [ATP]c in neurons to 5 mm lactate adds weight to the view that neurons are capable of oxidative metabolism while metabolism in glia is largely glycolytic (Fig. 6B, C, E and F). Moreover, neurons from either region of the brain responded to lactate with a rapid elevation of [ATP]c, which could be reversed by the addition of oligomycin. By contrast, glial cells from neither brain region showed an increase in [ATP]c in response to lactate, and in the case of hypothalamic cultures lactate caused a significant decrease in [ATP]c (Fig. 6B and C). This decrease may be attributable to a feedback on glycolysis of endogenous glycogen stores. Hence, there is a clear possibility that the anaerobic nature of glia cell metabolism results in lactate production that may then influence the energetic state of neighbouring neuronal cells.
Figure 6. Lactate-induced changes in NAD(P)H fluorescence and [ATP]c.
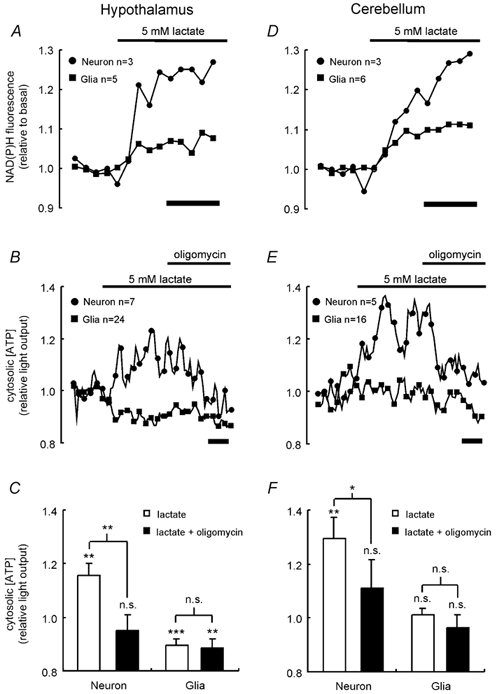
A and D, the response of NAD(P)H levels to addition of 5 mm lactate was monitored in hypothalamic (A) and cerebellar (D) neurons and glia, as described in Fig. 1.B and E, the response of [ATP]c in neurons and glia derived from the hypothalamus (B) or cerebellum (E) was monitored during successive addition of 5 mm lactate and 1 μg ml−1 oligomycin, as described in Fig. 2.C and F show the average responses of the different cell types. Significant changes from basal light output and responses to the additions were assessed by Student's t test: n.s., not significant; * P < 0.05; ** P < 0.01; *** P < 0.001. In A, B, D and E, calibration bars represent 200 s.
In contrast to the effects of lactate, 5 mm pyruvate caused a small (≈5 %) but significant (P < 0.05) increase in NAD(P)H autofluorescence, and a small (≈10 %) but significant (P < 0.05) decrease in [ATP]c in both neurons and glia from both brain regions (not shown).
Glucose regulates KATP channel activity in the presence of high intracellular ATP concentrations
The absence of a glucose-induced elevation of [ATP]c implied that an ATP-independent mechanism may regulate neuronal KATP channel activity in response to the sugar. To test this hypothesis, changes in the electrical activity of hypothalamic neurons in response to removal of glucose were recorded. Figure 7A shows a typical whole-cell patch-clamp (current-clamp configuration) recording of plasma membrane voltage responses in a GR arcuate nucleus hypothalamic neuron. Removal of 10 mm glucose hyperpolarised the neuron, a change which was accompanied by a cessation of action potential firing and a reduction in input resistance, suggesting an increase in membrane conductance. This response was reversed upon the application of tolbutamide (Fig. 7A), demonstrating the ability of KATP channel activity to regulate electrical activity. Importantly, the effects of glucose depletion were evident even though 3 mm ATP was present in the recording electrode, indicative of an ATP-independent signalling pathway for glucose.
Figure 7. Removal of extracellular glucose hyperpolarises GR neurons despite high intracellular ATP levels.
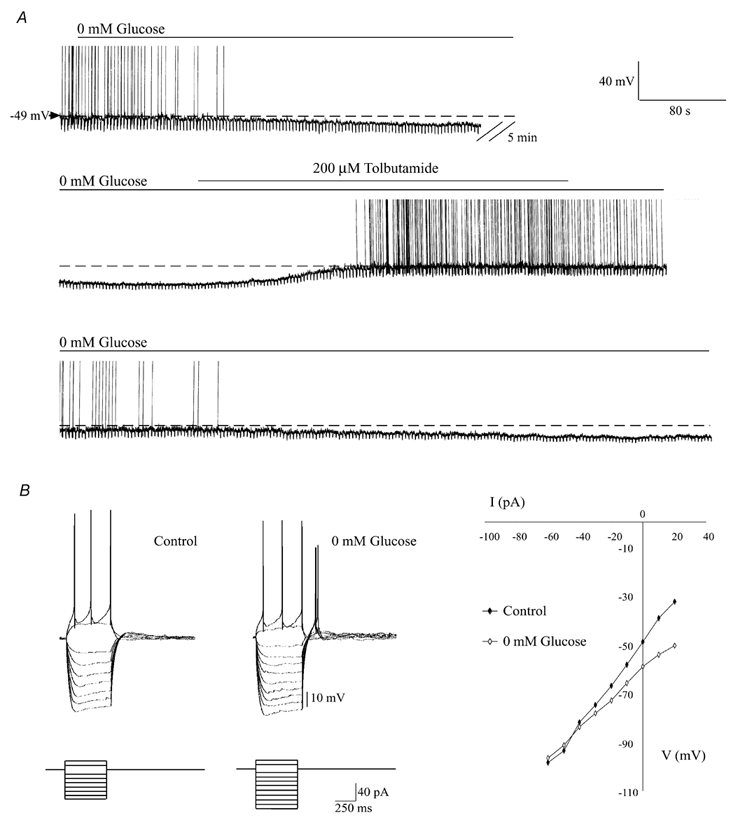
A, continuous whole-cell current-clamp recording from an arcuate GR neuron. In the presence of a high intracellular ATP concentration (3 mm), removal of extracellular glucose caused membrane hyperpolarisation and cessation of action potential firing with a concomitant reduction in input resistance. Application of tolbutamide (200 μM) reversed the effects of glucose removal. Washout of tolbutamide allowed the effects of glucose removal to re-emerge. B, left, electronic potentials elicited in response to current-pulse injection (lower panel) in the presence (Control) and absence of glucose. Right, the corresponding current-voltage relationships showed a reversal potential near −90 mV indicating activation of a K+ conductance.
Confirming the likely diffusion of added ATP throughout the cell cytosol, biocytin efficiently filled not only the cell soma but also axons and dendrites within the time course of our experiments, i.e. in < 20 min (data not shown).
At 10 mm glucose, the mean resting membrane potential was −47.4 ± 0.9 mV and reached −61.5 ± 1.2 mV within 15-20 min following removal of extracellular glucose (n = 10). Hyperpolarisation was accompanied by a 39.6 ± 3.1 % reduction in input resistance (1243 ± 121 to 746 ± 78 MΩ; n = 10) and the complete cessation of action potential firing. Current-voltage relationships in the presence and absence of extracellular glucose showed a reversal potential of −87 ± 0.4 mV (n = 3), consistent with an increase in K+ conductance (Fig. 7B). Application of the sulphonylurea tolbutamide (200 μM) reversed the glucose-free induced changes in electrophysiological properties, indicating that KATP channels underlie these effects (Fig. 7A; n = 10). Such changes in electrical activity are characteristic of GR neurons and have been attributed to activation of KATP channels (Ashford et al. 1990; Spanswick et al. 1997). However, this increase in tolbutamide-sensitive K+ conductance occurred under conditions in which intracellular [ATP] was essentially clamped at 3 mm.
Expression of plasma membrane lactate-monocarboxylate transporters in neurons and glia
Although glucose is apparently capable of regulating the activity of GR neurons independently of changes in intracellular ATP concentration, this does not rule out a parallel pathway whereby ATP may regulate KATP channel activity under some circumstances. Thus, despite the inability of glucose to elevate [ATP]c in hypothalamic neurons in culture (Fig. 2B and C), it appeared possible that glucose-derived lactate, generated by glia, may act as a second oxidative substrate for neurons. It should be stressed that in the cultures used in these experiments it is unlikely that such coupling would be strong since the cells were relatively dispersed (e.g. Fig. 2A and Fig. 3A). Indeed, the accumulation of lactate in the extracellular medium during glucose stimulation was found to be < 20 μM, a concentration which had no impact on NAD(P)H or [ATP]c in neurons or glia when added directly (not shown).
However, in situ, the close association of lactate and glia may mean that there may be channelling of lactate between glia and neurons provided that high levels of lactate transport activity were present in the plasma membranes of each cell type. To test this possibility, the expression of MCT isoforms 1 and 2 was assessed (Fig. 8). While no strong immunostaining for MCT2 was found in the cultures, MCT1 was highly expressed in both glia and neurons in the hypothalamus.
Figure 8. MCT1 expression in cultures of hypothalamic neurons and glia.
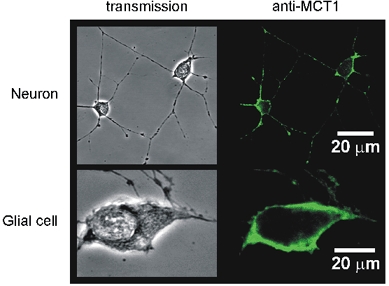
Immunocytochemistry (see Methods) was performed using a polyclonal anti-MCT1 primary antibody and imaged using confocal microscopy. Similar experiments using a polyclonal anti-MCT2 antibody revealed no strong staining (not shown).
In further support of a coupling mechanism involving lactate release by glia, and reuptake by neurons, we next demonstrated using cell-attached single channel recordings the ability of lactate to inhibit KATP channels in hypothalamic GR neurons (Fig. 9). In the presence of 3 mm extracellular glucose, GR neurons displayed little or no KATP channel activity, as described previously (Spanswick et al. 1997). However, following removal of glucose from the bathing medium, KATP channel activity increased from an NfPo of 0.02 ± 0.01 to 0.42 ± 0.12 (n = 5; P < 0.001) within 10 min. In the absence of extracellular glucose, subsequent bath addition of 5 mm lactate reversibly reduced KATP channel activity by 85 ± 5 % (n = 6; P < 0.001). Maximal reduction was observed within 5 min of lactate application.
Figure 9. Lactate inhibits KATP channel activity in GR neurons.
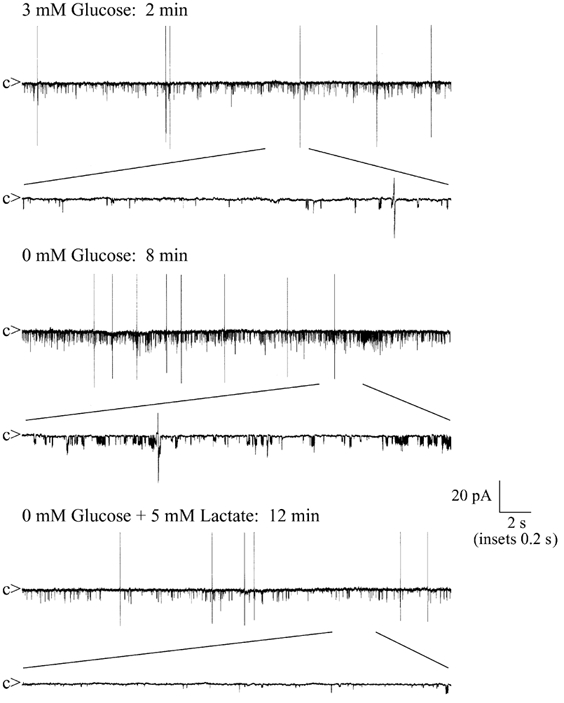
Sample cell-attached recordings taken at different time points from a single experiment. Following cell-attached formation, with 3 mm glucose in the bathing medium, channel activity was minimal. Removal of extracellular glucose resulted in an increase in KATP channel activity (openings downward) within 5-10 min. Bath application of 5 mm lactate caused a marked reduction in the glucose-free induced KATP channel activity. c denotes the channel closed state and biphasic potentials denote action potential firing. NfPo values: 3 mm glucose, 0.01; glucose free, 0.17; 5 mm lactate, 0.05.
DISCUSSION
Dynamic imaging of free ATP concentration in cellular subcompartments of neurons using adenoviral-expressed, targeted luciferases
We show here that it is possible to observe nutrient-dependent changes in intracellular ATP concentrations in both glia and neurons. Thus, we demonstrate that changes in free [ATP] can be imaged simultaneously in individual neurons and glia in heterogeneous cultures. This was achieved by combining the use of adenoviral vectors with photon-counting imaging (Kennedy et al. 1999), and was applicable to neurons derived from multiple brain regions. Moreover, through the additional device of the molecular targeting of luciferase to a discrete subcellular domain (the subplasma membrane region of the cytosol), we have also been able to resolve [ATP] changes at a resolution (nm) which would be impossible to achieve using optical techniques alone.
Whilst these studies used isolated cells as a well-defined system from the electrophysiological perspective, it seems likely that further advances in both viral gene delivery systems and the imaging system should soon permit the application of this approach to brain slices.
Differential responses to glucose concentration of hypothalamic neurons and glia
These studies reveal striking differences between the responses of hypothalamic neurons and glia. Whereas the ATP concentration changed in response to an increase in glucose both from 0 to 3 and from 3 to 15 mm in glia, no such changes were evident in neurons over either range of concentrations. Intriguingly, a robust increase in NAD(P)H could be observed in the same cells in response to glucose, suggesting that ATP production and consumption are closely matched in this system. In support of this view, inhibition of Na+-K+ exchange with ouabain (Fig. 4), and thus a decrease in ATP consumption, unmasked clear increases in cytosolic [ATP]. These data suggest that the closure of KATP channels, which is well documented in both acutely isolated (Spanswick et al. 1997) and now cultured (Fig. 1A) hypothalamic neurons, is unlikely to be explained by a change in [ATP] (see also Mobbs et al. 2001). Another intriguing implication of the current work is that hypothalamic glia (and possibly glia from other brain regions) appear likely to possess substantial activities of a high Km hexokinase (presumably glucokinase; see Lynch et al. 2000) or to possess limiting levels of a high Km plasma membrane glucose transporter (presumably Glut2; see Ngarmukos et al. 2001).
Comparison of glucose sensing by hypothalamic neurons and pancreatic islet β-cells
At present there is some uncertainty in the literature regarding the concentration of glucose directly surrounding hypothalamic neurons. Direct recordings with glucose-sensitive microelectrodes indicate that, as blood glucose is altered over the range 1.6-17.1 mm, the concentration of glucose in the brain (measured in the VMH and lateral hypothalamic area) ranges between 0.2 and 4.2 mm (Silver & Erecinska, 1998). In contrast, others subscribe to the to the view that hypothalamic neurons are exposed to higher glucose concentrations than other neurons (e.g. Mobbs et al. 2001). Consequently, we examined the actions of changing glucose concentration on hypothalamic cell [ATP] over the ranges 0-3 and 3-15 mm to encompass both these views.
Regardless of the final concentration of glucose to which they were exposed (3 or 15 mm), hypothalamic neurons displayed a number of features indicating that the mechanisms of glucose sensing by these cells differs from that of islet β-cells. Firstly, VMH neurons failed to respond to increases in extracellular glucose concentration, either below or above the normal physiological range, with an increase in free intracellular [ATP]. Secondly, lactate (but not pyruvate) produced robust increases in [ATP]c (Fig. 6), and the cells expressed abundant plasma membrane lactate-monocarboxylate transporters (Fig. 8). Both of these features are in marked distinction to the islet β-cell (Zhao et al. 2001). Similarly, whereas lactate dehydrogenase (LDH) activity is very low in islet β-cells (Sekine et al. 1994; Liang et al. 1996; Schuit et al. 1997), VMH neurons apparently express adequate LDH levels to permit the robust conversion of lactate into pyruvate. Furthermore, we have demonstrated that lactate can inhibit KATP channel activity in GR neurons and therefore modulate electrical activity, as previously reported (Yang et al. 1999). Lactate has also been reported to excite solitary tract nucleus GR neurons (Himmi et al. 2001). As we have recently reported (Zhao & Rutter, 1998; Ainscow et al. 2000), the absence from β-cells of proteins to support uptake and metabolism of lactate is important for normal glucose-stimulated insulin secretion, presumably ensuring efficient transfer of glycolytically derived carbon atoms into mitochondria. By contrast, such metabolic channelling appears not to be a pre-requisite for hypothalamic neurons to respond electrically to glucose.
In further contrast to β-cells, pyruvate failed to exert any effect on [ATP]c in hypothalamic neurons, whereas lactate exerted clear effects on this parameter (Fig. 6A) as well as on the cytosolic NADH/NAD+ ratio (Fig. 6B). These data are consistent with those reported by Yang et al. (1999), who demonstrated the failure of pyruvate to stimulate firing, whereas lactate was an efficient stimulus. These data also suggest that a high activity of cytosol-to-mitochondria redox shuttles (i.e. the glycerol phosphate shunt or malate-aspartate shunt) exists in these cells, capable of oxidising cytosolic NADH generated from lactate. Indeed, the failure of pyruvate to increase [ATP] and stimulate firing, despite the abundant presence on the cell surface of lactate-monocarboxylate carriers normally able to transport this metabolite into cells (MCT1; Fig. 8), suggests that the maintenance of a sufficiently reduced cytosol is also essential for these physiological responses.
Potential role of inositol phospholipids and glucose-regulated protein kinases in coupling glucose metabolism and KATP channel activity in hypothalamic neurons
The above findings beg the question as to the nature of the mechanism(s) by which glucose is able to gate KATP channels in hypothalamic neurons. We have previously suggested that changes in intracellular inositol phospholipids, and in particular 3′-phosphorylated lipids (Shyng & Nichols, 1998), may be involved in the regulation of KATP channels by leptin in insulin-secreting cells (Harvey et al. 2000). Furthermore, both leptin (Mirshamsi & Ashford, 2001) and insulin (Spanswick et al. 2000) activate KATP channels via a PI 3-kinase-dependent mechanism. At present, no reliable measurements of glucose-induced changes in intracellular inositol phospholipids are available for hypothalamic neurons, though it is of note that glucose has little acute effect on inositol 3,4,5-trisphosphate levels in pancreatic MIN6 β-cells (G. A. Rutter, I. Rafiq & Q. Qian, unpublished observations), whereas high concentrations of insulin caused detectable increases in phosphatidyl inositol 1,4,5-trisphosphate. On the other hand, glucose is known to cause the activation of a number of protein kinases in islet β-cells including protein kinases A (PKA; Christie & Ashcroft, 1984) and C (PKC; Yedovitzky et al. 1997), whilst AMP-activated protein kinase (AMPK) activity is inhibited by high glucose concentrations in β-cells (da Silva Xavier et al. 2000). However, it is at present unclear whether phosphorylation of β-cell KATP channels by PKA or PKC can occur physiologically, nor whether this leads to changes in the activity of the channel (Ämmälä et al. 1994). At present, the impact of AMPK-mediated phosphorylation of the channel is unexplored. Further studies will be necessary to examine the role of these kinases in the responses to glucose of hypothalamic neurons.
Conclusions
We propose (Fig. 10) that the electrical activity of GR hypothalamic neurons may be regulated by glucose through two distinct mechanisms. The first of these, which we demonstrate herein, involves the closure of KATP channels by an as yet undefined mechanism which does not involve global or localised changes in cytosolic ATP concentration. The second potential mechanism involves the enhanced production of lactate by glial cells and its oxidation by neighbouring neurons. Whilst the latter mechanism was unlikely to be important in glucose sensing at the low cell densities used in the present in vitro conditions, its contribution to glucose sensing remains to be determined in the context of intact hypothalamic slices.
Figure 10. Proposed mechanisms of glucose sensing in GR hypothalamic neurons.
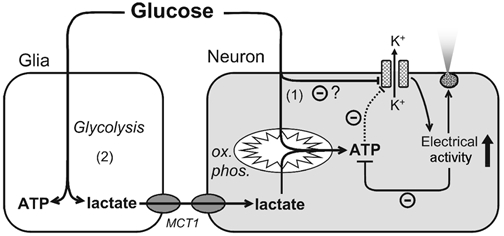
Increases in extracellular glucose concentration lead to the closure of neuronal KATP channels by a direct, but as yet undefined, mechanism (1), which does not involve increases in intracellular ATP concentration. However, mitochondrial metabolism of glucose carbons increases ATP synthesis, as revealed by the addition of ouabain to inhibit ATP consumption (Fig. 4). Anaerobic metabolism of glucose by astrocytes (2) and transfer of lactate to neighbouring neurons, may, under some circumstances, lead to enhanced ATP synthesis in the latter and thus contribute to the closure of KATP channels. ox. phos., oxidative phosphorylation.
Acknowledgments
This research was funded by project grants to G.A.R. from the Wellcome Trust (UK), the Biotechnology and Biological Sciences Research Council, the Medical Research Council (UK), the Human Frontiers Science Program and Diabetes UK. E.K.A. was the recipient of a Research Training Fellowship of the MRC (reference no. G81/431). M.L.J.A. acknowledges the support of the Wellcome Trust (reference no. 042726) and Pharmacia-Upjohn. We thank Professor Andrew Halestrap (Department of Biochemistry, University of Bristol, UK) for providing anti-MCT1 antibodies and the MRC for providing an Infrastructure Award to establish the School of Medical Sciences Cell Imaging Facility.
REFERENCES
- Ainscow EK, Rutter GA. Mitochondrial priming modifies Ca2+ oscillations and insulin secretion in pancreatic islets. Biochemical Journal. 2001;353:175–180. doi: 10.1042/0264-6021:3530175. [DOI] [PMC free article] [PubMed] [Google Scholar]
- Ainscow EK, Zhao C, Rutter GA. Acute overexpression of lactate dehydrogenase-A perturbs β-cell mitochondrial metabolism and insulin secretion. Diabetes. 2000;49:1149–1155. doi: 10.2337/diabetes.49.7.1149. [DOI] [PubMed] [Google Scholar]
- Ämmälä C, Eliasson L, Bokvist K, Berggren PO, Honkanen RE, Sjoholm A, Rorsman P. Activation of protein kinases and inhibition of protein phosphatases play a central role in the regulation of exocytosis in mouse pancreatic β cells. Proceedings of the National Academy of Sciences of the USA. 1994;91:4343–4347. doi: 10.1073/pnas.91.10.4343. [DOI] [PMC free article] [PubMed] [Google Scholar]
- Ashford ML, Boden PR, Treherne JM. Glucose-induced excitation of hypothalamic neurones is mediated by ATP-sensitive K+ channels. Pflügers Archiv. 1990;415:479–483. doi: 10.1007/BF00373626. [DOI] [PubMed] [Google Scholar]
- Bergmeyer H-U. Lactate. In: Bergmeyer H-U, editor. Methods of Enzymatic Analysis. 2. New York, London: Weinheim-Verlag Chemie, Academic Press; 1965. pp. 278–282. [Google Scholar]
- Borg WP, During MJ, Sherwin RS, Borg MA, Brines ML, Shulman GI. Ventromedial hypothalamic lesions in rats suppress counterregulatory responses to hypoglycemia. Journal of Clinical Investigation. 1994;93:1677–1682. doi: 10.1172/JCI117150. [DOI] [PMC free article] [PubMed] [Google Scholar]
- Boschero AC, Tombaccini D, Atwater I. Effects of glucose on insulin release and 86Rb permeability in cultured neonatal and adult rat islets. FEBS Letters. 1988;236:375–379. doi: 10.1016/0014-5793(88)80059-0. [DOI] [PubMed] [Google Scholar]
- Brown GC. Control of respiration and ATP synthesis in mammalian mitochondria and cells. Biochemical Journal. 1992;284:1–13. doi: 10.1042/bj2840001. [DOI] [PMC free article] [PubMed] [Google Scholar]
- Brown GC, Lakin-Thomas PL, Brand MD. Control of respiration and oxidative phosphorylation in isolated rat liver cells. European Journal of Biochemistry. 1990;192:355–362. doi: 10.1111/j.1432-1033.1990.tb19234.x. [DOI] [PubMed] [Google Scholar]
- Christie MR, Ashcroft SJH. CyclicAMP dependent protein phosphorylation and insulin secretion in intact islets of Langerhans. Biochemical Journal. 1984;218:87–99. doi: 10.1042/bj2180087. [DOI] [PMC free article] [PubMed] [Google Scholar]
- Da Silva Xavier G, Leclerc I, Salt IP, Doiron B, Hardie DG, Kahn A, Rutter GA. Role of AMP-activated protein kinase in the regulation by glucose of islet β-cell gene expression. Proceedings of the National Academy of Sciences of the USA. 2000;97:4023–4028. doi: 10.1073/pnas.97.8.4023. [DOI] [PMC free article] [PubMed] [Google Scholar]
- Grapengiesser E, Gylfe E, Hellman B. Glucose effects on cytoplasmic Ca2+ of individual pancreatic β-cells recorded by two procedures for dual-wavelength fluorometry. Experimental and Clinical Endocrinology. 1989;93:321–327. doi: 10.1055/s-0029-1210875. [DOI] [PubMed] [Google Scholar]
- Harvey J, Hardy SC, Irving AJ, Ashford MLJ. Leptin activation of ATP-sensitive K+ (K-ATP) channels in rat CRI-G1 insulinoma cells involves disruption of the actin cytoskeleton. Journal of Physiology. 2000;527:95–107. doi: 10.1111/j.1469-7793.2000.00095.x. [DOI] [PMC free article] [PubMed] [Google Scholar]
- He TC, Zhou S, Da Costa LT, Yu J, Kinzler KW, Vogelstein B. A simplified system for generating recombinant adenoviruses. Proceedings of the National Academy of Sciences of the USA. 1998;95:2509–2514. doi: 10.1073/pnas.95.5.2509. [DOI] [PMC free article] [PubMed] [Google Scholar]
- Henquin JC, Meissner HP. Significance of ionic fluxes and changes in membrane potential for stimulus-secretion coupling in pancreatic B-cells. Experientia. 1984;40:1043–1052. doi: 10.1007/BF01971450. [DOI] [PubMed] [Google Scholar]
- Himmi T, Perrin J, Dallaporta M, Orsini JC. Effects of lactate on glucose-sensing neurons in the solitary tract nucleus. Physiology and Behavior. 2001;74:391–397. doi: 10.1016/s0031-9384(01)00573-x. [DOI] [PubMed] [Google Scholar]
- Iynedjian PB. Mammalian glucokinase and its gene. Biochemical Journal. 1993;293:1–13. doi: 10.1042/bj2930001. [DOI] [PMC free article] [PubMed] [Google Scholar]
- Jetton TL, Liang Y, Pettepher CC, Zimmerman EC, Cox FG, Horvath K, Matschinsky FM, Magnuson MA. Analysis of upstream glucokinase promoter activity in transgenic mice and identification of glucokinase in rare neuroendocrine cells in the brain and gut. Journal of Biological Chemistry. 1994;269:3641–3654. [PubMed] [Google Scholar]
- Kennedy HJ, Pouli AE, Jouaville LS, Rizzuto R, Rutter GA. Glucose-induced ATP microdomains in single islet beta-cells. Journal of Biological Chemistry. 1999;274:13281–13291. doi: 10.1074/jbc.274.19.13281. [DOI] [PubMed] [Google Scholar]
- Lang JC. Molecular mechanisms and regulation of insulin exocytosis as a paradigm of endocrine secretion. European Journal of Biochemistry. 1999;259:3–17. doi: 10.1046/j.1432-1327.1999.00043.x. [DOI] [PubMed] [Google Scholar]
- Lee K, Rowe ICM, Ashford MLJ. Characterisation of an ATP-modulated large conductance Ca2+-activated K+ channel present in rat cortical neurones. Journal of Physiology. 1995;488:319–337. doi: 10.1113/jphysiol.1995.sp020969. [DOI] [PMC free article] [PubMed] [Google Scholar]
- Leibowitz SF. Feeding behavior after hypothalamic 6-hydroxydopamine injections. Appetite. 1984;5:268–271. doi: 10.1016/s0195-6663(84)80022-7. [DOI] [PubMed] [Google Scholar]
- Levin BE, Dunn-Meynell AA, Routh VH. Brain glucose sensing and body energy homeostasis: role in obesity and diabetes. American Journal of Physiology. 1999;276:R1223–1231. doi: 10.1152/ajpregu.1999.276.5.R1223. [DOI] [PubMed] [Google Scholar]
- Liang Y, Bai G, Doliba N, Buettger C, Wang L, Berner DK, Matschinsky FM. Glucose metabolism and insulin release in mouse betaHC9 cells, as model for wild-type pancreatic beta-cells. American Journal of Physiology. 1996;270:E846–857. doi: 10.1152/ajpendo.1996.270.5.E846. [DOI] [PubMed] [Google Scholar]
- Lynch RM, Tompkins LS, Brooks HL, Dunn-Meynell AA, Levin BE. Localization of glucokinase gene expression in the rat brain. Diabetes. 2000;49:693–700. doi: 10.2337/diabetes.49.5.693. [DOI] [PubMed] [Google Scholar]
- Magistretti PJ. Cellular bases of functional brain imaging: insights from neuron-glia metabolic coupling. Brain Research. 2000;886:108–112. doi: 10.1016/s0006-8993(00)02945-0. [DOI] [PubMed] [Google Scholar]
- Mirshamsi S, Ashford MLJ. PI3-kinase mediates leptin activation of KATP channels in rat acutely dispersed hypothalamic neurones. Journal of Physiology. 2001;536.P:18–19. P. [Google Scholar]
- Mobbs CV, Kow LM, Yang XJ. Brain glucose-sensing mechanisms: ubiquitous silencing by aglycemia vs. hypothalamic neuroendocrine responses. American Journal of Physiology – Endocrinology and Metabolism. 2001;281:E649–654. doi: 10.1152/ajpendo.2001.281.4.E649. [DOI] [PubMed] [Google Scholar]
- Ngarmukos C, Baur EL, Kumagai AK. Co-localization of GLUT1 and GLUT4 in the blood-brain barrier of the rat ventromedial hypothalamus. Brain Research. 2001;900:1–8. doi: 10.1016/s0006-8993(01)02184-9. [DOI] [PubMed] [Google Scholar]
- Nicholls DG. An Introduction to the Chemiosmotic Theory. 1. London: Academic Press; 1982. Bioenergetics. [Google Scholar]
- Oomura Y, Ono T, Ooyama H, Wayner MJ. Glucose and osmosensitive neurones of the rat hypothalamus. Nature. 1969;222:282–284. doi: 10.1038/222282a0. [DOI] [PubMed] [Google Scholar]
- Panten U, Christians J, Kriegstein EV, Poser W, Hasselblatt A. Effect of carbohydrates upon fluorescence of reduced pyridine nucleotides from perifused isolated pancreatic islets. Diabetologia. 1973;9:477–482. doi: 10.1007/BF00461692. [DOI] [PubMed] [Google Scholar]
- Pellerin L, Pellegri G, Bittar PG, Charnay Y, Bouras C, Martin JL, Stella N, Magistretti PJ. Evidence supporting the existence of an activity-dependent astrocyte-neuron lactate shuttle. Developmental Neuroscience. 1998;20:291–299. doi: 10.1159/000017324. [DOI] [PubMed] [Google Scholar]
- Poole RC, Sansom CE, Halestrap AP. Studies of the membrane topology of the rat erythrocyte H+/lactate cotransporter (MCT1) Biochemical Journal. 1996;320:817–824. doi: 10.1042/bj3200817. [DOI] [PMC free article] [PubMed] [Google Scholar]
- Pouli AE, Emmanouilidou E, Zhao C, Wasmeier C, Hutton JC, Rutter GA. Secretory granule dynamics visualised in vivo with a phogrin-green fluorescent protein chimaera. Biochemical Journal. 1998;333:193–199. doi: 10.1042/bj3330193. [DOI] [PMC free article] [PubMed] [Google Scholar]
- Prentki M, Tornheim K, Corkey BE. Signal transduction mechanisms in nutrient-induced insulin secretion. Diabetologia. 1997;40(suppl. 2):S32–S41. doi: 10.1007/s001250051395. [DOI] [PubMed] [Google Scholar]
- Rolfe DFS, Brand MD. Proton leak and control of oxidative phosphorylation in perfused, resting rat skeletal muscle. Biochimica et Biophysica Acta. 1996;1276:45–50. doi: 10.1016/0005-2728(96)00029-1. [DOI] [PubMed] [Google Scholar]
- Rolfe DFS, Hulbert AJ, Brand MD. Characteristics of mitochondrial proton leak and control of oxidative phosphorylation in the major oxygen-consuming tissues of the rat. Biochimica et Biophysica Acta. 1994;1188:405–416. doi: 10.1016/0005-2728(94)90062-0. [DOI] [PubMed] [Google Scholar]
- Rorsman P, Eliasson L, Renstrom E, Gromada J, Barg S, Gopel S. The cell physiology of biphasic insulin secretion. News in Physiological Sciences. 2000;15:72–77. doi: 10.1152/physiologyonline.2000.15.2.72. [DOI] [PubMed] [Google Scholar]
- Rutter GA. Nutrient-secretion coupling in the pancreatic islet β-cell: Recent advances. Molecular Aspects of Medicine. 2001;22:247–284. doi: 10.1016/s0098-2997(01)00013-9. [DOI] [PubMed] [Google Scholar]
- Safayhi H, Haase H, Kramer U, Bihlmayer A, Roenfeldt M, Ammon HP, Froschmayr M, Cassidy TN, Morano I, Ahlijanian MK, Striessnig J. L-type calcium channels in insulin-secreting cells: biochemical characterization and phosphorylation in RINm5F cells. Molecular Endocrinology. 1997;11:619–629. doi: 10.1210/mend.11.5.9922. [DOI] [PubMed] [Google Scholar]
- Schuit F, De Vos A, Farfari S, Moens K, Pipeleers D, Brun T, Prentki M. Metabolic fate of glucose in purified islet cells. Glucose-regulated anaplerosis in beta cells. Journal of Biological Chemistry. 1997;272:18572–18579. doi: 10.1074/jbc.272.30.18572. [DOI] [PubMed] [Google Scholar]
- Sekine N, Cirulli V, Regazzi R, Brown LJ, Gine E, Tamarit-Rodriguez J, Girotti M, Marie S, Macdonald MJ, Wollheim CB, Rutter GA. Low lactate dehydrogenase and high mitochondrial glycerol phosphate dehydrogenase in pancreatic β-cell. Potential role in nutrient sensing. Journal of Biological Chemistry. 1994;269:4895–4902. [PubMed] [Google Scholar]
- Shyng SL, Nichols CG. Membrane phospholipid control of nucleotide sensitivity of KATP channels. Science. 1998;282:1138–1141. doi: 10.1126/science.282.5391.1138. [DOI] [PubMed] [Google Scholar]
- Silver IA, Erecinska M. Glucose-induced intracellular ion changes in sugar-sensitive hypothalamic neurons. Journal of Neurophysiology. 1998;79:1733–1745. doi: 10.1152/jn.1998.79.4.1733. [DOI] [PubMed] [Google Scholar]
- Spanswick D, Smith MA, Groppi VE, Logan SD, Ashford MJ. Leptin inhibits hypothalamic neurons by activation of ATP-sensitive potassium channels. Nature. 1997;390:521–525. doi: 10.1038/37379. [DOI] [PubMed] [Google Scholar]
- Spanswick D, Smith MA, Mirshamsi S, Routh VH, Ashford ML. Insulin activates ATP-sensitive K+ channels in hypothalamic neurons of lean, but not obese rats. Nature Neuroscience. 2000;3:757–758. doi: 10.1038/77660. [DOI] [PubMed] [Google Scholar]
- Theler J-M, Mollard P, Guérineau N, Vacher P, Pralong W-F, Schlegel W, Wollheim CB. Video Imaging of cytosolic Ca2+ in pancreatic β-cells stimulated by glucose, carbachol, and ATP. Journal of Biological Chemistry. 1992;267:18110–18117. [PubMed] [Google Scholar]
- Yang XJ, Kow LM, Funabashi T, Mobbs CV. Hypothalamic glucose sensor – Similarities to and differences from pancreatic beta-cell mechanisms. Diabetes. 1999;48:1763–1772. doi: 10.2337/diabetes.48.9.1763. [DOI] [PubMed] [Google Scholar]
- Yedovitzky M, Mochlyrosen D, Johnson JA, Gray MO, Ron D, Abramovitch E, Cerasi E, Nesher R. Translocation inhibitors define specificity of protein kinase C isoenzymes in pancreatic beta-cells. Journal of Biological Chemistry. 1997;272:1417–1420. doi: 10.1074/jbc.272.3.1417. [DOI] [PubMed] [Google Scholar]
- Zhang Y, Proenca R, Maffei M, Barone M, Leopold L, Friedman JM. Positional cloning of the mouse obese gene and its human homologue. Nature. 1994;372:425–432. doi: 10.1038/372425a0. [DOI] [PubMed] [Google Scholar]
- Zhao C, Rutter GA. Overexpression of lactate dehydrogenase A attenuates glucose-induced insulin secretion in stable MIN-6 beta-cell lines. FEBS Letters. 1998;430:213–216. doi: 10.1016/s0014-5793(98)00600-0. [DOI] [PubMed] [Google Scholar]
- Zhao C, Wilson CM, Schuit F, Halestrap AP, Rutter GA. Expression and distribution of lactate/monocarboxylate transporter (MCT) isoforms in pancreatic islets and the exocrine pancreas. Diabetes. 2001;50:361–366. doi: 10.2337/diabetes.50.2.361. [DOI] [PubMed] [Google Scholar]


