

Abstract
All medullary central chemoreceptor sites contain neurokinin-1 receptor immunoreactivity (NK1R-ir). We ask if NK1R-ir neurons and processes are involved in chemoreception. At one site, the retrotrapezoid nucleus/parapyramidal region (RTN/Ppy), we injected a substance P–saporin conjugate (SP-SAP; 0.1 pmol in 100 nl) to kill NK1R-ir neurons specifically, or SAP alone as a control. We made measurements for 15 days after the injections in two groups of rats. In group 1, with unilateral injections made in the awake state via a pre-implanted guide cannula, we compared responses within rats using initial baseline data. In group 2, with bilateral injections made under anaesthesia at surgery, we compared responses between SP-SAP- and SAP-treated rats. SP-SAP treatment reduced the volume of the RTN/Ppy region that contained NK1R-ir neuronal somata and processes by 44 % (group 1) and by 47 and 40 % on each side, respectively (group 2). Ventilation ( ) and tidal volume (VT) were decreased during air breathing in sleep and wakefulness (group 2; P < 0.001; two-way ANOVA) and Pa,CO2 was increased (group 2; P < 0.05; Student's t test). When rats breathed an air mixture containing 7 % CO2 during sleep and wakefulness, and VT were lower (groups 1 and 2; P < 0.001; ANOVA) and the Δ in air containing 7 % CO2 compared to air was decreased by 28-30 % (group 1) and 17-22 % (group 2). SP-SAP-treated rats also slept less during air breathing. We conclude that neurons with NK1R-ir somata or processes in the RTN/Ppy region are either chemosensitive or they modulate chemosensitivity. They also provide a tonic drive to breathe and may affect arousal.
Central chemoreceptors that detect increases in CO2 or H+ and stimulate breathing are widely distributed within the brainstem (Loeschcke, 1982; Coates et al. 1993; Nattie, 1998, 1999, 2000; Li et al. 1999; Solomon et al. 2000; Ballantyne & Scheid, 2001; Nattie & Li, 2001, 2002; Richerson et al. 2001). Chemoreceptor sites have been identified, using in vitro and in vivo approaches, in the regions of: (1) the nucleus tractus solitarius (NTS); (2) the locus ceruleus; (3) the midline medullary raphé; (4) the rostral aspect of the ventral respiratory group; (5) the fastigial nucleus of the cerebellum; and (6) the contiguous regions lying just beneath the ventral medullary surface in the retrotrapezoid nucleus (RTN) and the parapyramidal (Ppy) region as well as more caudally.
Why are there so many central chemoreceptor sites? Our work has focused on an in vivo model in which we produce a focal region of acidosis in the brainstem of an unanaesthetized rat by microdialysis of a CO2-rich artificial cerebrospinal fluid (aCSF). An increase in breathing that accompanies this focal stimulation indicates the presence of chemoreception at that site. So far we have identified chemoreceptor responses specific to wakefulness at the RTN region (Li et al. 1999), specific to NREM sleep at the medullary raphé (Nattie & Li, 2001), and present in both wakefulness and sleep in the caudal NTS (Nattie & Li, 2002). These stimulation studies indicate that different sites involved in chemoreception may have different physiological roles dependent on the state of arousal (Nattie, 1998, 1999, 2000, 2001).
An alternative approach in the study of central chemoreception in vivo is that of focal inhibition or destruction of neurons. Previous attempts at chemoreceptor disruption have included cooling, neurotoxin-induced lesions and muscimol inhibition (Berger & Cooney, 1982; Loeschcke, 1982; Budzinska et al. 1985; Akilesh et al. 1997; Forster et al. 1997; Nattie & Li, 2000). These have been nonspecific with respect to the cell type affected and, for the most part, the anatomical delineation of the affected region has been imprecise. Admittedly, attempts at cell-specific disruption in the study of central chemoreception have been hampered by a lack of information on the cellular nature of the process.
We noted that the overall distribution of NK1R-ir in the rat brainstem (Nakaya et al. 1994) displays some similarity with the distribution of central chemoreceptor sites (Nattie, 2000, 2001). This suggested to us that NK1Rs might be a useful marker for neurons important in chemoreception. The availability of cell-specific toxins for neurons with NK1Rs made this suggestion of practical utility (Wiley & Lappi, 1997). In this paper we test the hypothesis that neurons with NK1Rs located within the RTN/Ppy region of the rostral medulla are involved in central chemoreception. We inject within this region the ribosomal toxin saporin (SAP) conjugated to the natural ligand for the NK1R, substance P (SP; Wiley & Lappi, 1997) and measure breathing in air and in an air mixture containing 7 % CO2 during both wakefulness and sleep in unanaesthetized rats over the subsequent 15 days. This SP-SAP conjugate has proven useful in examination of the role of spinal cord neurons in the response to noxious stimuli (Mantyh et al. 1997) and of pre-Bötzinger complex (PBC) neurons in the generation of normal breathing in rats (Gray et al. 1999, 2001; Wang et al. 2002).
METHODS
General
All procedures were carried out within the guidelines of the National Institutes of Health for animal use and care and were approved by the Dartmouth College Institutional Animal Use and Care Committee. Forty male Sprague-Dawley rats (300-450 g) were anaesthetized with ketamine (100 mg kg−1, i.m.) and xylazine (20 mg kg−1, i.p.). Hindlimb withdrawal and corneal reflexes were tested to monitor the depth of anaesthesia and when necessary supplemental doses of anaesthetic (1/4 the initial dose) were administered. The skull was shaved and the skin sterilized with betadine and alcohol. The head was placed into a Kopf stereotaxic holder and a dialysis guide canulla (o.d. 0.38 mm) with a dummy insert (CMA 11/Acton, MA, USA) or a 28 gauge needle placed into the medulla. The coordinates for placement were 2.2 mm caudal from lambda, 1.8 mm lateral from the midline and 10.6-10.8 mm below the dorsal surface of the skull with the bite bar at 9.5-10.1 mm so that the top of the skull was level (Paxinos & Watson, 1982). In group 1, the guide canulla was secured with cranioplastic cement and remained in place for the duration of the experiment. In group 2, the SP-SAP or SAP injections were made bilaterally via a 28 gauge needle and 0.5 μl Hamilton syringe. The needles were removed after the injections. In both groups, EEG electrodes were screwed into the right side of the skull 2 mm anterior to bregma and 2 mm lateral to the midline and an earth lead placed between the two. For the EMG, a pair of wire electrodes was inserted deep into the neck muscle. The skull wound was sutured. A sterile telemetry temperature probe (TA-F20, Data Sciences, St Paul, MN, USA) was placed in the abdominal cavity. During recovery from surgery, rats were monitored and any showing abnormal posture, limb weakness or spinning behaviour were killed by injection of >200 mg kg−1 pentabarbitone i.p.
Protocol
The rats were housed in a room with a light, rest period from 12 am to 12 pm and a dark, active period from 12 pm to 12 am. Food and water were available ad libitum. Rats were closely monitored and any showing signs of infection, fever or failure to gain weight were killed by injection of >200 mg kg−1 pentabarbitone i.p. All the experiments were performed between 9 am and 4 pm. Group 1 consisted of rats with unilateral injections of SP-SAP (N = 5) or of SAP alone (N = 5). After 4-5 days recovery from unilateral guide cannula implantation, baseline ventilation (), tidal volume (VT) and frequency (f) were measured in each rat while breathing air or air containing 7 % CO2 during sleep and wakefulness. Then, we injected SAP or SP-SAP (Advanced Targeting Systems; 0.1 pmol in 100 nl; 1 μM) and repeated the measurements on days 1-3, 4-7, 8-11 and 12-15. Group 2 consisted of rats with bilateral injections of SP-SAP (N = 5) or of SAP alone (N = 5) made at the time of surgery. The injection needles were then removed. Comparisons of effects were between the SAP- and the SP-SAP-injected groups on days 1-3, 4-7, 8-11 and 12-15. Oxygen consumption and body temperature were also measured in each rat during each experiment. In all rats included in this report the injections were localized to the RTN/Ppy region as shown by histological analysis performed after day 15. Our overall success rate for guide cannula placement or injection in the correct location is close to 100 % and for healthy rat survival is approximately 67 %. At days 12-13 a catheter (Micro-Renathane MRE- = 033) was placed into the femoral artery under ketamine- xylazine anaesthesia in rats of the group 2, bilateral protocol. The distal end was tunnelled out through the back of the neck. Following arterial catheter implantation, rats were monitored and any showing signs of infection or leg ischaemia were killed by injection of >200 mg kg−1 pentabarbitone i.p. Blood was sampled for blood gas analysis on day 15.
Data analysis
We sampled the EEG (filtered at 0.3-50 Hz) and EMG (filtered at 0.1-100 Hz) electrode signals directly to computer at 150 Hz using the DataPac 2000 system. We determined sleep and wakefulness using these signals, the fast Fourier transform of the EEG signal analysed in 3.6 s epochs at delta (0.3-5 Hz), theta (6-9 Hz) and sigma (10-17 Hz) frequency bands, and behavioural observations. The state of arousal was defined using criteria modified from those of Trachsel et al. (1988) and Bennington et al. (1994) as described previously (Nattie & Li, 2001, 2002). Our awake state is one of quiet wakefulness; in active wakefulness the activity of the rat in the plethysmograph prevents reliable measurement of breathing. We analysed the amount of time the rat spent in NREM sleep and in wakefulness during each experiment. For the purpose of this study we ignored REM periods, which in our protocol were brief and variable among rats.
We measured ventilation using flow-through whole-body plethysmography as described by Pappenheimer (1977) and Jacky (1978). We sampled the output of the pressure transducer at 150 Hz directly to computer (DataPac 2000 system). The inflow gas for the plethysmograph chamber was humidified and controlled by a flowmeter at 1.4 l min−1 to prevent rebreathing of exhaled gas (Matheson, model 7491T). The outflow was matched to the inflow via a flowmeter connected to a vacuum system. Approximately 100 ml min−1 of outflow gas served O2 and CO2 analysers (Applied Electrochemistry). The plethysmograph was calibrated with multiple 0.3 ml injections. We measured chamber temperature by thermometer and rat body temperature by telemetry. For calculation of ventilatory data, we used the DataPac 2000 system to determine the pressure deflections and the respiratory cycle time for each of 100-300 breaths during defined sleep and wake periods while breathing air or air containing 7 % CO2. Sighs, sniffing and recording artefacts were edited from analysis. These data were exported to Sigmaplot 4.0 (Jandel Scientific software) with VT and per 100 g body weight and f calculated for each breath using plethysmograph and body temperatures for that time period. We obtained two to four measurement periods for NREM sleep and wakefulness as a baseline before exposure to 7 % CO2 and one or two periods during the 30 min of CO2 exposure. We present the data as mean ± s.e.m. absolute values for , VT and f while breathing air or air containing 7 % CO2. In group 1, we compare , VT and f while breathing air or air containing 7 % CO2 during NREM sleep or wakefulness for SP-SAP and SAP treatment on days 1-3, 4-7, 8-11 and 12-15 to the baseline data for that treatment in each rat (one-way repeated measures ANOVA). In group 2, we compare , VT and f while breathing air or 7 % CO2 in NREM sleep and wakefulness on days 1-3, 4-7, 8-11 and 12-15 between the SP-SAP and SAP treatments (two-way ANOVA with treatment and time as factors). In both groups we defined a ‘CO2 response’ as the change in (Δ), which is the value while breathing air containing 7 % CO2 minus that while breathing air. In group 1, Δ values for all measurement days are compared to Δ values in the baseline period (one-way repeated measures ANOVA); in group 2, Δ values are compared for all measurement days between SP-SAP and SAP treatments (two-way ANOVA with treatment and time as factors).
Oxygen consumption ( ) was calculated using the Fick principle using the difference in O2 content between inspired and expired gas and the flow rate through the plethysmograph and normalized to millilitres per gram body weight per hour. The inflow O2 content was measured at the beginning of each experiment and the outflow content of O2 was measured continuously during the experiment. We monitored CO2 content of the outflow gas continuously to ensure that no build-up of CO2 took place within the chamber. On day 15 in the group 2, bilateral experiments, 150 μl of arterial blood was removed while breathing air and air containing 7 % CO2 during sleep and wakefulness. Arterial partial pressures of CO2 and O2 (Pa,CO2, Pa,O2) and arterial pH were measured on an AVL 995 automatic blood gas system. Values were corrected to rat body temperature. Bicarbonate was calculated from corrected pH and Pa,CO2 using appropriate values for pK′ and solubility.
Normalization, body weight and oxygen consumption
In the unilateral lesion experiment (group 1), both SP-SAP and SAP-treated rats continued to gain body weight during the protocol. The initial and final mean (± s.e.m.) body weights were 361 ±13 and 408 ± 7 g for the SAP injection control group and 342 ± 16 and 395 ± 18 g for the SP-SAP lesion group. In the bilateral lesion group (group 2), the initial and final mean (± s.e.m.) body weights were similar. We normalized our ventilatory and oxygen consumption data using body weight values. In cross-specific and intra-specific comparisons over larger changes in body weight, ventilation and oxygen consumption do not increase in proportion to body weight (Mortola, 2001). However, over the small increase in body weight observed in our 15 day protocol there was no detectable difference in results if ventilation was normalized by body weight or oxygen consumption. expressed as ml O2 per 100 g body weight per hour was unchanged during this 15 day period in either the SP-SAP or the SAP alone groups. In the unilateral group, mean (± s.e.m.) initial and final values for were 0.99 ± 0.03 and 0.97 ± 0.04 ml (100 g)−1 h−1 for the SP-SAP-treated rats and 0.98 ± 0.01 and 0.98 ± 0.02 ml (100 g)−1 h−1 for the SAP-treated rats. Similar values were obtained in the bilateral lesion groups.
Anatomy
At the end of the experiment, the rats were re-anaesthetized with ketamine and xylazine, then transcardially perfused with 200 ml saline followed by 300-500 ml of chilled 4 % paraformaldehyde (4 % in 0.1 m phosphate buffer (PB), pH 7.4). The brain was removed and postfixed overnight in 4 % paraformaldehyde at 4 °C, then cryoprotected for 48 h in 30 % sucrose. The brains were sectioned at 50 μm thickness on a Reichert-Jung cryostat with each section placed into a small Plexiglass well. The immunohistochemical procedures were performed with free-floating sections at room temperature unless otherwise noted. The sections were washed three times for 15 min in 0.1 m PB and quenched for 30 min in 3 % H2O2 and 0.5 % Triton X-100, then preincubated with 10 % normal goat serum (NGS) and 0.5 % Triton X-100 PB. The sections were incubated with a rabbit polyclonal antibody against NK1R for 48 h at 4 °C (1:10 000 with 10 % NGS and 0.1 % Triton X-100; ATS, San Diego, CA, USA) followed by a biotinylated goat anti-rabbit IgG overnight at 4 °C (1:500, Vector Laboratories, Burlingame, CA, USA). An avidin-biotin-horseradish peroxidase procedure with diaminobenzidine was used to visualize NK1R staining. All the sections were mounted and dehydrated with graded alcohol (25-100 % EtOH), cleared with xylene and coverslipped. In five rats, sections were also stained for immunoreactivity for tryptophan hydroxylase (TPOH) to identify serotonergic neurons. The procedure for TPOH staining in general is similar to that for NK1R, except we used 0.1 m Tris-buffer saline (TBS) instead of PB, the antibody was a mouse monoclonal against TPOH and the sections were 30 μm thick.
To estimate the amount of disruption of NK1R-ir neurons and their processes caused by our SP-SAP or SAP injections we examined the RTN/Ppy area in every other 50 μm section from 300 μm rostral to 200 μm caudal to the facial nucleus for a total of 19 sections. The staining pattern contains extensive neuronal processes as well as scattered neuronal somata (see Fig. 1). The major portion of our RTN/Ppy area of interest is shown by a series of partial cross sections in Fig. 2 and by rostrocaudal extent in Fig. 4. For the group 1 unilateral experiments, on sections from both the injected and noninjected side we outlined by a computer-assisted process (ImagePro) the RTN/Ppy area of interest that contained neurons and processes with NK1R-ir (see Fig. 2A-D and Fig. 3A and B). On the injected side, areas with absent or disrupted NK1R-ir were not included (see Fig. 3C and D). These area data are shown in Fig. 4. We then summed these areas over 13-15 sections covering the lesioned region to measure the RTN/Ppy volume that contained normal NK1R-ir for both the lesioned and unlesioned sides. We report these volumes in microlitres and express the difference in these volumes for each rat as the percentage decrease in RTN/Ppy NK1R-ir. We also counted neuronal somata that expressed NK1R-ir on each side. For the bilateral injection experiments, we measured the same area of interest and counted cells on both sides and compared results in SP-SAP-treated rats with those that received SAP alone. For evaluation of specificity we counted TPOH-ir neurons in areas lesioned by SP-SAP as shown by loss of NK1R-ir on adjacent 30 μm sections.
Figure 1. Illustration of NK1R-ir in a cross-section of the medulla just caudal to the facial nucleus.

A is a low power view with letters B, C and D representing sites magnified in B, C and D. Note extensive labelling of neuronal processes, reticular staining pattern and the small number of neuronal somata. Scale bar in B applies to C and D.
Figure 2. Illustration of RTN/Ppy region of interest.

A-D show NK1R-ir in 4 partial cross-sections at rostrocaudal levels marked in millimetres caudal to bregma at lower right. The dotted line in each section outlines our area of interest. Abbreviations: P, pyramid; VII, facial nucleus; Amb, nucleus ambiguus.
Figure 4. Rostrocaudal extent of lesions.

Mean ± s.e.m. (N = 5) values of the area of NK1R-ir in our RTN/Ppy area of interest for every other 50 μm section from 10 to 11.8 mm caudal to bregma in unilateral (group 1; A) and bilateral (group 2; B) experiments. The line marked VII in B shows the rostrocaudal position of the facial nucleus (Paxinos & Watson, 1982). Asterisks shows significance (two-way ANOVA, P < 0.001; Student-Newman-Keuls post hoc test; P < 0.05). In A, results from control uninjected sides are pooled and in B, results from the two sides are averaged to facilitate comparisons.
Figure 3. Illustration of SP-SAP injection effects on NK1R-ir.

Two cross-sections of the medulla are shown at the level of the rostral (A) and mid-facial (B) nucleus taken from control rats. C and D represent cross-sections at the same levels taken from rats with SP-SAP lesions. The area outlined by the dotted line in A and B defines in each section our RTN/Ppy area of interest exhibiting NK1R-ir. This area is much smaller in C and D as a result of the SP-SAP lesion. Scale bar is 1 mm and applies to all panels.
RESULTS
Anatomy
The nature of the NK1R-ir staining pattern in the RTN/Ppy region of interest is shown in Fig. 1. This section is taken just caudal to the facial nucleus. The three higher power views (Fig. 1B-D) show that the distribution of NK1R-ir in this region is predominantly on neuronal processes, which form a complex reticular-like pattern. There are some prominent neuronal somata that exhibit NK1R-ir but these are largely in the midline and Ppy region (Fig. 1D) and are more frequently observed in the more caudal sections. There are occasional moderately sized NK1R-ir somata in the RTN region (see Fig. 1B and C for examples). Small neurons just beneath the ventral medullary surface are also visible in Fig. 1 but were not visible in every rat.
Each injection of SP-SAP or SAP in all rats of both groups included the confines of the RTN/Ppy region as outlined in Fig. 2. Figure 3C and D shows two examples of lesions that can be compared to control sections at the same rostrocaudal level (Fig. 3A and B). Note the reduced NK1R-ir in Fig. 3C and D compared to Fig. 3A and B. Figure 4 shows the mean (± s.e.m.) areas of NK1R-ir in our region of interest on every other 50 μm section from 10 to 11.7 mm caudal to bregma. Group 1 (unilateral) injection results (Fig. 4A) show a significant effect of SP-SAP treatment (two-way ANOVA with treatment and sites as factors; P < 0.001 compared to uninjected controls) with significant post hoc comparisons (P < 0.05; Student-Newman-Keuls post hoc test) marked by asterisks. Comparison of SAP injection responses to uninjected controls did not show significance. Group 2 (bilateral) injection results (Fig. 4B) show a significant effect of SP-SAP treatment (two-way ANOVA with treatment and sites as factors; P < 0.001 compared to SAP-injected controls) with significant post hoc comparisons (P < 0.05; Student-Newman-Keuls post hoc test) marked by asterisks. In group 1, with unilateral injections, the measured RTN/Ppy tissue volume (we used 13-15 of the 19 total sections shown on Fig. 4 to calculate volume) that contained NK1R-ir on the control side was 0.88 ± 0.04 μl (n.s.; Student's paired t test). Counts of mid- to large-sized neurons in the RTN/Ppy region were 35 ± 9 in the control side and 35 ± 9 in the injected side. In the rats treated with unilateral SP-SAP injection, the measured RTN/Ppy tissue volume that contained NK1R-ir on the control side was 0.95 ± 0.04 μl; on the treated side it was 0.53 ± 0.07 μl (P < 0.01; Student's paired t test). The mean paired difference between control and SP-SAP-treated sides was −44 ± 7 %. Counts of mid- to large-sized neurons were 40 ± 6 cells in the control side and 24 ± 4 cells in the SP-SAP-treated side (P < 0.05; Student's paired t test), −36 ± 9 %. In group 2 with bilateral injections, after SAP treatment the RTN/Ppy volume that contained NK1R-ir was 0.73 ± 0.03 and 0.68 ± 0.03 μl on the two sides and cell counts were 28 ± 4 and 34 ± 4, respectively. After SP-SAP treatment, the RTN/Ppy volume was 0.39 ± 0.05 and 0.41 ± 0.06 μl (P < 0.05; Student's unpaired t test) and the cell counts were 18 ± 4 and 14 ± 3 on the two sides (P < 0.05; Student's unpaired t test). The lesions decreased the volume of NK1R-ir in the RTN/Ppy region by −47 and −44 % and the cell counts by −36 and −59 % on each side, respectively.
To evaluate specificity, we determined whether SP-SAP-induced lesions affected the number of TPOH-ir cells in our RTN/Ppy area of interest. In all five rats, TPOH-ir cells were present at the area of decreased NK1R-ir. Figure 5 shows one example. Counts of TPOH-ir neurons were 59 ± 9 in the lesioned side vs. 60 ± 10 in the uninjected control side (N = 5 rats; 16-18 sections counted per rat).
Figure 5. Specificity of SP-SAP lesions.

NK1R-ir (A) and TPOH-ir (B) of adjacent sections taken from a rat injected with SP-SAP. Note loss of NK1R-ir in area of A outlined by dotted line. The same area in B shows TPOH-ir cells. Abbreviations as above.
Unilateral lesion effects on ventilation
In group 1 during air breathing, injection of SAP alone into the RTN/Ppy region had no significant effect on , VT or f in wakefulness or in NREM sleep (one-way repeated measures ANOVA; Fig. 6). After unilateral lesion with SP-SAP, there was no statistically significant effect on , VT or f in either sleep of wakefulness (one-way repeated measures ANOVA; Fig. 7). We note, however, that in four out of five rats, during air breathing at rest did decrease by an average of 10 ± 4 % during wakefulness and 12 ± 3 % during NREM sleep when values at day 12-15 were compared with the initial control values.
Figure 6. Effects of unilateral (group 1) control injections of SAP alone on , VT and f.

•, data obtained during wakefulness; ○, data obtained during NREM sleep. Air-breathing data are at the bottom of each panel; 7 % CO2 data at the top. Mean ± s.e.m. values are shown.
Figure 7. Effects of unilateral (group 1) injections of SP-SAP on , VT and f.

•, data obtained during wakefulness; ○, data obtained during NREM sleep. Air-breathing data are at the bottom of each panel; 7 % CO2 data at the top. Mean ± s.e.m. values are shown. Asterisks mark significance compared to initial baseline (P < 0.001, one-way repeated measures ANOVA; P < 0.05, Tukey's post hoc test).
In group 1, when rats breathed air containing 7 % CO2, injection of SAP alone into the RTN/Ppy region had no significant effect on , VT or f in wakefulness or in NREM sleep (one-way repeated measures ANOVA; Fig. 6). After unilateral lesion with SP-SAP, the measured when rats breathed air containing 7 % CO2 was significantly decreased during sleep and wakefulness compared to baseline values (P < 0.001, repeated measures one-way ANOVA; Fig. 7). Post hoc analysis showed a significant effect (P < 0.05; Tukey's post hoc test) during sleep at days 4-7, 8-11 and 12-15 and during wakefulness at days 1-3, 4-7, 8-11 and 12-15 compared with day 0 baseline values. This effect was entirely due to a decrease in VT in wakefulness and sleep (P < 0.002; repeated measures one-way ANOVA). Post hoc analysis showed a significant effect on VT (P < 0.05; Tukey's post hoc test) during sleep and wakefulness at days 4-7, 8-11 and 12-15 compared with day 0 control values. The ‘CO2 response’, i.e. the Δ when breathing air containing 7 % CO2vs. breathing air, for the unilateral lesion experiment is shown in Fig. 8. Following injection of SP-SAP (Fig. 8A) the CO2 response was significantly decreased during wakefulness (P < 0.001; one-way repeated measures ANOVA) with values at days 1-3, 4-7, 8-11 and 12-15 being significantly less than control values (P < 0.05; Tukey's post hoc test). In sleep the CO2 response was likewise decreased significantly (P < 0.001; one-way repeated measures ANOVA) with values at days 1-3, 4-7, 8-11 and 12-15 being significantly less than control values (P < 0.05; Tukey's post hoc test). After injection of SAP alone (Fig. 8B) there was no significant effect on the CO2 response during wakefulness (one-way repeated measures ANOVA). In sleep there was a significant treatment effect (P < 0.05; one-way repeated measures ANOVA) but this was not significant in the post hoc analysis (Tukey's post hoc test). In this unilateral lesion protocol each rat served as its own control. We can estimate the degree of the decrease in CO2 response by comparing the Δ on each post-lesion test day to the baseline value. The maximum effect during wakefulness was −28 ± 7 % at 8-11 days and during sleep was −30 ± 4 % at 4-7 days.
Figure 8. Effects of unilateral (group 1) injections of SP-SAP or SAP on the CO2 response in sleep and wakefulness.

The ‘CO2 response’ expressed as the Δ comparing 7 % CO2 to air for unilateral (group 1) SP-SAP (top) and SAP control (bottom) during NREM sleep (○) and wakefulness (•). Data are means ± s.e.m. Asterisks mark significance compared to initial baseline (P < 0.001, one-way repeated measures ANOVA; P < 0.05, Tukey's post hoc test).
Bilateral lesion effects on ventilation
In group 2 during air breathing, was significantly lower in the SP-SAP lesion group compared to the SAP injection control group in wakefulness (Fig. 9) and sleep (Fig. 10; P < 0.001; two-way ANOVA with treatment and time as factors). The statistical analysis did not allow separation of this effect into different time periods, although by inspection decreases with time in the SP-SAP group. The effect is entirely due to a lower VT in the SP-SAP group compared to the SAP group (P < 0.001; two-way ANOVA with treatment and time as factors).
Figure 9. Effects of bilateral (group 2) injections of SP-SAP or SAP on , Vt and f in wakefulness.

Effects during wakefulness of bilateral (group 2) injections of SAP alone (control; ○) and of SP-SAP (•) on , VT and f. Air-breathing data are at the bottom of each panel; 7 % CO2 data at the top. Mean ± s.e.m. values are shown. Asterisks mark significant differences between SAP and SP-SAP groups (P < 0.001, two-way ANOVA with treatment and time as factors).
Figure 10. Effects of bilateral (group 2) injections of SP-SAP or SAP on , Vt and f in sleep.

Effects in NREM sleep of bilateral (group 2) injections of SAP alone (control; ○) and of SP-SAP (•) on , VT and f. Air-breathing data are at the bottom of each panel; 7 % CO2 data at the top. Mean ± s.e.m. values are shown. Asterisks mark significant differences between SAP and SP-SAP groups (P < 0.001, two-way ANOVA with treatment and time as factors).
Arterial blood gas and pH analyses support the observation that hypoventilation is present during air breathing in wakefulness after bilateral SP-SAP lesions of the RTN/Ppy region. Pa,CO2 during air breathing in wakefulness was significantly higher 15 days after SP-SAP treatment, 38 ± 1 Torr, compared to the SAP-injected controls, 34 ± 1 Torr (P < 0.03, Student's unpaired t test; Table 1). This difference did not persist during sleep. The Pa,CO2 values during 7 % CO2 breathing were not different in wakefulness, but in sleep the value in the SP-SAP-treated rats was significantly higher, 57 ± 2 Torr, compared to that in the SAP control rats, 53 ± 1 Torr (P < 0.03, unpaired t test; Table 1).
Table 1.
Arterial blood gas and acid–base data during wakefulness or sleep while breathing air or air containing 7% CO2 in bilateral SAP-injected (control) and SP-SAP-injected (lesion) animals (group 2)
| pH | Pa,CO2 (Torr) | HCO3- (mM) | Pa,O2 (Torr) | |
|---|---|---|---|---|
| Awake | ||||
| SAP | ||||
| Air | 7.433 (0.007) | 34 (0.8) | 22.0 (0.6) | 87 (3) |
| 7% CO2 | 7.321 (0.006) | 53 (1.2) | 26.2 (0.7) | 122 (1) |
| SP-SAP | ||||
| Air | 7.435 (0.007) | 38 (1.1)* | 24.1 (0.6) | 86 (2) |
| 7% CO2 | 7.320 (0.005) | 54 (2.1) | 26.8 (1.1) | 121 (2) |
| NREM sleep | ||||
| SAP | ||||
| Air | 7.429 (0.010) | 36 (1.1) | 22.7 (0.7) | 86 (2) |
| 7% CO2 | 7.320 (0.012) | 53 (0.7) | 26.0 (1.0) | 119 (2) |
| SP-SAP | ||||
| Air | 7.441 (0.006) | 38 (0.8) | 24.6 (0.7) | 83 (2) |
| 7% CO2 | 7.318 (0.009) | 57 (1.6)* | 27.9 (0.9) | 122 (3) |
Mean (±s.e.m.) values are shown. N = 5.
P < 0.05, Student's unpaired t test, SAP vs. SP-SAP.
In group 2 animals breathing air containing 7 % CO2, was significantly lower in the SP-SAP lesion group compared to the SAP injection control group during wakefulness (Fig. 9) and sleep (Fig. 10; P < 0.001; two-way ANOVA with treatment and time as factors). The effect is entirely due to a lower VT (P < 0.001; two-way ANOVA with treatment and time as factors). The ‘CO2 response’ Δ values for the bilateral lesion experiment are shown in Fig. 11. In the design of the bilateral experiment we compare the Δ at each post-lesion day between the SAP control and the SP-SAP lesion animals. The CO2 response is significantly less in the SP-SAP group than in the SAP control in wakefulness (Fig. 11A; P < 0.002; two-way ANOVA with treatment and time as factors) and in sleep (Fig. 11B; P < 0.001; two-way ANOVA with treatment and time as factors). As in the unilateral lesion protocol, we can estimate the degree of the decrease in CO2 response by comparing the Δ, here at each post-lesion test day, between the SAP-treated control and the SP-SAP-treated rats. The maximum effect during wakefulness was −17 % at 8-11 days and during sleep was −22 % at 4-7 days.
Figure 11. Effects of bilateral (group 2) injections of SP-SAP or SAP on the CO2 response in wakefulness and sleep.
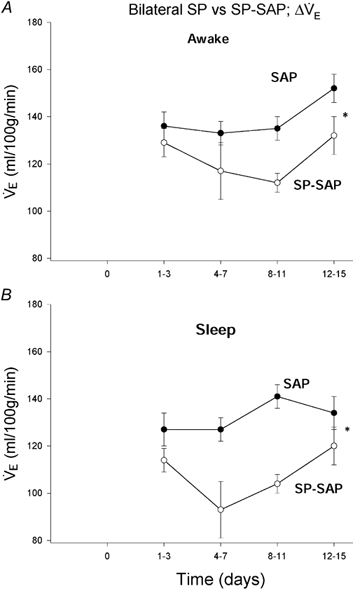
The ‘CO2 response’ expressed as the Δ comparing 7 % CO2 to air for bilateral (group 2) SP-SAP (○) and SAP control (•) during wakefulness (top) and during NREM sleep (bottom). Data are means ± s.e.m. Asterisks mark significance of SAP compared to SP-SAP (P < 0.002 in wakefulness; P < 0.001 in sleep; two-way ANOVA with treatment and time as factors).
Sleep
During the air-breathing baseline periods in group 1, the SP-SAP-treated rats were awake 44 ± 3 % of the time and in NREM sleep 49 ± 2 % of the time. In the days following the SP-SAP lesion, during the air-breathing portion of the protocol the rats were awake for a greater fraction of the time. At days 4-7 and 12-15, they were awake for 67 ± 4 and 68 ± 6 % of the time, respectively. One-way repeated measures ANOVA showed a significant effect (P < 0.02), which Tukey's post hoc test showed to be present (P < 0.05) at 4-7 and 8-12 days compared to the baseline. The amount of time in NREM sleep was similarly decreased and one-way repeated measures ANOVA showed a significant effect (P < 0.03), which Dunnett's post hoc analysis showed to be present (P < 0.05) at 4-7 and 8-12 days compared to the baseline. In contrast, for the SAP-treated control group there was no significant change in the amount of time spent in wakefulness or NREM sleep during air breathing over the 15 day time period of the experiment.
During the air-breathing baseline periods in group 2, on the first days following the injection the SAP-treated control rats were awake 34 ± 6 % of the time while the SP-SAP-treated rats were awake 42 ± 5 % of the time. This difference was maintained at each measurement period such that overall the SP-SAP group was awake for a significantly greater fraction of the air-breathing baseline period (P < 0.01; two-way ANOVA with treatment and time as factors). The percentage of the time awake on different days ranged from 32 to 42 % for the SAP-treated control rats and from 42 to 51 % for the SP-SAP-treated rats. The percentage of the air-breathing baseline period in NREM sleep was similarly different, ranging from 56 to 62 % in the SAP-treated control rats and from 44 to 55 % in the SP-SAP-treated rats (P < 0.03; two-way ANOVA with treatment and time as factors).
Exposure to 7 % CO2 in general tends to awaken the rats. In the group 1 SP-SAP-treated rats, exposure to 7 % CO2 compared to the air-breathing period increased the time awake from 44 ± 3 to 66 ± 9 %. In the group 1 SAP-treated controls, exposure to 7 % CO2 compared to the air-breathing period increased the time awake from 54 ± 7 to 72 ± 4 %. Similar results were obtained in the bilateral lesion group. Treatment with SP-SAP or SAP alone did not alter this effect of CO2.
and body temperature
and body temperature did not change significantly after either treatment in group 1 or between treatments in group 2.
DISCUSSION
NK1R immunoreactivity in the brainstem
We examined the NK1R-ir staining pattern qualitatively for the entire brainstem as well as quantitatively for the RTN/Ppy region. As shown by Nakaya et al. (1994), many brainstem regions with prominent NK1R-ir are those associated with central chemoreception. These include the regions of the locus ceruleus, RTN, Ppy, midline medullary raphé, caudal NTS, caudal ventral medulla, pre-Bötzinger complex (PBC) and rostral nucleus ambiguus. NK1R-ir may mark chemosensitive neurons or neurons involved in the system response to CO2 as modulators of other neurons. The nature of the NK1R-ir differs among these sites. In some cases, neuronal somata are clearly seen and easily quantified. The PBC is one such site and this feature has been effectively utilized by Gray et al. (1999, 2001) and Wang et al. (2002) to mark and selectively lesion this region. Our area of interest in this study, the RTN/Ppy region (Fig. 2), exhibits predominantly neuronal processes (Figs 1–3). Neuronal somata with NK1R-ir are few in number. This is consistent with our neuronal counts and cytoarchitecture for this region studied shortly after focal neurobiotin injection (Cream et al. 2002). In fact, the staining pattern shown in Figs 1, 2 and 3A and B is very similar to the pattern shown in Figs 3, 4 and 5 of the study by Cream et al. (2002). At the rostral end of the facial nucleus, NK1R-ir is prominent at the lateral edge of the nucleus in the form of some neuronal somata and as processes present in a reticular pattern that is also present ventral to the facial nucleus and medially in the Ppy region. The lateral site of NK1R-ir at the rostral aspect of the facial nucleus could include portions of the A5 region. At the level of the mid-facial nucleus, the NK1R-ir is mostly in the form of neuronal processes present between the facial nucleus and the ventral surface and in the Ppy region. At the level of the caudal facial nucleus, neuronal processes are present at the ventral surface and neuronal somata become more prevalent at the Ppy region.
Given this cytoarchitecture in our RTN/Ppy region of interest, we chose to measure lesion size by determining: (1) the area of NK1R-ir in sequential rostral to caudal sections (Fig. 4); (2) the volume of tissue expressing NK1R-ir; and (3) cell counts. Our area of interest in each section contained somata and/or cell processes that express NK1R-ir, as shown in Fig. 2 and Fig. 3. Unilateral SP-SAP injection compared to no-injection controls significantly decreased the area of NK1R-ir for 10 consecutive sections from 10.2 to 11.1 mm caudal to bregma (Fig. 4A). Bilateral injections of SP-SAP compared to SAP-injected controls significantly decreased the area of NK1R-ir in 9 consecutive sections from 10.4 to 11.2 mm caudal to bregma (Fig. 4B). In both groups 1 and 2, the SP-SAP injections significantly decreased the volume of the RTN/Ppy region that expressed NK1R-ir, by 44 % in the unilateral comparison, and by 47 and 40 % in the two sides of the bilateral comparison. Cell counts showed similar significant decreases in SP-SAP-injected areas. Our SP-SAP injections produced reliable, circumscribed lesions in the RTN/Ppy region of interest. The presence of normal TPOH-ir cell numbers in areas with loss of NK1R-ir after SP-SAP injection provides evidence that the SP-SAP lesions were specific.
Did SAP control injections produce lesions? In the group 1 unilateral experiment, SAP injections had no significant effect on the measured areas (Fig. 4A), volumes or cell counts. The volumes of the RTN/Ppy region that contained NK1R-ir in the uninjected sides of the unilateral experiments were similar, 0.88 ± 0.04 and 0.95 ± 0.04 μl, respectively. The RTN/Ppy volume in the unilateral SAP injection control groups was 0.83 ± 0.04 μl. However, in the group 2 bilateral experiment (Fig. 4B) the areas of NK1R-ir after SAP injection appear to be less than in the unilateral SAP experiment (Fig. 4A) and the volumes also were less, 0.73 ± 0.03 and 0.68 ± 0.03 μl in the two sides of the bilateral protocol, respectively. Statistical comparisons (two-way ANOVA) between NK1R-ir area in the bilateral SAP vs. the unilateral SAP or unilateral no-injection controls do show a treatment effect (P < 0.001) but no interactive effect (treatment vs. site). These data suggest that bilateral SAP injections at this dose made under anaesthesia may result in lesions. Wang et al. (2002) reported that SAP injections had no lesion effect. But they used stable substance P-SAP (SSP-SAP), which is a substance P ligand with higher affinity, requiring one-tenth our dose for both toxin and SAP control. Gray et al. (2001) used SP-SAP at the same dose as we did and showed data that suggest a small SAP effect similar to ours; there were 35 cells in PBC of controls, 30 after SAP and 0 after SP-SAP.
There were also differences in the brainstem neuroanatomy between animals with unilateral and bilateral lesions. The presence of the guide cannula in the brainstem throughout the duration of the unilateral protocol and its removal along with the brainstem at the end of the experiment often resulted in a nonspecific lesion. In contrast, the injection of SAP or SP-SAP at the time of surgery with immediate removal of the injection needles resulted in less nonspecific tissue damage.
The RTN/Ppy region, breathing and central chemoreception
Neurons in the RTN/Ppy region, which express NK1R-ir, provide a tonic drive that helps to maintain normal when breathing air at rest. In group 1, while was not significantly affected by SP-SAP treatment, it was decreased by 10-12 % during wakefulness and sleep in four of five rats. In group 2, was decreased significantly in the SP-SAP-treated rats compared to the SAP-treated controls. Pa,CO2 was also significantly higher in the SP-SAP-treated rats. We attribute the greater effect in the group 2 experiment to the larger overall volume of the lesion, which was approximately doubled in the bilateral group.
The neurons in the RTN/Ppy region, which express NK1R-ir, are also clearly involved in the response to systemic hypercapnia, since this response is decreased significantly in SP-SAP-treated rats in both groups 1 and 2. Here the effect seems greater in the unilateral protocol, with a maximum decrease in the Δ when breathing an air mixture containing 7 % CO2 compared to breathing air of 28 % during wakefulness and 30 % during sleep in the unilateral group and 17 % during wakefulness and 22 % during sleep in the bilateral group. Given the greater volume of affected tissue in the bilateral experiments, we expected a greater decrease in the response to systemic hypercapnia. One likely explanation for the smaller effect on CO2 sensitivity in group 2 involves the normal variability in the control hypercapnic response sensitivity among groups of rats. If the group 2 SP-SAP-treated rats had an initial CO2 response (unmeasured in our protocol) that was lower than that of the SAP-treated rats then we would underestimate the lesion effect. Similarly, to the extent that there is some disruption of NK1R-ir and CO2 sensitivity with the bilateral SAP-treated controls as suggested by the data in Fig. 4B, then we would underestimate the treatment effect. Nevertheless, it is clear that loss of NK1R-ir in the RTN/Ppy region results in a decrease in the response to systemic hypercapnia.
We can compare our results to other experiments with disruption of the RTN/Ppy region. In anaesthetized animals, cooling or neurotoxin-induced lesions in the RTN/Ppy region decreases respiratory output in air breathing, often to apnoea, and decreases the response to CO2 stimulation, often completely (Budzinska et al. 1985; Nattie & Li, 1994; Forster et al. 1997). In unanaesthetized animals, the effects of nonspecific disruption are less dramatic. Cooling a large area on the ventral medullary surface, which would include the RTN/Ppy region, produces a small decrease of resting breathing in air and a significant decrease in the response to systemic hypercapnia (Forster et al. 1997). Focal lesions in the RTN/Ppy region produced by unilateral microinjection of the neurotoxin kainic acid result in a sustained 39 % decrease in the and VT response to breathing air containing 7 % CO2 over 3 weeks but no discernible effect on resting breathing (Akilesh et al. 1997). The tissue volume affected, as judged by counts of neurons in the RTN region, was similar to that in the present study. We have also reversibly inhibited neurons in the RTN/Ppy region of the unanaesthetized rat by unilateral microdialysis of muscimol (Nattie & Li, 2000). VT and are inhibited in the first 15 min, but VT remains low during the 30 min of dialysis and for 60 min thereafter, while returns to normal values due to a compensatory increase in f. The response to breathing air containing 7 % CO2 is reduced for the 30 min dialysis period and for the following 60 min. The present data add to these studies. They show specificity in that the lesions affect only NK1R-ir neurons and processes and they show that more extensive lesions involving both sides of the brainstem result in hypoventilation in the unanaesthetized rat as well as in a distinct decrease in CO2 sensitivity. We attribute the effect on resting breathing to the loss of a tonic drive to the respiratory neuronal network that arises from NK1R-ir neurons in the RTN/Ppy region. The decrease in the response to systemic hypercapnia can be explained by loss of chemoreception at this site, implying that neurons that express NK1R-ir are chemosensitive, or by the loss of a modulatory effect on other neurons that are chemosensitive. The observation that focal acidosis limited to the RTN/Ppy region by microdialysis of CO2-rich artificial cerebrospinal fluid stimulates indicates that chemoreceptors are present in this region (Li et al. 1999).
Are neurons that express NK1R-ir chemoreceptors?
We are unaware of any studies that indicate chemosensitivity in NK1R-ir neurons. That neurons with NK1Rs are involved in sensory processing suggests that sensitivity to CO2 or H+ may be a possible function for them (Mantyh et al. 1997). However, the physiological role of SP in the central nervous system, as described to date, seems more likely to be that of a modulator of autonomic and pain responses (Culman & Unger, 1995; Mantyh et al. 1997). In cardiovascular control, neurons that contain SP or express NK1R-ir are present in the rostral pressor (C1) region, in the rostral ventral respiratory group (VRG) and in the NTS (Ljungdahl et al. 1978; Marson & Loewy, 1985; Ciriello et al. 1988; Nakaya et al. 1994; Wang et al. 2002). Focal application of SP in the C1 region increases blood pressure (Urbanski et al. 1989) and the firing rate of pressor neurons (Li & Guyenet, 1997), while in the NTS it modulates the sensitivity of the baroreceptor reflex (Seagard et al. 2000). Blood pressure effects of excitatory amino acid injections into the rostral VRG are attenuated by lesions of NK1R-ir neurons at that site (Wang et al. 2002). In respiratory control, application of SP at the RTN/Ppy region stimulates breathing while application of an antagonist to the NK1R inhibits breathing and the response to hypercapnia (Chen et al. 1988, 1990). SP-containing processes, probably originating in the medullary raphé, synapse at respiratory neurons in nucleus ambiguus (Holtman, 1988). Putative rhythm-generating neurons in the PBC that are responsive to SP also express NK1R-ir and are glutamatergic (Gray et al. 1999; Guyenet & Wang, 2001; Wang et al. 2002). Gray et al. (2001) used the presence of NK1R-ir on PBC neurons to investigate whether they were involved in rhythm generation in the adult rat in vivo. They injected the SP-SAP conjugate bilaterally and if >80 % of NK1R-ir neurons within the PBC were killed, the rats exhibited a dramatic result. Their air-breathing respiratory rhythm was ataxic, they hypoventilated and their response to hypercapnia was diminished. It is worth noting that >80 % destruction of the PBC results in a very different pattern of breathing abnormalities than does ≈45 % destruction of the RTN/Ppy region. In our results there is no rhythm disturbance. Figure 4 shows that our lesions do not encroach on the PBC, which is located from 600 to 1100 μm caudal to the facial nucleus (Gray et al. 2001; Wang et al. 2002). Thus, NK1R-ir marks neurons with different functions in PBC vs. the RTN/Ppy region. In the RTN/Ppy chemoreceptor region there are both extensive NK1R-ir (Nakaya et al. 1994; present paper) and SP-containing neurons (Ljungdahl et al. 1978; Marson & Loewy, 1985; Ciriello et al. 1988). Neurons with SP are also prominent in the nearby medullary raphé (Ljungdahl et al. 1978; Marson & Loewy, 1985; Ciriello et al. 1988; Arvidsson et al. 1994). Retrograde tracing of neurobiotin injected into the RTN/Ppy region shows local staining in the contralateral RTN/Ppy region and in the medullary raphé (Cream et al. 2002). It is possible that local circuits exist in the RTN/Ppy and medullary raphé and the natural source of SP for the NK1R-ir neurons in the RTN/Ppy region is from other neurons in these local circuits. Afferents to the RTN/Ppy region also come from many other brainstem autonomic control sites (Cream et al. 2002), some of which contain SP. These could be the source of innervation for the RTN/Ppy NK1R-ir neurons as well. That application of SP to RTN/Ppy neurons stimulates breathing suggests they are excitatory in nature. That NK1R antagonist application in the RTN/Ppy region inhibits breathing (Chen et al. 1988, 1990) and specific destruction of the NK1R-ir neurons results in hypoventilation (present study) indicates that SP is being released in some tonic fashion during normal breathing. Central chemoreception may be a CO2/H+-dependent modulation of this SP-related process.
It is worth remembering in this regard that many specific receptor antagonists applied to the ventral medulla or injected at or near to the RTN/Ppy region have been shown to decrease the response to systemic hypercapnia. These include muscarinic (Nattie & Li, 1990), P2X2 (Thomas et al. 1999) and glutamate (Nattie et al. 1993) receptor antagonists. Stimulation of GABAA (Nattie & Li, 2000; Curran et al. 2001) and 5HT1A receptors (Messier et al. 2002) also decreases the response to systemic hypercapnia. Each receptor/neuron has been proposed as chemosensitive, as we suggest here for the NK1R-ir neurons. At other sites, noradrenaline- (Ballantyne & Scheid, 2001; Haxhiu et al. 2001) and serotonin-containing neurons (Richerson et al. 2001) have been proposed as chemosensitive. Perhaps chemoreception resides in all of these receptors/neurons. It is also possible that the RTN/Ppy region and the adjacent medullary raphé consist of a complex array of interacting neurons that together contribute to a normal response to hypercapnia. Among these neurons is a primary chemosensor, the response of which can be modified by multiple other inputs. There is an emerging model for this concept in that the sensitivity to CO2 of medullary raphé neurons in culture can be modified by application of acetylcholine (G. B. Richerson, personal communication).
The RTN/Ppy region and sleep
The finding that SP-SAP lesions of NK1R-ir neurons and processes in the RTN/Ppy region promoted wakefulness during the air-breathing portion of the protocol was unexpected. Our measurements were made just before and after the transition between the imposed light-dark cycle so we were observing only a brief portion of the daily sleep pattern and were doing so at a time when sleep may be less robust. The findings do replicate a similar promotion of wakefulness observed with inhibition of RTN (Curran et al. 2001; Darnall et al. 2001) and medullary raphé neurons (Messier et al. 2002) in the newborn piglet by muscimol dialysis. More complete sleep analysis is needed to verify this finding.
Summary and significance
Specific and focal unilateral and bilateral destruction of neurons and processes that express NK1R-ir in the RTN/Ppy region of the rat medulla results in hypoventilation while breathing air at rest, a decreased response to systemic hypercapnia and a tendency to remain awake, i.e. sleep less. NK1R-ir neurons may be chemosensitive or they may modulate the function of other neurons within a complex array of neuronal phenotypes in the RTN/Ppy region and adjacent medullary raphé. Tonic endogenous SP release appears to be present and the source could be local SP-containing neurons or distant neurons at other sites involved in autonomic regulation.
Acknowledgments
This research was supported by National Heart and Lung Institute grant HL 28066. Dr Ruhong Dong performed many of the experiments. Drs P. Gray and J. Feldman provided useful suggestions on doses for SP-SAP injections and for NK1R immunostaining.
REFERENCES
- Akilesh MR, Kamper M, Li A, Nattie EE. Effects of unilateral lesions of retrotrapezoid nucleus on breathing in awake rats. Journal of Applied Physiology. 1997;82:469–479. doi: 10.1152/jappl.1997.82.2.469. [DOI] [PubMed] [Google Scholar]
- Arvidsson U, Cullheim S, Ulfhake B, Luppi P, Kitahama K, Jouvet M, Hökfelt T. Quantitative and qualitative aspects on the distribution of 5-HT and its coexistence with substance P and TRH in cat ventral medullary neurons. Journal of Chemical Neuroanatomy. 1994;7:3–12. doi: 10.1016/0891-0618(94)90003-5. [DOI] [PubMed] [Google Scholar]
- Ballantyne D, Scheid P. Central chemosensitivity of respiration: a brief overview. Respiration Physiology. 2001;129:5–12. doi: 10.1016/s0034-5687(01)00297-3. [DOI] [PubMed] [Google Scholar]
- Bennington JH, Kodali SK, Heller HC. Scoring transitions to REM sleep in rats based on the EEG phenomena of pre-REM sleep: an improved analysis of sleep structure. Sleep. 1994;17:28–35. doi: 10.1093/sleep/17.1.28. [DOI] [PubMed] [Google Scholar]
- Berger AJ, Cooney KA. Ventilatory effects of kainic acid injection in the ventrolateral solitary nucleus. Journal of Applied Physiology. 1982;52:131–140. doi: 10.1152/jappl.1982.52.1.131. [DOI] [PubMed] [Google Scholar]
- Budzinska K, Von Euler C, Kao FF, Panteleo T, Yamamoto Y. Effects of graded focal cold block in the rostral areas of the medulla. Acta Physiologica Scandinavica. 1985;124:329–340. doi: 10.1111/j.1748-1716.1985.tb07668.x. [DOI] [PubMed] [Google Scholar]
- Chen Z, Hedner J, Hedner T. Substance P in the ventrolateral medulla oblongata regulates ventilatory responses. Journal of Applied Physiology. 1990;68:2631–2639. doi: 10.1152/jappl.1990.68.6.2631. [DOI] [PubMed] [Google Scholar]
- Chen Z, Hedner T, Hedner J. Hypoventilation and apnoea induced by the substance P antagonist [D-Pro2,D-Trp7, 9]-SP in the ventrolateral rat medulla. Acta Physiologica Scandinavica. 1988;134:153–154. doi: 10.1111/j.1748-1716.1988.tb08472.x. [DOI] [PubMed] [Google Scholar]
- Ciriello J, Caverson MM, Calaresu FR, Krukoff TL. Neuropeptide and serotonin immunoreactive neurons in the cat ventrolateral medulla. Brain Research. 1988;440:53–66. doi: 10.1016/0006-8993(88)91158-4. [DOI] [PubMed] [Google Scholar]
- Coates EL, Li A, Nattie EE. Widespread sites of brainstem ventilatory chemoreceptors. Journal of Applied Physiology. 1993;75:5–14. doi: 10.1152/jappl.1993.75.1.5. [DOI] [PubMed] [Google Scholar]
- Cream C, Li A, Nattie E. The retrotrapezoid nucleus (RTN): local cytoarchitecture and afferent connections. Respiration Physiology and Neurobiology. 2002;130:121–137. doi: 10.1016/s0034-5687(01)00338-3. [DOI] [PubMed] [Google Scholar]
- Culman J, Unger T. Central tachykinins: mediators of defence reaction and stress reactions. Canadian Journal of Physiology and Pharmacology. 1995;73:885–891. doi: 10.1139/y95-122. [DOI] [PubMed] [Google Scholar]
- Curran AK, Darnall RA, Filiano JJ, Li A, Nattie EE. Muscimol dialysis in the rostral ventral medulla reduced the CO2 response in awake and sleeping piglets. Journal of Applied Physiology. 2001;90:971–980. doi: 10.1152/jappl.2001.90.3.971. [DOI] [PubMed] [Google Scholar]
- Darnall RA, Curran AK, Filiano JJ, Li A, Nattie EE. The effects of a GABAA agonist in the rostral ventral medulla on sleep and breathing in newborn piglets. Sleep. 2001;24:514–527. doi: 10.1093/sleep/24.5.514. [DOI] [PubMed] [Google Scholar]
- Forster HV, Ohtake PJ, Pan LG, Lowry TF. Effect on breathing of surface ventrolateral medullary cooling in awake, unanesthetized and asleep goats. Respiration Physiology. 1997;110:187–197. doi: 10.1016/s0034-5687(97)00083-2. [DOI] [PubMed] [Google Scholar]
- Gray PA, Janczewski WA, Mellen N, McCrimmon DR, Feldman JL. Normal breathing requires preBötzinger complex neurokinin-1 receptor-expressing neurons. Nature Neuroscience. 2001;4:927–930. doi: 10.1038/nn0901-927. [DOI] [PMC free article] [PubMed] [Google Scholar]
- Gray PA, Rekling JC, Bocchiaro CM, Feldman JL. Modulation of respiratory frequency by peptidergic input to rhythmogenic neurons in the preBötzinger complex. Science. 1999;286:1566–1568. doi: 10.1126/science.286.5444.1566. [DOI] [PMC free article] [PubMed] [Google Scholar]
- Guyenet PG, Wang H. Pre-Bötzinger neurons with preinspiratory discharges “in vivo” express NK1 receptors in the rat. Journal of Neurophysiology. 2001;86:438–446. doi: 10.1152/jn.2001.86.1.438. [DOI] [PubMed] [Google Scholar]
- Haxhiu MA, Tolentino-Silva F, Pete G, Kc P, Mack SO. Monoaminergic neurons, chemosensation and arousal. Respiration Physiology. 2001;129:191–210. doi: 10.1016/s0034-5687(01)00290-0. [DOI] [PubMed] [Google Scholar]
- Holtman JR. Immunohistochemical localization of serotonin- and substance P-containing fibers around respiratory muscle motoneurons in the nucleus ambiguus of the cat. Neuroscience. 1988;26:169–178. doi: 10.1016/0306-4522(88)90135-2. [DOI] [PubMed] [Google Scholar]
- Jacky JP. A plethysmograph for long-term measurements of ventilation in unrestrained animals. Journal of Applied Physiology. 1978;45:644–647. doi: 10.1152/jappl.1978.45.4.644. [DOI] [PubMed] [Google Scholar]
- Li A, Randall M, Nattie EE. CO2 microdialysis in retrotrapezoid nucleus of the rat increases breathing in wakefulness but not in sleep. Journal of Applied Physiology. 1999;87:910–919. doi: 10.1152/jappl.1999.87.3.910. [DOI] [PubMed] [Google Scholar]
- Li Y, Guyenet PG. Effect of substance P on C1 and other bulbospinal cells of the RVLM in neonatal rats. American Journal of Physiology. 1997;273:R805–813. doi: 10.1152/ajpregu.1997.273.2.R805. [DOI] [PubMed] [Google Scholar]
- Ljungdahl A, Hökfelt T, Nilsson G. Distribution of substance P-like immunoreactivity in the central nervous system of the rat. Neuroscience. 1978;3:861–944. doi: 10.1016/0306-4522(78)90116-1. [DOI] [PubMed] [Google Scholar]
- Loeschcke HH. Central chemosensitivity and the reaction theory. Journal of Physiology. 1982;332:1–24. doi: 10.1113/jphysiol.1982.sp014397. [DOI] [PMC free article] [PubMed] [Google Scholar]
- Mantyh PW, Rogers SD, Honore P, Allen BJ, Ghilardi JR, Li J, Daughters RS, Lappi DA, Wiley RG, Simone DA. Inhibition of hyperalgesia by ablation of lamina 1 spinal neurons expressing the substance P receptor. Science. 1997;278:275–279. doi: 10.1126/science.278.5336.275. [DOI] [PubMed] [Google Scholar]
- Marson L, Loewy AD. Topographic organization of substance P and monoamine cells in the ventral medulla of the cat. Journal of the Autonomic Nervous System. 1985;14:271–285. doi: 10.1016/0165-1838(85)90116-x. [DOI] [PubMed] [Google Scholar]
- Messier ML, Li A, Nattie EE. Muscimol inhibition of the medullary raphé decreases the CO2 response and alters sleep in newborn piglets. Respiration Physiology and Neurobiology. 2002. in the Press. [DOI] [PubMed]
- Mortola JP. Respiratory Physiology of Newborn Animals. Baltimore, MD, USA: The Johns Hopkins University Press; 2001. pp. 243–250. [Google Scholar]
- Nakaya Y, Kaneko T, Shigemoto R, Nakanishi S, Mizuno N. Immunohistochemical localization of substance P receptor in the central nervous system of the adult rat. Journal of Comparative Neurology. 1994;347:249–274. doi: 10.1002/cne.903470208. [DOI] [PubMed] [Google Scholar]
- Nattie EE. Central chemoreceptors, pH, and respiratory control. In: Kaila K, Ransom BR, editors. pH and Brain Function. New York, NY, USA: Wiley Press; 1998. pp. 535–560. [Google Scholar]
- Nattie E. CO2, brainstem chemoreceptors and breathing. Progress in Neurobiology. 1999;59:299–331. doi: 10.1016/s0301-0082(99)00008-8. [DOI] [PubMed] [Google Scholar]
- Nattie EE. Multiple sites for central chemoreception: their roles in response sensitivity in sleep and wakefulness. Respiration Physiology. 2000;122:223–236. doi: 10.1016/s0034-5687(00)00161-4. [DOI] [PubMed] [Google Scholar]
- Nattie EE. Central chemosensitivity, sleep, and wakefulness. Respiration Physiology. 2001;129:257–268. doi: 10.1016/s0034-5687(01)00295-x. [DOI] [PubMed] [Google Scholar]
- Nattie EE, Gdovin M, Li A. Retrotrapezoid nucleus glutamate receptors: control of CO2 sensitive phrenic and sympathetic output. Journal of Applied Physiology. 1993;74:2958–2968. doi: 10.1152/jappl.1993.74.6.2958. [DOI] [PubMed] [Google Scholar]
- Nattie EE, Li A. Ventral medulla sites of muscarinic receptor subtypes involved in cardiorespiratory control. Journal of Applied Physiology. 1990;69:33–41. doi: 10.1152/jappl.1990.69.1.33. [DOI] [PubMed] [Google Scholar]
- Nattie EE, Li A. Retrotrapezoid nucleus lesions decrease phrenic activity and CO2 sensitivity in rats. Respiration Physiology. 1994;97:63–77. doi: 10.1016/0034-5687(94)90012-4. [DOI] [PubMed] [Google Scholar]
- Nattie EE, Li A. Muscimol dialysis in the retrotrapezoid nucleus region inhibits breathing in the awake rat. Journal of Applied Physiology. 2000;89:153–162. doi: 10.1152/jappl.2000.89.1.153. [DOI] [PubMed] [Google Scholar]
- Nattie EE, Li A. CO2 dialysis in the medullary raphé of the rat increases ventilation in sleep. Journal of Applied Physiology. 2001;90:1247–1257. doi: 10.1152/jappl.2001.90.4.1247. [DOI] [PubMed] [Google Scholar]
- Nattie EE, Li A. CO2 dialysis in nucleus tractus solitarius region of rat increases ventilation in sleep and wakefulness. Journal of Applied Physiology. 2002;92:2119–2130. doi: 10.1152/japplphysiol.01128.2001. [DOI] [PubMed] [Google Scholar]
- Pappenheimer J. Sleep and respiration of rats during hypoxia. Journal of Physiology. 1977;266:191–207. doi: 10.1113/jphysiol.1977.sp011763. [DOI] [PMC free article] [PubMed] [Google Scholar]
- Paxinos G, Watson C. The Rat Brain in Stereotaxic Coordinates. New York, NY, USA: Academic Press; 1982. [Google Scholar]
- Richerson GB, Wang W, Tiwari J, Bradley SR. Chemosensitivity of serotonergic neurons in the rostral ventral medulla. Respiration Physiology. 2001;129:175–190. doi: 10.1016/s0034-5687(01)00289-4. [DOI] [PubMed] [Google Scholar]
- Seagard JL, Dean C, Hopp FA. Modulation of the carotid baroreceptor reflex by substance P in the nucleus tractus solitarius. Journal of the Autonomic Nervous System. 2000;78:77–85. doi: 10.1016/s0165-1838(99)00060-0. [DOI] [PubMed] [Google Scholar]
- Solomon IC, Edelman NH, O'Neal MH., III CO2/H+ chemoreception in the cat pre-Bötzinger complex in vivo. Journal of Applied Physiology. 2000;88:1996–2007. doi: 10.1152/jappl.2000.88.6.1996. [DOI] [PubMed] [Google Scholar]
- Thomas T, Ralevic V, Gadd CA, Spyer KM. Central CO2 chemoreception: a mechanism involving P2 purinoceptors localized in the ventral medulla of the anaesthetized rat. Journal of Physiology. 1999;517:899–905. doi: 10.1111/j.1469-7793.1999.00899.x. [DOI] [PMC free article] [PubMed] [Google Scholar]
- Trachsel L, Tobler I, Borbély A. Electroencephalogram analysis of non-rapid eye movement sleep in rats. American Journal of Physiology. 1988;255:R27–37. doi: 10.1152/ajpregu.1988.255.1.R27. [DOI] [PubMed] [Google Scholar]
- Urbanski RW, Murugaian J, Krieger AJ, Sapru HN. Cardiovascular effects of substance P receptor stimulation in the ventrolateral medullary pressor and depressor areas. Brain Research. 1989;491:383–389. doi: 10.1016/0006-8993(89)90076-0. [DOI] [PubMed] [Google Scholar]
- Wang H, Germanson TP, Guyenet PG. Depressor and tachypneic responses to chemical stimulation of the ventral respiratory group are reduced by ablation of neurokinin-1 receptor-expressing neurons. Journal of Neuroscience. 2002;22:3755–3764. doi: 10.1523/JNEUROSCI.22-09-03755.2002. [DOI] [PMC free article] [PubMed] [Google Scholar]
- Wang H, Stornetta RL, Rosin DL, Guyenet PG. Neurokinin-1 receptor-immunoreactive neurons of the ventral respiratory group in the rat. Journal of Comparative Neurology. 2001;434:128–146. doi: 10.1002/cne.1169. [DOI] [PubMed] [Google Scholar]
- Wiley RG, Lappi DA. Destruction of neurokinin-1 receptor expressing cells in vitro and in vivo using substance P–saporin in rats. Neuroscience Letters. 1997;230:97–100. doi: 10.1016/s0304-3940(97)00490-4. [DOI] [PubMed] [Google Scholar]