

Abstract
In the stomach, production of prostaglandins by cyclo-oxygenase (COX) is believed to be important in mucosal defence. We tested the hypothesis that endogenous COX activity is required for protective gastric surface pH control. Intact stomachs of anaesthetized mice were perfused with a weakly buffered solution (150 mmNaCl + 4 mm Homopipes) at pH values from 2.5 to 7.0. Gastric effluents were collected to measure pH and estimate amounts of acid or alkali secretion in nanomoles secreted per minute. A switch from net acid to net alkali secretion was seen in response to acidifying luminal pH with an apparent ‘set point’ between pH 4 and 5. At luminal pH 3, the net alkali secretion (12.7 ± 2.8 nmol OH− equivalents min−1) was abolished (2.2 ± 1.7 nmol OH− min−1) by the non-specific COX inhibitor indomethacin (5 mg kg−1 I.P.). Similar inhibition was observed using a COX-1 inhibitor (SC-560; 10 mg kg−1 I.P.), but not a COX-2 inhibitor (NS-398; 10 mg kg−1 I.P.). Subsequent treatment with 16,16-dimethyl prostaglandin E2 (dm-PGE2; 1 mg kg−1 I.P.) rescued the alkali secretion (21.8 ± 2.7 nmol OH− min−1). In either the absence or presence of the H+,K+-ATPase inhibitor omeprazole (60 mg kg−1 I.P.), indomethacin blocked similar amounts of net alkali secretion (10.5 ± 2.7 and 16.4 ± 3.4 nmol OH− min−1, respectively). We also used in vivo confocal microscopy to examine pH near the mucosal surface. The gastric mucosal surface of anaesthetized mice was exposed and mucosal surface pH was imaged using the fluorescence intensity ratio of Cl-NERF as a pH indicator. Results showed a switch from a continuous net acid to net alkali secretion by the stomach in response to changing superfusate pH from 5 to 3. At luminal pH 3, the relatively alkaline surface pH (4.3 ± 0.1) was acidified (3.6 ± 0.2) by indomethacin, and subsequent dm-PGE2 restored surface pH (4.2 ± 0.2). We conclude that the pre-epithelial alkaline layer is regulated by endogenous COX activity.
There are several levels of protection within the stomach to prevent acid from entering the body. Such protective components include: a pre-epithelial alkaline layer, the tight epithelium of the surface mucosa, and subepithelial nerves and blood flow (Wallace, 1989; Atay et al. 2000). The pre-epithelial alkaline layer, consisting mostly of mucus and bicarbonate, presents the first line of defence against luminal acid. It is also the least understood component of the gastric protective mechanisms due to the difficulty in studying a viscous, extracellular, virtually invisible component of gastric physiology. Such characteristics have resisted conventional methods of study. However, studies of bicarbonate secretion using isolated tissues in Ussing chambers with (Takeuchi et al. 1982; Goddard et al. 1990) or without voltage clamped tissue (Flemstrom, 1977), in vivo pH-sensitive microelectrode techniques (Williams & Turnberg, 1981; Takeuchi et al. 1983; Matsueda et al. 1989; Schade et al. 1994; Schreiber et al. 2000; Synnerstad et al. 2001), and theoretical extrapolation (Engel et al. 1995) have all contributed valuable information about the pre-epithelial layer.
There is consensus that a pH gradient exists at the surface of the gastric epithelial cells in the acid secretory parts of the stomach in rabbit (Williams & Turnberg, 1981), rat (Ross et al. 1981; Ross & Turnberg, 1983; Matsueda et al. 1989; Schade et al. 1994), human (Bahari et al. 1982), frog (Takeuchi et al. 1983) and dog (Patronella et al. 1988). This pH gradient consists of a relatively alkaline pH directly at the mucosal surface that progressively approaches bulk luminal pH at distances outward from the surface. However, there is controversy concerning the constancy and absolute values of pH directly at the mucosal surface. Some studies report that surface pH is always near pH 7 until bulk luminal pH acidifies below 1.5 (Turnberg, 1987; Synnerstad et al. 2001). Schade et al. (1994) reported that, during luminal pH 3 conditions, surface pH varied modestly between pH 6.9 and 7.3 comparing omeprazole- and gastrin-treated tissue, respectively. Conversely, Schreiber et al. (2000) have reported a pH of ≈4.6 at the opening of the crypt of the guinea-pig gastric gland during luminal pH 3 conditions. We have also previously reported in rat a surface pH of near 4 when bulk luminal pH is 3, but observed the surface pH gradient to actually reverse when luminal pH was raised to pH 5 and acid secretion was stimulated (Chu et al. 1999). Overall, results raise questions about the factors that are important for regulating and sustaining the pre-epithelial alkaline layer.
Prostaglandins have been shown to stimulate mucus (Ranta-Knuuttila et al. 1996; Wallace & Granger, 1996; Takahashi et al. 1999) and bicarbonate secretion (Turnberg, 1987; Ranta-Knuuttila et al. 1996; Wallace & Granger, 1996; Flemstrom & Isenberg, 2001), increase mucosal blood flow (Wallace & Granger, 1996), inhibit acid secretion (Ligumsky et al. 1983; Ranta-Knuuttila et al. 1996; Wallace & Granger, 1996), accelerate healing of gastric ulcers (Wallace & Granger, 1996; Arakawa et al. 1998) and reduce gastric motility (Takahashi et al. 2000). Prostaglandin E2, being the predominant prostanoid in the stomach (Sun et al. 2000), has been the most widely studied prostaglandin in gastric physiology and has documented ability to perform the cytoprotective roles mentioned above. Conversely, non-steroidal anti-inflammatory drugs (NSAIDs) inhibit prostaglandin synthesis by targeting the COX enzyme and have been shown to disrupt the cytoprotective activities of prostaglandins. It has been widely observed that gastric damage is caused by NSAID use and that exogenous prostaglandins can protect the gastric mucosa from this damage (Robert et al. 1979; Ligumsky et al. 1982; Suetsugu et al. 2000). Results suggest that the role of prostaglandins in normal mucosal defence may be mediated in part by regulation of pre-epithelial defences.
The goal of this study was to test if endogenous prostaglandin synthesis is required for regulation of the pre-epithelial alkaline layer. Reports by Ross and colleagues (Ross et al. 1981; Ross & Turnberg, 1983) provided evidence that prostaglandins may play a role in maintaining gastric surface pH. Using antimony microelectrodes, they observed a decrease in surface pH from 6.7 ± 0.73 to 5.30 ± 1.42 after the administration of aspirin. This drop in pH was prevented by pretreatment with 16,16-dimethyl prostaglandin E2. The use of antimony microelectrodes, however, has raised concerns about the validity of results. The large tip diameters made the electrodes difficult to secure in a defined position in the mucus (Nagano et al. 1990) and the electrodes were shown to over-estimate pH in biological samples (Fujimoto & Matsumura, 1980). We have previously developed in vivo approaches to non-invasively measure pH in either the whole rat stomach (Coskun et al. 2001) or specifically in the pre-epithelial luminal compartment of the rat stomach (Chu et al. 1999). This paper introduces the use of both of these approaches in mice, an important organism due to the ease of genetic manipulation in this species. Therefore, we first established appropriate methodology to ask if the pre-epithelial layer in mice behaves in a similar manner to that in rat, then report quantitative measurements of alkali secretion, surface pH, and thickness of the pH gradient to evaluate regulation of the alkaline layer by PGE2 and COX activity. Using whole stomach perfusion studies and in vivo confocal microscopy, we were able to determine that endogenous COX activity dynamically regulates gastric surface pH control in mice via regulation of alkali secretion.
Methods
Whole stomach perfusion
Animal preparation
Surgical procedures for mice are based on modifications to our published procedures for rat (Coskun et al. 2001). Male ICR mice (Harlan) of 30-45 g body weight were fasted overnight with free access to water in raised bottom cages to prevent coprophagia. Mice were anaesthetized with thiobutabarbital sodium (Inactin; 150-200 mg kg−1i.p.). Tracheotomy was performed in order to facilitate breathing. A cannula was then inserted through the mouth, down the oesophagus, and into the stomach. The cannula was ligated at the cervical level and the neck incision closed in order to prevent dehydration. The abdomen was then opened by a mid-line incision and a CO2-impermeable cannula (Saran) was inserted from the duodenum, through the pyloric sphincter, into the stomach. This cannula was ligated at the pylorus and exteriorized through the abdominal wall by a small incision. The abdominal incision was covered with saline-soaked surgical cotton and parafilm. The body temperature of the mouse was maintained at 37 °C by placing a heating lamp over the animal and monitoring the temperature with a thermistor (YSI). At the end of the experiment, animals were killed by halothane overdose. The Animal Care and Use Committee of Indiana University approved all experimental procedures.
Stop flow
As described previously (Coskun et al. 2001), a syringe pump (KDS260, KD Scientific, New Hope, PA, USA) was used to perfuse the lumen of the stomach (0.2 ml min−1) with a weakly buffered saline solution (150 mmNaCl + 4 mm Homopipes) adjusted to pH values between 2.5 and 7.0. The gastric effluent was pushed through the CO2-impermeable tubing, directing the effluent to pass over a flow-through pH electrode (Microelectrodes Inc., Bedford, NH, USA). The pH electrode was connected to a computer where gastric effluent pH was recorded every 7 s (VirtualBench-Logger, National Instruments, Austin, TX, USA). The animal was allowed to stabilize for 1-2 h before the experiment began. The difference in pH between fresh perfusate and the gastric effluent gave an initial indication of net secretion by the stomach, but we found such changes small and difficult to reproduce (data not shown) (Coskun et al. 2001). In order to amplify observed pH changes, the perfusion was transiently stopped for 10 min to allow an accumulation of gastric secretions in the stomach. When the perfusion was started again, the accumulated secretion passed over the pH electrode giving a transient spike in pH (Coskun et al. 2001).
Slow flow
As an alternative means to amplify observed pH changes, we also varied flow among several defined rates. In this protocol, the perfusion was transiently slowed from 0.2 ml min−1 to 0.1, 0.05 or 0.025 ml min−1 and the effluent pH allowed to reach a steady state. The change in effluent pH from one perfusion speed to another and the known buffering capacity of the solution were used to determine the nanomoles acid/base equivalent secreted per minute per litre of stomach volume (see Appendix). Control experiments demonstrated that the pH electrode system was insensitive to flow changes in this range (data not shown). As performed previously in rat (Coskun et al. 2001), control experiments also confirmed that there was no difference in the buffering capacity of fresh perfusate versus the buffering capacity of mouse gastric effluent collected during 0.05 ml min−1 perfusion, over the pH range 2-7.
Confocal microscopy
Animal preparation
Our procedure for rat (Chu et al. 1999) was used with minor modifications for mouse. Briefly, animals were fasted, anaesthetized, and given a tracheotomy as mentioned above. The abdomen was opened by a mid-line incision and the stomach exteriorized. The stomach was then cut, using a cauterizer (Model-100, Geiger Medical Technologies, Monarch Beach, CA, USA), along the greater curvature and everted in order to expose the gastric mucosa. Stomach content was removed by gently washing the mucosa with a saline solution. The animal was placed supine on the microscope stage of an inverted confocal microscope (Zeiss LSM 510). A portion of the exposed stomach tissue protruded into a small hole in the top coverslip of a perfusion chamber where the tissue was superfused (0.2 ml min−1) using a push-pull syringe pump. The perfusion chamber and stage were warmed in order to maintain the animal's body temperature at 37 °C.
Imaging
Our previously described procedure for rat (Chu et al. 1999) was used with minor modifications. A × 10 water immersion objective lens (0.45 NA C-APO) was used to allow quantitative imaging (with 2 μm resolution) in aqueous solutions in a Zeiss LSM510 NLO confocal microscope. An extracellular dye, Cl-NERF (Molecular Probes Inc., Eugene, OR, USA), was placed in the perfusate (150 mmNaCl + 4 mm Homopipes + 10 μm Cl-NERF) and used as a ratiometric dye to image pH at the surface of the mucosa. In a departure from previous work, the dye was alternately excited every ≈1.5 ms using argon laser wavelengths of 514 and 458 nm. The LSM510 confocal microscope separately measured the intensity of > 530 nm fluorescence emitted by Cl-NERF at both excitation wavelengths. After background values (regions of the chamber without dye) were subtracted, a ratio of fluorescence intensities was made on a pixel-by-pixel basis in resulting images (Metamorph software; Universal Imaging, West Chester, PA, USA). Ratio images were converted to pH. For calibration, droplets of solution (150 mmNaCl + 4 mm Homopipes + 10 μm Cl-NERF) of known pH were placed on the confocal stage and ratio imaged.
Chemicals
Drugs used were thiobutabarbital (Inactin, RBI, Natick, MA, USA), indomethacin, NS-398, dm-PGE2 (all from Sigma Chemical Co., St Louis, MO, USA), Homopipes (Research Organics Inc., Cleveland, OH, USA), and omeprazole (a gift from Jonathan D. Kaunitz, University of California, Los Angeles, CA, USA). Indomethacin was dissolved in absolute ethanol and then diluted with saline to the desired concentration (final [ETOH] < 0.1 %). Omeprazole was suspended in 0.5 % carboxymethylcellulose in water to the desired concentration. NS-398 was diluted in 1:1 DMSO:saline to the desired concentration. SC-560 was dissolved in 7.5 % Tween-80 in saline to the desired concentration. All other reagents were dissolved in saline. None of the vehicles affected baseline secretion except the 1:1 DMSO:saline, which tended to decrease baseline alkali secretion.
Statistics
Data are presented as means ± s.e.m. from experiments performed in separate animals. Student's paired, two-tailed t test was used for statistical comparisons between paired results, where each animal was its own control before and after a treatment. A value of P < 0.05 was considered significant.
Results
The mouse stomach converts from a net acid to a net alkali secretory organ in response to changes in luminal pH
The intact stomachs of anaesthetized mice were perfused with weakly buffered saline solutions and gastric effluent pH was measured during constant perfusion or directly after a 10 min stop flow. When the lumen of the mouse stomach was perfused with a pH 5.00 ± 0.02 (n = 5) solution, the gastric effluent had a pH of 4.89 ± 0.06. After pausing perfusion for 10 min (to let gastric secretions accumulate), a significant drop in pH from 4.89 ± 0.06 to 4.27 ± 0.37 was seen in the gastric effluent after restarting flow. Results from a typical experiment are shown in Fig. 1A. The transient acidic spike indicates a net acid secretion by the mouse stomach in response to a luminal pH 5. In contrast, when the stomach was perfused with a pH 3.00 ± 0.02 (n = 5) solution (mimicking the luminal pH of a fasted stomach), a significant increase in pH from 3.02 ± 0.22 to 3.30 ± 0.11 was seen in the gastric effluent after a 10 min stop flow (Fig. 1B). The transient alkaline spike indicates a net alkaline secretion by the stomach in response to a luminal pH 3. These data suggest that, similar to the rat stomach (Coskun et al. 2001), the mouse stomach switched from a net alkali secretion to a net acid secretion in response to increases in luminal pH. Figure 1C presents a representative experiment, showing the time course of equilibration in the gastric effluent after luminal pH is altered (10-20 min) and documenting that the mouse stomach can switch from net alkali secretion to net acid secretion (and vice versa) within 30 min of exposure to altered luminal pH.
Figure 1. Representative stop flow experiment.
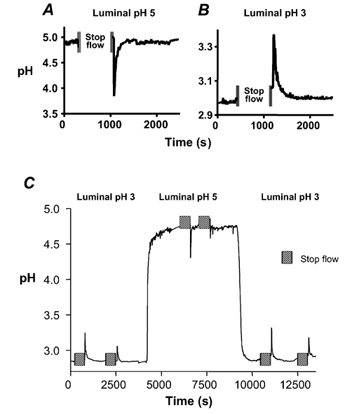
The whole stomach of an anaesthetized mouse was perfused with a weakly buffered saline solution of either pH 5 (A) or pH 3 (B) at 0.2 ml min−1 as described in Methods. The pH of the gastric effluent was measured using a pH electrode. The perfusion was stopped for 10 min to allow accumulation of gastric secretion. When the perfusion was started, a transient spike in pH was seen. In another animal, the entire pH recording is shown, documenting that the transition from net alkali to net acid secretion (and vice versa) is seen within 30 min of switching the pH of the perfusate (C).
Although a 10 min stop flow is a useful tool for qualitatively determining net stomach secretion, the resulting transients were not ideal for quantitative analysis of gastric secretion. Therefore, we sought to develop a more quantitative technique.
‘Slow flow’ for quantitative analysis of gastric secretions
To quantify the net acid/alkali secretion into the gastric lumen per minute, we transiently slowed (rather than halted) the perfusion rate. By comparing the resulting steady-state change in effluent pH due to gastric secretions, it is possible to calculate the proton or base equivalent (in nmol (l perfusate)−1) added to the solution (see Appendix). To validate this method, we varied perfusion rate. Results from a representative experiment are shown in Fig. 2, when the perfusion rate was changed from 0.2 to 0.1, 0.05 or 0.025 ml min−1. We compared results from a 2-fold change in perfusion rate versus a 4-fold change in perfusion rate. We predicted that the change in pH (ΔpH) caused by slowing flow 2-fold would be half of the ΔpH caused by slowing the flow 4-fold. As predicted, the pH of the gastric effluent changed by 0.45 ± 0.03 (n = 29)-fold, which was not significantly different from the theoretical value of 0.5-fold. Thus, we concluded that the amount of proton or base equivalent secreted per minute could be reliably determined using the slow flow method.
Figure 2. Representative slow flow experiment.
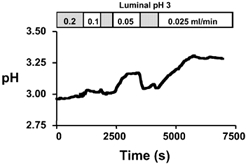
The whole stomach of an anaesthetized mouse was perfused with a weakly buffered saline solution of pH 3 at 0.2 ml min−1. The pH of the gastric effluent was measured using a pH electrode. At the indicated times, the perfusion was slowed to 0.1, 0.05, and 0.025 ml min−1 (returning to 0.2 ml min−1 between each slow flow) and allowed to reach a steady-state pH.
We applied the slow flow method to evaluate the conversion between net acid and net alkali secretion in more detail. Results in Fig. 3A show that significant net alkali secretion was observed at all luminal pH values < 4.5 and net acid secretion was seen at pH values > 5. Results demonstrate a ‘set point’ pH between 4 and 5 at which average net flux is zero. A more precise estimate of this value was not attempted because variability among animals suggested it would not be a uniquely determined value. For instance, at pH 4, 25 % of the animals spontaneously demonstrated acid secretion and at pH 5, 8 % of the animals spontaneously demonstrated alkali secretion (Fig. 3B).
Figure 3. Set point for conversion of net alkali to net acid secretion in mouse stomach.
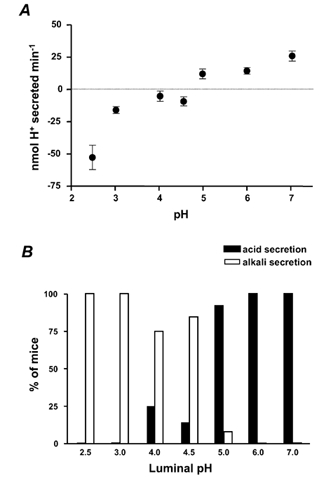
A, whole stomachs of anaesthetized mice were perfused with a weakly buffered saline solution of pH 2.5 to 7.0 at 0.2 ml min−1. The pH of the gastric effluent was measured using a pH electrode. The perfusion speed was transiently slowed to 0.05 ml min−1. The resultant steady-state pH change and the buffering capacity of the solution were used to determine the net amount of acid or alkali added to the gastric effluent, using eqn (A4) in the Appendix (means ± s.e.m., n = 6-12 animals). Negative values indicate net alkali secretion. B, percentage of mice that secreted net acid versus net alkali in the baseline condition following exposure to various luminal pH values (n = 6-12 animals tested at each pH value).
Modest changes in gastric secretion detected with slow flow
To confirm that the slow flow method was sensitive enough to detect decreases in net alkali secretion below basal levels, we performed slow flow to measure the effect of indomethacin (a non-specific COX inhibitor) at luminal pH 3. Results from a representative experiment are shown in Fig. 4. In the absence of indomethacin, a significant increase in pH was observed when the perfusion speed was slowed from 0.2 to 0.05 ml min−1, indicating a net alkali secretion (Fig. 4A). Sixty minutes after indomethacin was administered (5 mg kg−1i.p.), the change in pH during slow flow was significantly blunted, suggesting an inhibition of alkaline secretion (Fig. 4B). These data suggested that the slow flow method can detect modest changes in the basal secretions of mouse stomach, and encouraged more extensive study on the role of endogenous COX activity.
Figure 4. Effect of indomethacin on basal secretion at luminal pH 3.
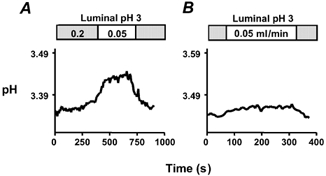
The whole stomach of an anaesthetized mouse was perfused with a weakly buffered saline solution of pH 3 at 0.2 ml min−1. The pH of the gastric effluent was measured using a pH electrode. The perfusion was transiently slowed to 0.05 ml min−1 in the absence of indomethacin (A) or 60 min after addition of indomethacin (B).
Endogenous COX activity is required for basal alkali secretion in the mouse stomach
A series of slow flow experiments evaluated the role of endogenous COX activity. For simplicity, rates of net alkali secretion are given in units of nmol OH− equivalent min−1 to avoid the use of ‘negative proton secretion’ values. At baseline conditions, an alkali secretion of 15.5 ± 1.6 nmol OH− min−1 (n = 16) was seen in response to luminal pH 3. Results were compared 1 h after administration of 5 mg kg−1 indomethacin (to inhibit all COX isoforms), 10 mg kg−1 SC-560 (a COX-1 isoform inhibitor), or 10 mg kg−1 NS-398 (a COX-2 inhibitor) (Kato et al. 2001). As shown in Fig. 5, indomethacin and SC-560 caused substantial and similar inhibition of alkaline secretion. Results suggest that endogenous activity of COX-1 regulates alkali secretion.
Figure 5. Effect of COX-1 and COX-2 inhibitors on alkali secretion.
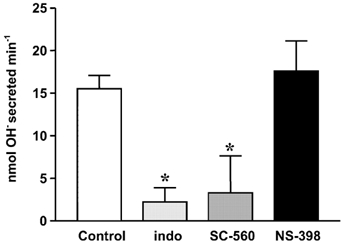
Whole stomachs of anaesthetized mice were perfused with a weakly buffered saline solution of pH 3 at 0.2 ml min−1. The perfusion speed was slowed to 0.1 or 0.05 ml min−1 and the pH change and the buffering capacity of the solution were used to determine the net amount of alkali added to the gastric effluent (see Appendix). Indomethacin (5 mg kg−1, n = 5), a COX-1 inhibitor (SC-560; 10 mg kg−1, n = 6), or a COX-2 inhibitor (NS-398; 10 mg kg−1, n = 5) was added and after 60 min slow flow was used to determine net alkali secretion compared with that in the absence of any drug (control, n = 16). (Means ± s.e.m., * P < 0.05versus control.)
We then asked whether COX activity regulated both acid and alkali secretion. Table 1 compiles results from a series of experiments in the presence versus absence of H+,K+-ATPase inhibition. As shown in the first row of Table 1, indomethacin produced the expected inhibition of alkali secretion in baseline conditions. To confirm that this decrease in alkali secretion was due to inhibition of COX activity and not tissue damage, exogenous dm-PGE2 was administered (0.1 mg kg−1i.p.) to circumvent the COX blockade. In the presence of dm-PGE2, alkali secretion was stimulated to 21.8 ± 2.7 nmol OH− min−1. This indicates that the alkali secretory mechanism was still intact in the presence of indomethacin and further showed that PGE2 was sufficient to stimulate the mechanism. Since the anticipated effects of indomethacin to increase acid secretion (Ligumsky et al. 1983; Ranta-Knuuttila et al. 1996; Wallace & Granger, 1996) or decrease bicarbonate secretion (Turnberg, 1987; Ranta-Knuuttila et al. 1996; Wallace & Granger, 1996; Flemstrom & Isenberg, 2001) produce qualitatively similar effects on net gastric acid/alkali secretion, results were compared after suppression of acid secretion (60 mg kg−1i.p., omeprazole to inhibit H+,K+-ATPase). Results (Table 1, first column) show that the addition of omeprazole led to an increase in net alkali secretion, suggesting that both acid and alkali secretion are active in the basal state at luminal pH 3. Results also show that the decrement in net alkali secretion caused by indomethacin was similar in the presence and absence of acid secretion (10.5 ± 2.7 vs. 16.4 ± 3.4 nmol OH− min−1 respectively, P = 0.21). These results suggest that endogenous COX activity predominantly regulates basal alkali secretion during luminal pH 3 conditions, with no resolvable effect on net acid secretion in mice.
Table 1.
Effect of indomethacin on alkali secretion
| Control | Indomethacin | Indo + dm-PGE2 | |
|---|---|---|---|
| Untreated | 12.7 ± 2.8 | 2.2 ± 1.7* | 21.8 ± 2.7 |
| + Omeprazole | 29.4 ± 4.5 | 13.0 ± 4.0* | 20.1 ± 3.4 |
Results are given as nmol OH−1 min−1. Whole stomachs of anaesthetized mice were perfused with a weakly buffered saline solution of pH 3 at 0.2 ml min−1. Tissues were either untreated or exposed to 60 mg kg−1 omeprazole I.P. for 60 min. The perfusion speed was slowed to 0.1ml min−1 and the pH change and buffering capacity of the solution used to determine the net amount of alkali added to the gastric effluent (see Appendix). Indomethacin (5 mg kg−1) was then added I.P., and after 60 min slow flow was again used to measure net alkali secretion. Finally, 0.1mg kg−1 dm-PGE2 was added I.P. and slow flow was used to measure net alkali secretion in the following 10 min.
Means ± s.e.m., n = 4
P < 0.05versus control.)
pH at the gastric mucosal surface can be measured using Cl-NERF
Experiments were performed to correlate whole stomach secretions with events directly at the gastric surface. To measure surface pH, we used confocal microscopy and a pH-sensitive dye to report pH adjacent to the gastric mucosal surface of anaesthetized mice. In contrast to previous work using Lucifer Yellow as a reference dye (Chu et al. 1999), here we report the establishment of a new ratiometric measurement using Cl-NERF alone. Cl-NERF is pH sensitive when excited at 514 nm and relatively pH insensitive when excited at 458 nm, so the ratio of fluorescence intensity at the two different excitation wavelengths can be used to accurately measure pH. We found the Cl-NERF ratio to be most sensitive to pH between pH 3 and 5 (Fig. 6).
Figure 6. Calibration curve for Cl-NERF fluorescence intensity ratio versus pH, determined on the confocal microscope.
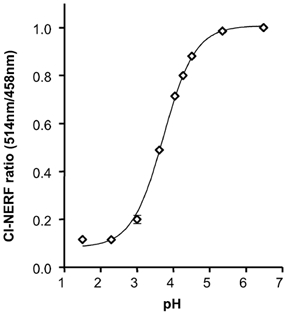
After adjustment to the indicated value of pH, droplets of fresh perfusate solution, containing 10 μm Cl-NERF, were placed on the confocal microscope chamber and imaged. The ratio of fluorescence intensity at excitation wavelengths of 514 and 458 nm was calculated for each droplet and plotted versus the corresponding pH of the solution. Results are means ± s.e.m. of 6 independent determinations, with values normalized to the fluorescence ratio observed at pH 6.0.
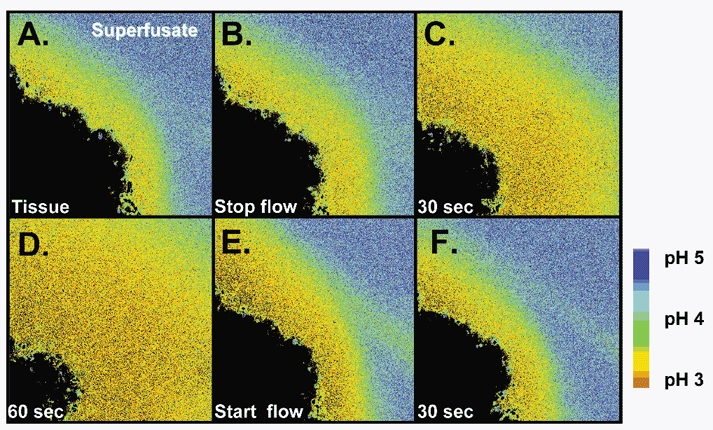
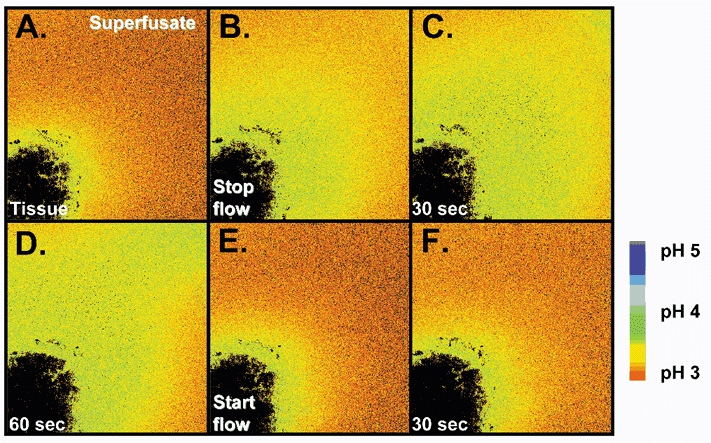
When we superfused the gastric mucosa with a pH 5 solution containing Cl-NERF, the dye reported a relatively acidic layer (pH of 3.89 ± 0.43, n = 4) directly adjacent to the surface of the mucosa, which was significantly lower than the pH at 700 μm from the surface (4.92 ± 0.14). When the perfusion was stopped, there was an increase in the thickness of the acid layer. When the perfusion was started again, the changes in the acid layer were washed away (Fig. 7). These data suggest that the stomach is continuously secreting acid in response to a luminal pH 5. When we superfused the gastric mucosa of the mouse stomach with a pH 3 solution containing Cl-NERF, we saw a relatively alkaline layer (pH of 4.19 ± 0.11, n = 10) directly adjacent to the mucosal surface that was significantly higher than the pH at 700 μm from the surface (pH 3.19 ± 0.07). When the perfusion was stopped, there was an increase in the thickness of the alkaline layer. When the perfusion was started again, the augmented alkaline layer was washed away (Fig. 8). These data suggest that the stomach is continuously secreting alkali in response to a luminal pH 3. Therefore, our confocal data confirmed that the stomach mucosa switches from net acid to net alkali secretion in response to changes in luminal pH. We also measured pH at various distances tangential to the mucosal surface during continuous 0.2 ml min−1 perfusion. In these compiled data (Fig. 9A and B), a reversal in the pH gradient could be seen in response to luminal pH 5 versus pH 3 while pH directly adjacent to the surface remained near pH 4. Results also demonstrate that the surface pH gradient can extend even 0.5 mm away from the surface during continuous superfusion.
Figure 7. Representative experiment showing gastric acid secretion determined on the confocal microscope.
The stomach of an anaesthetized mouse was exteriorized and the gastric mucosa exposed. The mucosa was placed upon a perfusion chamber on the stage of a confocal microscope and superfused (0.2 ml min−1) with a weakly buffered, Cl-NERF-containing saline solution of pH 5 (A). Superfusion was stopped (B) and images taken 30 (C) and 60 s (D) after the halt. Superfusion was subsequently re-started (E) and an image was taken 30 s later (F).
Figure 8. Representative experiment showing gastric alkali secretion seen in confocal microscope.
The stomach of an anaesthetized mouse was exteriorized and the gastric mucosa exposed. The mucosa was placed upon a perfusion chamber of a confocal microscope and superfused (0.2 ml min−1) with a weakly buffered, Cl-NERF-containing saline solution of pH 3 (A). Superfusion was stopped (B) and images taken 30 (C) and 60 s (D) after the halt. Superfusion was subsequently re-started (E) and an image was taken 30 s later (F).
Figure 9. Quantitative measurements of gastric surface pH and pH at defined distances from the surface.
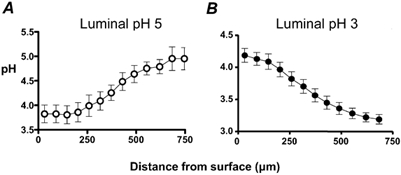
Results were compiled from the ratio images from confocal measurements of extracellular pH during continuous 0.2 ml min−1 perfusion of the gastric mucosa. pH was measured at various distances tangential to the mucosal surface during superfusion with pH 5 (A) and pH 3 (B) solutions. (Means ± s.e.m., n = 4.)
Endogenous COX activity is required for maintaining the alkaline layer at the surface of the gastric mucosa
We used confocal microscopy to determine if indomethacin caused a disruption in surface pH control during luminal pH 3 perfusion. In control conditions, the surface pH was 4.31 ± 0.07 (n = 4) in response to pH 3 superfusate. One hour after topical administration of indomethacin, the surface pH in the same preparations was significantly reduced to 3.67 ± 0.19 (P = 0.008). Similar to the whole stomach perfusion studies, exogenous dm-PGE2 was then added. After dm-PGE2 administration, the alkaline layer re-formed and the surface pH increased (4.18 ± 0.19) back toward control conditions (Fig. 10). These data suggest that indomethacin is disrupting pH control directly at the gastric surface through inactivation of cyclo-oxygenase rather than directly disrupting alkali secretory mechanisms over this time course. When we plotted the pH at various distances tangential from the mucosal surface, the pH gradient changed characteristics in response to indomethacin and dm-PGE2 treatment (Fig. 11). In all conditions, we observed a relatively alkaline pH directly at the gastric surface that gradually transitioned to a more acidic pH at 750 μm distant from the tissue surface. One way to characterize this pH gradient is to quantify the distance required for pH to get half-way between surface pH and the pH at 750 μm distant from the surface (d0.5). Besides significantly acidifying surface pH, indomethacin also significantly decreased d0.5 from 404 ± 70 μm in control conditions to 202 ± 32 μm after indomethacin. The administration of dm-PGE2 returned both surface pH and d0.5 toward control values (d0.5 = 387 ± 37 μm). These data suggest that indomethacin was disrupting both surface pH and the pH gradient near the mucosal surface.
Figure 10. Representative experiment showing acidification of gastric surface pH with indomethacin.
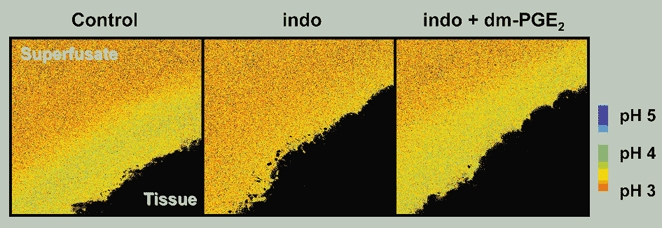
The stomach of an anaesthetized mouse was exteriorized and the gastric mucosa exposed. Extracellular pH was imaged during continuous 0.2 ml min−1 superfusion of the tissue at luminal pH 3. Sequential images were taken of the alkaline layer under baseline conditions, 1 h after indomethacin administration (indo), and 5 min after dm-PGE2 administration (indo + dm-PGE2).
Figure 11. Change in pH gradient with indomethacin.
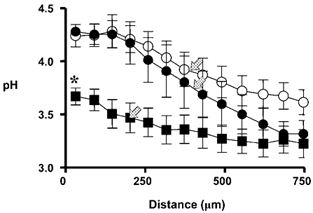
The stomachs of anaesthetized mice were exteriorized, the gastric mucosa exposed, and confocal imaging of extracellular pH performed as previously. Results are compiled from measurements made during continuous 0.2 ml min−1 superfusion at luminal pH 3. pH was measured at various distances tangential from the gastric surface under baseline conditions (•), 1 h after indomethacin administration (▪), and 5 min after dm-PGE2 administration (○). (Means ± s.e.m., n = 4 animals, *P < 0.05versus control; arrows, d0.5 as described in text.)
Discussion
This report is the first to show the dynamic switch from net alkali to net acid secretion by the intact mouse stomach in response to changes in luminal pH. We also introduce Cl-NERF as a ratiometric dye that can be used to measure gastric surface pH. Using this new model, we have been able to quantify and compare the surface pH gradient with intact stomach secretions to explore how endogenous COX activity is required for surface pH control in this pre-epithelial layer.
In the basal condition, the presence of net acid or alkali secretion by the intact stomach was tightly correlated with the absence or presence of an alkaline layer at the surface. Results from intact stomach suggested the presence of a pH set point (no net acid/alkali secretion) between pH 4 and 5. Surface pH values were also approximately pH 4 whether acid or alkali secretion predominated. Surface pH values in mice are similar to those reported in rats, using similar methodology (Chu et al. 1999). All these results suggest that the rodent stomach uses a set point pH near 4 as a pivotal value for the regulation of acid and alkali secretion. Why the pH at the surface would be maintained at pH 4 is unknown. We speculate that pH 4 is a protective pH that kills most harmful bacteria, but is not damaging to surface epithelial cells. It may be noteworthy that H. pylori produce urease, which confers survival of the pathogen in an environment of pH 4 and below (Clyne et al. 1995; Meyer-Rosberg et al. 1996). The previous suggestion of a constant surface pH near 7 is more difficult to reconcile with the pathogen's urease requirement for colonization of the stomach (Eaton & Krakowka, 1994; Tsuda et al. 1994). The ability of surface epithelial cells to survive a pH 4 environment is probably due to a proton-impermeable apical cell membrane and proton-impermeable tight junctions (Skillman & Silen, 1972; Wallace, 1989; Wallace & Granger, 1996; Flemstrom & Isenberg, 2001). Our results strongly suggest the presence of one or more luminal pH sensors that can inversely regulate acid and alkali secretion, in order to maintain a constant pH directly at the surface of the stomach. The molecular nature of the sensor remains unknown, although the intricate regulatory networks controlling acid and bicarbonate secretion provide a number of logical targets.
Our studies in rats and mice provide only limited insight onto the transport mechanisms regulating luminal and surface pH changes in response to step changes in luminal pH. H+,K+-ATPase is implicated as the relevant acid secretory mechanism due to the ability of omeprazole to block acid secretion (in mouse or rat) or an acidic surface pH (in rat), and the ability of gastrin to stimulate the acidic surface (in rat) (Chu et al. 1999; Coskun et al. 2001). Bicarbonate transport is directly implicated as the rat alkali secretory mechanism, because the total amount of HCO3− + CO2 added to the lumen precisely matches the amount of alkali reaching the lumen (Coskun et al. 2001). At the luminal pH values used here, secreted bicarbonate is almost entirely converted into CO2 and H2O at the cost of proton consumption, causing an alkalinization. It is important to note that simple CO2 diffusion from the tissue to the lumen is unlikely to explain our results. Any CO2 diffusing into the lumen from the tissue would either remain as CO2 (no change in pH) or be combined with H2O and converted to H+ and HCO3− to cause an acidification. Since omeprazole eliminates all net acidification, and alkali secretion is quantitatively explained by bicarbonate transport, effects due to CO2 diffusion appear immeasurable in our system. While it would be ideal to confirm the changes of total luminal HCO3− + CO2 in the mouse gastric effluent, the rates of secretion appear too low for us to make these (blood gas analyser) measurements.
Our study confirms the widely accepted idea that a relatively alkaline layer forms at the surface of the stomach, most likely due to epithelial bicarbonate secretion (Flemstrom, 1977; Flemstrom & Garner, 1982; Takeuchi et al. 1982). However, our results differ from microelectrode studies that show a near neutral pH directly at the surface of the stomach (Ross et al. 1981; Ross & Turnberg, 1983; Takeuchi et al. 1983; Turnberg, 1987; Schade et al. 1994; Synnerstad et al. 2001). The difference in surface pH values may be due to the nature of the different techniques. Manually inserting microelectrodes into the tightly adherent mucous layer may perturb the layer, or the electrodes may not give accurate pH readings within the mucus. For instance, open tipped microelectrodes might become sealed by mucus so that the protonophoric mechanisms of the electrode only remove protons from the recessed tip fluid and hence alkalinize the small volume of aqueous fluid at the tip. Some microelectrodes report a more acidic surface pH (Schreiber et al. 2000) when using a smaller tip diameter and advancing the microelectrodes at a high acceleration. Our studies have used a less invasive technique to determine surface pH and we have previously shown that values remain accurate in mucus (Chu et al. 1999). The surface pH values in the current study are similar to the pH values we previously reported in rats, using a similar methodology of pH-sensitive fluorescent dyes and confocal microscopy (Takeuchi et al. 1997; Chu et al. 1999). However, in the current work, we have increased the rigor of the quantitative analysis by relying on the ratiometric measurements from only a single dye (Cl-NERF), rather than having to utilize a second reference dye for analysis. This removes concern about the requirement for equal distribution of the two dyes.
Studies in pharmacologically acid-suppressed mouse stomach have demonstrated that bicarbonate/alkali secretion is regulated by prostaglandins (Takeuchi et al. 1997). In contrast to this work, we have used an acidic luminal pH to more physiologically shift the balance toward net alkali secretion. In this luminal pH 3 condition, addition of omeprazole to intact stomach unmasked greater net alkali secretion, suggesting that both acid and alkali secretion normally contribute to gastric secretions at luminal pH 3. Further, the ability of indomethacin to block similar amounts of alkali secretion in either the presence or absence of omeprazole suggests that inhibition of COX only affects alkali, and not acid, secretion at this luminal pH.
To assay the general role of COX activity, we have used indomethacin to block both COX-1 and COX-2 isoforms. Studies have shown that COX-1 is the predominant isoform expressed in the stomach during normal conditions, providing homeostatic and cytoprotective functions (Atay et al. 2000; Jackson et al. 2000). COX-2 expression has been shown to rapidly increase during mucosal damage and repair (Atay et al. 2000; Jackson et al. 2000). Recent observations, however, have shown that COX-1 can also be induced and that COX-2 is constitutively expressed and may play a homeostatic role (Langenbach et al. 1999; Atay et al. 2000). Studies have also reported that COX-1 knockout mice do not exhibit spontaneous gastric ulcers (Langenbach et al. 1999; Hawkey, 2000; Wallace et al. 2000), raising controversy as to what roles each isoform plays in protecting the stomach from damage. In our mouse model, use of a COX-1 specific inhibitor (SC-560), but not a COX-2 specific inhibitor (NS-398), replicated effects of indomethacin on whole stomach secretions (Kato et al. 2001). This suggests that the COX-1 isoform is required for pH regulation, but the conclusion needs to be confirmed in mutant mice that lack a specific COX isoform so that the specificity of drugs and pH effects can be rigorously assessed.
In summary, we have shown that the juxtamucosal alkaline layer is regulated by the action of endogenous COX activity on alkali secretory mechanisms. When COX enzymes are blocked, the pH gradient is greatly reduced. Not only does the pH significantly drop directly at the surface of the mucosa, but the pH gradient extending from the surface also becomes much shallower. These observations suggest a disruption in surface pH control in response to the absence of endogenous COX activity. Our results are similar to the observations by Ross et al. in which pH at the gastric surface in rats was reduced in response to luminal solution containing aspirin and this acidified surface pH response was inhibited by pretreatment with 16,16-dmPGE2 (Ross et al. 1981; Ross & Turnberg, 1983). Our results support the hypothesis that prostaglandins play a key role in regulating the gastric surface pH in the mouse stomach, and that the major regulatory target of COX activity is the alkali secretory mechanism.
Acknowledgments
We gratefully acknowledge the National Institutes of Health (RO1DK 54940) for financial support. H.K.B. is supported by a Predoctoral Fellowship from the American Heart Association.
APPENDIX
Calculating the rate of acid/base secretion by the stomach, based on pH changes in the gastric effluent during defined changes in perfusion flow rate
Our goal is to calculate:
mol H+ secreted by stomach per minute = X.
To keep discussion simple, the derivation below refers to acid secretion; with the recognition that net proton consumption (a ‘negative acid secretion’ in the formalism below) is equivalent to net alkali secretion.
The direct way to calculate X is by reference to the pH of fresh perfusates (pHf). Compared to this standard value, all the protons added to the solution are known to come from only one source, the stomach. In this case, at perfusion speed Y (l min−1), where the pH in the effluent (pHy) can be compared with pHf:
| (A1) |
In eqn (A1), buffering capacity in the gastric effluent is approximated as the value at the mid-point between pHy and pHf (βmid-yf), and both sides of the equation have units of moles H+ secreted per litre from the entire stomach. If we know pHf, this equation is sufficient to derive values for X. This equation is valid for any perfusion speed, so at a second perfusion speed Z (l min−1) the pH in the effluent (pHz) can also be compared to pHf in exactly the same way:
| (A2) |
If pHf is known, either eqn (A1) or eqn (A2) could be used to estimate X. We have found that estimates of pHf are not ideal for comparison with flow experiments because of the small pH changes involved (Coskun et al. 2001). Therefore we have used these two equations to eliminate pHf from our calculations. To do so, we need to make the assumption that over the small pH changes observed during slow flow (typically less than 0.2 pH units), β is a constant. That is:
With this assumption, we can subtract eqn (A2) from eqn (A1) and get:
| (A3) |
| (A4) |
This equation can be used to calculate X based on knowledge of the buffering capacity (βmid-zy≃β‘), the ΔpH of the effluent at two different flow rates, and the values of the two different flow rates. Note: net acid secretion gives positive X, alkali secretion gives negative X.
References
- Arakawa T, Higuchi K, Fukuda T, Fujiwara Y, Kobayashi K, Kuroki T. Prostaglandins in the stomach: an update. Journal of Clinical Gastroenterology. 1998;27(suppl. 1):S1–S11. doi: 10.1097/00004836-199800001-00003. [DOI] [PubMed] [Google Scholar]
- Atay S, Tarnawski AS, Dubois A. Eicosanoids and the stomach. Prostaglandins and Other Lipid Mediators. 2000;61:105–124. doi: 10.1016/s0090-6980(00)00067-8. [DOI] [PubMed] [Google Scholar]
- Bahari HMM, Ross IN, Turnberg LA. Demonstration of a pH gradient across the mucus layer on the surface of human gastric mucosa in vitro. Gut. 1982;23:513–516. doi: 10.1136/gut.23.6.513. [DOI] [PMC free article] [PubMed] [Google Scholar]
- Chu S, Tanaka S, Kaunitz JD, Montrose MH. Dynamic regulation of gastric surface pH by luminal pH. Journal of Clinical Investigation. 1999;103:605–612. doi: 10.1172/JCI5217. [DOI] [PMC free article] [PubMed] [Google Scholar]
- Clyne M, Labigne A. Helicobacter pylori requires an acidic environment to survive in the presence of urea. Infection and Immunity. 1995;63:1669–1673. doi: 10.1128/iai.63.5.1669-1673.1995. [DOI] [PMC free article] [PubMed] [Google Scholar]
- Coskun T, Chu S, Montrose MH. Intragastric pH regulates conversion from net acid to net alkali secretion by the rat stomach. American Journal of Physiology - Gastrointestinal and Liver Physiology. 2001;281:G870–877. doi: 10.1152/ajpgi.2001.281.4.G870. [DOI] [PubMed] [Google Scholar]
- Eaton KA, Krakowka S. Effect of gastric pH on urease-dependent colonization of gnotobiotic piglets by Helicobacter pylori. Infection and Immunity. 1994;62:3604–3607. doi: 10.1128/iai.62.9.3604-3607.1994. [DOI] [PMC free article] [PubMed] [Google Scholar]
- Engel E, Guth PH, Nishizaki Y, Kaunitz JD. Barrier function of the gastric mucus gel. American Journal of Physiology. 1995;269:G994–999. doi: 10.1152/ajpgi.1995.269.6.G994. [DOI] [PubMed] [Google Scholar]
- Flemstrom G. Active alkalinization by amphibian gastric fundic mucosa in vitro. American Journal of Physiology. 1977;233:E1–12. doi: 10.1152/ajpendo.1977.233.1.E1. [DOI] [PubMed] [Google Scholar]
- Flemstrom G, Garner A. Gastroduodenal HCO3- transport: characteristics and proposed role in acidity regulation and mucosal protection. American Journal of Physiology. 1982;242:G183–193. doi: 10.1152/ajpgi.1982.242.3.G183. [DOI] [PubMed] [Google Scholar]
- Flemstrom G, Isenberg JI. Gastroduodenal mucosal alkaline secretion and mucosal protection. News in Physiological Sciences. 2001;16:23–28. doi: 10.1152/physiologyonline.2001.16.1.23. [DOI] [PubMed] [Google Scholar]
- Fujimoto M, Matsumura Y. General properties of antimony microelectrode in comparison with glass microelectrode for pH measurement. Japanese Journal of Physiology. 1980;30:491–508. doi: 10.2170/jjphysiol.30.491. [DOI] [PubMed] [Google Scholar]
- Goddard PJ, Kao YC, Lichtenberger LM. Luminal surface hydrophobicity of canine gastric mucosa is dependent on a surface mucous gel. Gastroenterology. 1990;98:361–370. doi: 10.1016/0016-5085(90)90826-m. [DOI] [PubMed] [Google Scholar]
- Hawkey CJ. Nonsteroidal anti-inflammatory drug gastropathy. Gastroenterology. 2000;119:521–535. doi: 10.1053/gast.2000.9561. [DOI] [PubMed] [Google Scholar]
- Jackson LM, Wu KC, Mahida YR, Jenkins D, Hawkey CJ. Cyclooxygenase (COX) 1 and 2 in normal, inflamed, and ulcerated human gastric mucosa. Gut. 2000;47:762–770. doi: 10.1136/gut.47.6.762. [DOI] [PMC free article] [PubMed] [Google Scholar]
- Kato M, Nishida S, Kitasato H, Sakata N, Kawai S. Cyclooxygenase-1 and cyclooxygenase-2 selectivity of non-steroidal anti-inflammatory drugs: investigation using human peripheral monocytes. Journal of Pharmacy and Pharmacology. 2001;53:1679–1685. doi: 10.1211/0022357011778070. [DOI] [PubMed] [Google Scholar]
- Langenbach R, Loftin C, Lee C, Tiano H. Cyclooxygenase knockout mice: models for elucidating isoform-specific functions. Biochemical Pharmacology. 1999;58:1237–1246. doi: 10.1016/s0006-2952(99)00158-6. [DOI] [PubMed] [Google Scholar]
- Ligumsky M, Goto Y, Debas H, Yamada T. Prostaglandins mediate inhibition of gastric acid secretion by somatostatin in the rat. Science. 1983;219:301–312. doi: 10.1126/science.6129701. [DOI] [PubMed] [Google Scholar]
- Ligumsky M, Grossman MI, Kauffman GL., Jr Endogenous gastric mucosal prostaglandins: their role in mucosal integrity. American Journal of Physiology. 1982;242:G337–341. doi: 10.1152/ajpgi.1982.242.4.G337. [DOI] [PubMed] [Google Scholar]
- Matsueda K, Muraoka A, Umeda N, Misaki N, Uchida M, Kawano O. Effect of the luminal hydrogen ion on alkali and mucus secretion in the rat stomach. Scandinavian Journal of Gastroenterology. 1989;24(suppl. 162):35–38. doi: 10.3109/00365528909091119. [DOI] [PubMed] [Google Scholar]
- Meyer-Rosberg K, Scott DR, Rex D, Melchers K, Sachs G. The effect of environmental pH on the proton motive force of Helicobacter pylori. Gastroenterology. 1996;111:886–900. doi: 10.1016/s0016-5085(96)70056-2. [DOI] [PubMed] [Google Scholar]
- Nagano F, Masaki H, Fujimoto M, Kotera K, Yonehara T, Ohshiba S. Effects of H+ and HCO3− secretion on mucus gel pH in isolated antral mucosa of bullfrog stomach. Bulletin of the Osaka Medical College. 1990;36:13–25. [PubMed] [Google Scholar]
- Patronella CK, Vanek I, Bowen JC. In vivo measurement of gastric mucus pH in canines: effect of high luminal acidity and prostaglandin E2. Gastroenterology. 1988;95:612–618. doi: 10.1016/s0016-5085(88)80005-2. [DOI] [PubMed] [Google Scholar]
- Ranta-Knuuttila T, Mustonen H, Kivilaasko E. High systemic HCO3− and topical 16,16-dimethyl-PGE2 protect gastric mucosa against luminal acid by enhancing its pre-epithelial buffer capacity. Digestive Diseases and Sciences. 1996;41:492–497. doi: 10.1007/BF02282324. [DOI] [PubMed] [Google Scholar]
- Robert A, Nezamis JE, Lancaster C, Hanchar AJ. Cytoprotection by prostaglandins in rats. Gastroenterology. 1979;77:433–443. [PubMed] [Google Scholar]
- Ross IN, Bahari HM, Turnberg LA. The pH gradient across mucus adherent to rat fundic mucosa in vivo and the effect of potential damaging agents. Gastroenterology. 1981;81:713–718. [PubMed] [Google Scholar]
- Ross IN, Turnberg LA. Studies of the ‘mucus-bicarbonate’ barrier on rat fundic mucosa: the effects of luminal pH and a stable prostaglandin analogue. Gut. 1983;24:1030–1033. doi: 10.1136/gut.24.11.1030. [DOI] [PMC free article] [PubMed] [Google Scholar]
- Schade C, Flemstrom G. Hydrogen ion concentration in the mucus layer on top of acid-stimulated and -inhibited rat gastric mucosa. Gastroenterology. 1994;107:180–188. doi: 10.1016/0016-5085(94)90075-2. [DOI] [PubMed] [Google Scholar]
- Schreiber S, Nguyen TH, Stuben M, Scheid P. Demonstration of a pH gradient in the gastric gland of the acid-secreting guinea pig mucosa. American Journal of Physiology - Gastrointestinal and Liver Physiology. 2000;279:G597–604. doi: 10.1152/ajpgi.2000.279.3.G597. [DOI] [PubMed] [Google Scholar]
- Skillman JJ, Silen W. Gastric mucosal barrier. Surgery Annual. 1972;4:213–237. [PubMed] [Google Scholar]
- Suetsugu H, Ishihara S, Moriyama N, Kazumori H, Adachi K, Fukuda R, Watanabe M, Kinoshita Y. Effect of rebamipide on prostaglandin EP4 receptor gene expression in rat gastric mucosa. Journal of Laboratory and Clinical Medicine. 2000;136:50–57. doi: 10.1067/mlc.2000.107303. [DOI] [PubMed] [Google Scholar]
- Sun W, Tsuji S, Tsujii M, Gunawan ES, Kawai N, Kimura A, Kakiuchi Y, Yasumaru M, Iijima H, Okuda Y, Sasaki Y, Hori M, Kawano K. Induction of cyclooxygenase-2 in rat gastric mucosa by rebamipide, a mucoprotective agent. Journal of Pharmacology and Experimental Therapeutics. 2000;295:447–452. [PubMed] [Google Scholar]
- Synnerstad I, Johansson M, Nylander O, Holm L. Intraluminal acid and gastric mucosal integrity: the importance of blood-borne bicarbonate. American Journal of Physiology - Gastrointestinal and Liver Physiology. 2001;280:G121–129. doi: 10.1152/ajpgi.2001.280.1.G121. [DOI] [PubMed] [Google Scholar]
- Takahashi S, Fujita T. Role of cyclooxygenase-2 in Helicobacter pylori-induced gastritis in Mongolian gerbils. American Journal of Physiology - Gastrointestinal and Liver Physiology. 2000;279:G791–798. doi: 10.1152/ajpgi.2000.279.4.G791. [DOI] [PubMed] [Google Scholar]
- Takahashi S, Takeuchi K. EP4 receptor mediation of prostaglandin E2-stimulated mucus secretion by rabbit gastric epithelial cells. Biochemical Pharmacology. 1999;58:1997–2002. doi: 10.1016/s0006-2952(99)00286-5. [DOI] [PubMed] [Google Scholar]
- Takeuchi K, Magee D, Critchlow J, Matthews J, Silen W. Studies of the pH gradient and thickness of frog gastric mucus gel. Gastroenterology. 1983;84:331–340. [PubMed] [Google Scholar]
- Takeuchi K, Merhav A. Mechanism of luminal alkalinization by bullfrog fundic mucosa. American Journal of Physiology. 1982;243:G377–388. doi: 10.1152/ajpgi.1982.243.5.G377. [DOI] [PubMed] [Google Scholar]
- Takeuchi K, Yagi K, Kato S, Ukawa H. Roles of prostaglandin E-receptor subtypes in gastric and duodenal bicarbonate secretion in rats. Gastroenterology. 1997;113:1553–1559. doi: 10.1053/gast.1997.v113.pm9352857. [DOI] [PubMed] [Google Scholar]
- Tsuda M, Karita M, Morshed MG, Okita K, Nakazawa T. A urease-negative mutant of Helicobacter pylori constructed by allelic exchange mutagenesis lacks the ability to colonize the nude mouse stomach. Infection and Immunity. 1994;62:3586–3589. doi: 10.1128/iai.62.8.3586-3589.1994. [DOI] [PMC free article] [PubMed] [Google Scholar]
- Turnberg LA. Gastric mucus, bicarbonate and pH gradients in mucosal protection. Clinical and Investigative Medicine. 1987;10:178–180. [PubMed] [Google Scholar]
- Wallace JL. Gastric resistance to acid: is the ‘mucus-bicarbonate barrier' functionally redundant? American Journal of Physiology. 1989;256:G31–38. doi: 10.1152/ajpgi.1989.256.1.G31. [DOI] [PubMed] [Google Scholar]
- Wallace JL, Granger DN. The cellular and molecular basis of gastric mucosal defense. FASEB Journal. 1996;10:731–740. doi: 10.1096/fasebj.10.7.8635690. [DOI] [PubMed] [Google Scholar]
- Wallace JL, McKnight W, Reuter BK, Vergnolle N. NSAID-induced gastric damage in rats: requirement for inhibition of both cyclooxygenase 1 and 2. Gastroenterology. 2000;119:706–714. doi: 10.1053/gast.2000.16510. [DOI] [PubMed] [Google Scholar]
- Williams SE, Turnberg LA. Demonstration of a pH gradient across mucus adherent to rabbit gastric mucosa: evidence for a ‘mucus-bicarbonate’ barrier. Gut. 1981;22:94–96. doi: 10.1136/gut.22.2.94. [DOI] [PMC free article] [PubMed] [Google Scholar]