

Abstract
In the retina, amacrine cells modulate the transfer of information from bipolar to ganglion cells. The nature of the modulation depends on the synaptic input and the membrane properties of the cells. In the retina of white bass, we identified a class of bistratified, wide-field amacrine cell characterized by immunopositive labelling for GABA and calmodulin. In isolation, the cells presented resting membrane potentials averaging -69 mV although some cells settled at more depolarized values (-30 mV). Injection of depolarizing current pulses induced oscillatory membrane responses. When elicited from depolarized cells, the oscillations were short-lived (< 40 ms). For the most part, the oscillatory potentials of hyperpolarized cells remained unattenuated throughout the depolarizing pulse. The frequency of the oscillations increased logarithmically with mean membrane potential, ranging from 74 to 140 Hz. Cells exhibiting depolarized membrane potentials oscillated at twice that rate. When the membrane potential of these cells was hyperpolarized to -70 mV, the oscillations became unattenuated and slowed. We found the cells expressed voltage-gated sodium, potassium and calcium currents and calcium-dependent potassium currents. We demonstrate that the oscillatory potentials arose as a result of the interplay between calcium and potassium currents. The cells responded to local application of GABA and glycine, both of which modulate the oscillatory potentials. Glutamate and its analogues depolarized the cell and induced oscillatory potentials. Our results indicate that oscillatory responses of a type of wide-field amacrine cell are an intrinsic feature of the cell and not due to circuit properties.
In the retina, the visual scene is transduced by the photoreceptors, passed to the bipolar cells and then handed to the ganglion cells to be sent to higher brain centres for processing. At the outer plexiform layer the signal is modified by lateral input from horizontal cells. Likewise, lateral input from amacrine cells in the inner plexiform layer (IPL) further transforms the signal (Masland, 1986; Dowling, 1987). The currently accepted role of the horizontal cell is to contribute to the formation of the centre-surround receptive fields seen first in bipolar cells and then in the ganglion cells (Kaneko, 1999; Kamermans et al. 2001). Much less is understood of the role of the amacrine cell in processing the visual signal. What is clear is that amacrine cells influence the communication from bipolar cells to ganglion cells to shape the ganglion cell output and that a large part of this occurs through inhibitory mechanisms (Sakai & Naka, 1990a; Yang et al. 1991; Cook & McReynolds, 1998; Roska et al. 1998; Wu & Maple, 1998; Shields & Lukasiewicz, 2001).
As typified by the salamander (Yang et al. 1991), rabbit (MacNeil & Masland, 1998) and the fish retinas (Djamgoz et al. 1990), in all species studied, an extreme morphological and functional diversity of amacrine cells has been observed. One striking feature of many classes of amacrine cell is the large extent of their dendritic spread; this can range up to hundreds of micrometres in diameter. As a result, certain classes of amacrine cell must transmit information over very great distances (i.e. ≥ 500 μm). It is not clear how this is accomplished but action potentials, or some type of regenerative response, are the prime candidates for carrying the information. Studies have shown that gated currents in some amacrine cells initiate spike activity (Barnes & Werblin, 1986; Eliasof et al. 1987). That activity is propagated in wide-field amacrine cells (Cook & Werblin, 1994; Bloomfield, 1996; Yamada et al. 2002) and spiking activity was found to be necessary for the lateral spread of inhibitory activity in the inner retina in some studies (Cook et al. 1998; Shields & Lukasiewicz, 2001) but not in others (Bieda & Copenhagen, 1999).
The interactions between synaptic input and intrinsic membrane properties will determine an amacrine cell's ability to propagate signals along its processes. While a relatively large amount of information has been gathered on amacrine cell responses to synaptic input in eyecup or retinal slice preparations (see references above), little is known of the intrinsic membrane properties of these cells although some work has been done in the chick (Gleason et al. 1993) and mouse (Feigenspan et al. 1999). Because of this we undertook a study of the biophysical characteristics of a type of wide-field amacrine cell found in the white bass retina. The cells were isolated and maintained in cell culture. Here we describe the membrane characteristics of the cell. The amacrine cell showed bistability in its resting membrane potential. Also this cell has the unique ability to generate slow spikes or oscillations in isolation when removed from the circuit and we describe the oscillatory properties of the cell. The oscillations are at the same frequency as those reported in C- and N-type amacrine cells in catfish (Sakai & Naka, 1992) and in Rutilus (Djamgoz et al. 1989) retina observed with intracellular recordings and are thought to be due to local circuit properties.
Methods
Isolation procedure
The isolation procedure followed was similar to that previously described in detail (Lasater, 1986). Briefly, white bass (Morone chrysops) were dark adapted for 2 h and then killed in accordance with Association for Research in Vision and Ophthalmology guidelines for experiments involving animals. Animals were placed in a container of water (0.5 °C) containing tricaine methanesulfonate (150 mg l−1) for 20 min. The fish was then removed, and the spinal cord was surgically transected and the brain pithed. The animals were enucleated and their retinas removed under dim red light. The retinas were then incubated in modified L-15 cell culture medium (Gibco, Rockville, MD, USA) containing 1 u ml−1 of papain (Worthington, Freehold, NJ, USA) for 45 min and then washed in fresh L-15. Further washing was achieved by rinsing the pieces of retina with a 10 ml serological pipette and expelling them into dishes with fresh L-15. This procedure was repeated and served to remove residual papain and the majority of photoreceptors. The pieces were then more vigorously triturated with Pasteur pipettes and placed into standard tissue culture dishes. This procedure was repeated until the retina was completely broken up. The dishes were placed in an incubator (10 °C) until used (from 1 to 7 days).
Experimental solutions
Before each experiment, the L-15 culture medium in the culture dish was replaced with bass Ringer solution consisting of (mm): NaCl, 130; KCl, 2.9; CaCl2, 2.13; MgCl2, 1.23; K2HPO4, 0.44; Mops, 10; glucose, 8.4; pH adjusted to 7.4 with NaOH. The patch pipette solution consisted of (mm): potassium gluconate, 130; NaCl, 4; KCl, 4; EGTA, 0.2; MgCl2, 2; Hepes, 10; and 7.8 μm CaCl2. In some of the experiments we used a caesium-based pipette solution to maximally reduce the potassium currents. This solution consisted of (mm): CsOH, 106.72; gluconic acid, 109.69; NaCl, 4; CaCl2, 1; MgCl2, 1; Hepes, 8.4; EGTA, 11; TEA-chloride, 20; pH adjusted to 7.4 with gluconic acid. The liquid-junction potentials introduced by the caesium gluconate solution were compensated for off-line. On other occasions the potassium currents were blocked by adding 10 mm TEA and 7 mm 4-aminopyridine (4-AP) to the bass Ringer solution. Voltage-gated calcium channels were blocked with 1 mm cadmium or 4 mm cobalt. Voltage-gated sodium channels were blocked with 1 μm TTX. All chemicals were purchased from Sigma (St Louis, MO, USA). Solutions were delivered via a 12-reservoir pressure ejection system controlled by a personal computer (DAD-12, ALA Scientific Instruments, NY, USA).
Recording procedures and data analysis
Whole-cell recordings (Hamill et al. 1981) were made with micropipettes pulled on a two-stage puller (model PP-83, Narishige Instruments, Tokyo, Japan) and were used unpolished and coated with Sylgard (Dow-Corning, Midland, MI, USA). The electrode tip resistance was 2-3 MΩ when measured in the bath solution. Series resistance and capacitance were compensated for electronically. Electrical potentials were recorded with an Axopatch 200A amplifier (Axon Instruments Inc., Union City, CA, USA). Data collection was controlled by a personal computer interfaced to a Digidata 1200 data acquisition system driven by the pCLAMP suite of programs (Axon Instruments). After establishing a whole-cell configuration, the cells were held at a potential (HP) of -70 mV unless otherwise indicated. Under voltage-clamp conditions, the stimuli consisted of short (60 ms) incremental and decremental voltage pulses. Under current-clamp conditions the stimuli consisted of a series of depolarizing current pulses, in most cases 40 ms in duration, applied from the resting membrane potential of the cell.
Voltage and current responses were low-pass filtered (cutoff at 2 kHz) and sampled at 5 kHz. Capacitance values were read directly from the amplifier dial following compensation. These values were in close accordance to those estimated using the area under the capacitive artifact and assigning the specific capacitance a value of 1 μF cm−2.
Analysis and plotting of data was performed with Clampfit (Axon Instruments) and SigmaPlot (SPSS, Inc., Chicago, IL, USA). Plots show average responses ± s.d. Numbers of observations were usually six or more and are indicated in the text or figure legends. The dominant frequency was determined from the power spectrum of the oscillatory responses using the Fast Fourier Transform (FFT). Plots of dominant frequency and amplitude were fitted with the fitting function:
| (1) |
where R is the response (in Hz or mV), a is a scaling or converting factor, Th is a constant and CD is current density (pA pF−1). The attenuation observed in the oscillatory potentials was estimated by fitting the response to the depolarizing pulses with the function:
| (2) |
where r(t) is the response to the current pulse, A is the amplitude, t is the time, τ is the time constant of the decay, T the period of the oscillation, Φ the phase delay, and MP is the mean membrane potential during depolarization. Fits were performed with Sigma Plot software, which applied the Marquardt-Levenberg algorithm to minimize the sum of the squared differences between the data and the power functions.
Immunostaining in whole-mount retina
Eight retinas were used for this study; four were processed for vertical sections and four for whole-mount. Eyes where cooled on ice and retinas were dissected from the eyecups. Next, the retinas were fixed in 4 % paraformaldehyde in 0.1 m phosphate buffer (PB) at pH 7.4 for 1 h and then washed in 0.1 m PB and cryoprotected in 15 % sucrose for half an hour, 20 % sucrose for 1 h and 30 % sucrose overnight at 4 °C. The following day, whole-mount retinas underwent a freeze-thaw procedure and then the retinas were placed in a solution of 1 % NaBH4 for 5 min. The retinas were incubated in 10 % normal donkey serum in 0.1 m PB-0.5 % Triton X-100 for 1 h at 4 °C. Without washing, the retinas were then incubated in primary antibody with mouse anti-Calmodulin (1:500, Sigma) in 0.1 m PB-0.5 % Triton X-100 for 4 days at 4 °C under agitation. After further washes in PB, secondary incubation took place with donkey anti-mouse IgG rhodamine (tetramethyl-rhodamine isothiocyanate; TRITC; Jackson ImmunoResearch Laboratories, West Grove, PA, USA) for 1 h at 1:100 dilution, with agitation at room temperature. The retinas were washed, mounted in Vectashield mounting medium (Vector Labs, Burlingame, CA, USA) and coverslipped for viewing by confocal microscopy (Zeiss LSM-510 microscope). Pinhole diameter was set at 77 μm giving an optical slice thickness of less than 0.9 μm. Images were viewed and captured at single planes of focus. Single plane images were z-stacked and printed on a colour printer.
Cryostat sections and isolated cells: immunofluorescence techniques
Eyecups were fixed in 4 % paraformaldehyde in 0.1 m phosphate buffer at pH 7.4 for 1 h and cryoprotected in sucrose overnight. The following day they were embedded in Tissue-Tek O.C.T. (Sakura Finetek Inc., Torrence, CA, USA) and cut into 12 μm thick radial sections on a cryostat. Cells were isolated and maintained on con-A-coated coverslips for 2-4 days before staining. Cryostat sections and isolated cells were incubated in 10 % normal donkey serum in 0.1 m PB-0.5 % Triton X-100 for 1 h at 4 °C and then transferred to either a solution of a single antibody or a mixture of two primary antibodies. The antibodies used were mouse anti-syntaxin (Chemicon, Temecula, CA, USA), mouse anti-calmodulin (Sigma), and rabbit anti-GABA and anti-glycine (gifts of Dr David Pow, University of Queensland, Brisbane, Australia), in a 1:500 dilution. After overnight incubation in the antibody mix, the sections (or isolated cells) were washed in 0.1 m PB and transferred to a cocktail of the secondary antibodies (donkey anti-rabbit IgG coupled to fluorescein (fluorescein isothiocyanate; FITC), donkey anti-mouse IgG rhodamine (TRITC) or IgG fluorescein) at 1:100 dilution in 0.1 m PB-0.5 % Triton X-100 for 1 h. Immunostained sections were again examined by confocal microscopy as described above. Control sections were obtained by omitting the primary antibody.
Results
Identification of cells
The cells reported on in this study, were identified in culture by their characteristic morphology. These cells typically had a large cell body from which radiated two to four thick processes (Fig. 1A). These processes could extend for long distances or could break up into secondary and tertiary processes. It was not unusual to find cells whose dendritic spread was between 300 and 500 μm tip to tip. In vivo the processes of these cells cover much larger distances (see below). The isolated cells we studied had had their dendritic arbor pruned to varying degrees by the isolation process. For example, a flat mount, Golgi-stained wide-field amacrine cell is shown in Fig. 1C. The cell had a dendritic morphology similar to the cultured cells, but there were many more tertiary dendrites present and the total spread was 760 μm. Note also the out of focus processes. These emanated as secondary branches from primary dendrites and penetrated deeper into the inner plexiform layer.
Figure 1. Wide-field amacrine cells of the white bass retina.
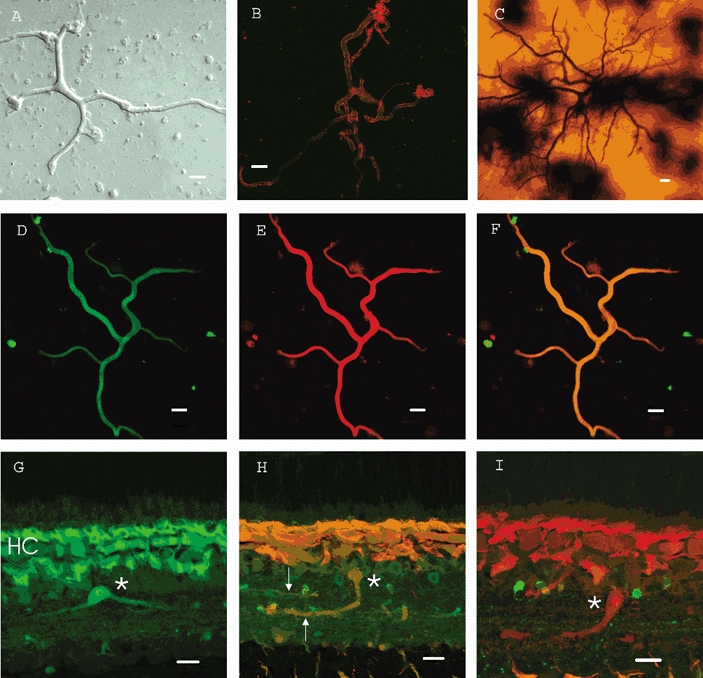
A, isolated cell in culture. This cell is typical of those we recorded from with more complete morphologies. B, wide-field amacrine cell stained for the synaptic protein syntaxin (red) and double stained with an antibody to GABA (green). The syntaxin localizes to the cell membrane. C, Golgi staining of a wide-field amacrine cell in the bass retina. The in-focus processes are located in the inner plexiform layer in region S1. The out of focus processes are found in layer S5 deeper in the inner plexiform layer. Note the beaded processes from another type of amacrine cell running through the plane of focus. Dark splotches are staining artifacts. D, isolated, wide-field amacrine cell stained with an antibody to calmodulin (FITC, green). E, label of the same cell as in D with antibody to GABA (rhodamine, red). F, imagining of both previous labels simultaneously showing that these wide-field, GABAergic amacrine cells also contain calmodulin. G, labelling of a slice of retina with antibody to calmodulin (FITC, green). Wide-field amacrine cell is seen in the proximal portion of the inner nuclear layer (asterisk). Note also the brick-like horizontal cells stained positive for calmodulin (HC). H, double labelling of a wide-field amacrine cell (asterisk) with antibodies to calmodulin (rhodamine, red) and GABA (FITC, green). Processes extended into S1 and S5 (arrows) of the inner plexiform layer. Note adjacent cell bodies that stained positive for GABA but not for calmodulin. I, image of an amacrine cell (asterisk) double labelled with anti-calmodulin (rhodamine, red) and anti-glycine (FITC, green). The wide-field cells did not stain for glycine. Calibration bars represent 20 μm.
The identity of these cells as amacrine cells was further established with immunohistochemistry. Antibodies to the synaptic protein syntaxin selectively stain amacrine cells (Akagawa & Barnstable, 1986; Barnstable, 1988). In vertical sections of bass retina, syntaxin labelled the inner plexiform layer (IPL) and a population of cell bodies contiguous with the distal edge of the IPL (not shown). This suggests that in bass retina, as in chick or rat retina, syntaxin is a specific marker of amacrine cells. Without exception, isolated cells extending processes > 150-200 μm stained positive for syntaxin (Fig. 1B, red). This confirmed that the cells we describe in culture in this study were amacrine cells. However, amacrine cells in fish retina show a large variability in their functional and morphological properties and in the pattern of layering within the inner plexiform layer (Teranishi et al. 1987; Wagner & Wagner, 1988; Djamgoz et al. 1989; Djamgoz et al. 1990; Yang et al. 1991).
Teleost amacrine cells also show variation in their specific amino acid neurotransmitter content (Lasater, 1990), although GABAergic amacrine cells are by far the most abundant (Muller & Marc, 1990; Marc & Liu, 2000) and wide-field, GABAergic interstitial amacrine cells have been described in fish retina (Wagner et al. 1991). The isolated amacrine cells studied here were GABAergic as demonstrated by labelling with antibodies to GABA (green in Fig. 1B, red in Fig. 1E) and to glutamic acid decarboxylase (GAD) (not shown). In an effort to further classify these cells we tested immunoreactivity to a number of calcium-binding proteins known to stain particular populations of retinal neurons (Baimbridge et al. 1992). Figure 1D shows that the cell of Fig 1E was immunoreactive to anti-calmodulin. In Fig. 1F the merged image of 1D and 1E is shown, demonstrating double labelling. Similarly, in other cells of this type, we observed positive staining for the calcium-binding proteins parvalbumin and calretinin but not calbindin (not shown). Thus, the amacrine cell type of interest is a subset of GABAergic amacrine cells that selectively expresses certain calcium-binding proteins.
In the intact retina this particular cell type has a bistratified dendritic arbor. Figure 1G shows a calmodulin-positive cell in cross-section, with processes extending in the outer layer (S1) of the IPL. In Fig. 1H a cell double-labelled for calmodulin and GABA shows an axial process descending into the inner layer of the IPL where it stratifies (arrows). Figure 1I shows another cell with a connecting process extending from the distal to the inner layers of the plexiform layer. This cell stained positive for calmodulin (red) but not for glycine (green). These results imply that we are dealing with cells that stratify in both the distal and proximal IPL. Further support for this notion came from whole-mount preparations examined by confocal microscopy which showed the processes of a single cell which branched at two levels and formed a plexus in the inner plexiform layer. This is seen in Fig. 2 where a wide-field amacrine cell has been stained for calmodulin. The left-hand plate (A) shows a projection of slices from S1 to S5 and gives an indication of the branching of this cell. The middle plate (B) shows a single slice of the cell in layer S1 with many branching processes. The right-hand plate (C) shows branching in layer S5 of the IPL. The projection (A) shows that the branches in layers 1 and 5 belong to the same amacrine cell connected by an axial projection (see Fig. 1H and I). Thus the cell is bistratified in vivo, and the dendrites of these cells provide extensive coverage of the inner plexiform layer. We found no evidence for a monostratified, calmodulin-positive wide-field amacrine cell. Functional studies in other species demonstrated that cells with a similar morphology (Teranishi et al. 1987; Sakai & Naka, 1988; Djamgoz et al. 1990) produced transient responses with superimposed oscillations in response to light stimulation.
Figure 2. Calmodulin-labelled wide-field amacrine cells in whole-mount retina.
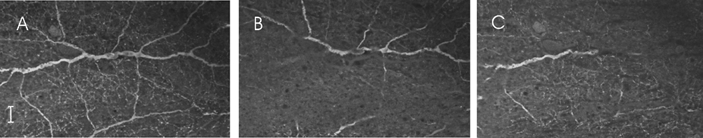
A, projection image made from optical slices of a wide-field cell showing the cell's branching pattern and the intertwining of processes from other cells outside the field of view. B, image focused at the level of S1 in the inner plexiform layer. C, focus is at the S5 level of the inner plexiform layer. Ganglion cell bodies and processes stained positive for calmodulin can be seen coming into focus. Scale bar is 20 μm.
Voltage responses
Cell identification was based on characteristic morphology (Fig. 1A). After establishing whole-cell conditions under voltage clamp, we switched to current clamp mode. The resting potential of the cells averaged -62.8 mV (± 8.4 mV, n = 112), although they followed a bimodal distribution as a number of cells (n > 20), upon breaking in, exhibited a membrane potential of around -30 mV. This was probably related to the bistable properties of the cell membrane (see below). When cells were depolarized by a series of incremental current pulses, two general response types occurred, depending on the level of the resting membrane potential. As exemplified by recordings from two different cells (Fig. 3A and B), small depolarizing current pulses elicited passive depolarizations that grew monotonically to reach a maximum level that remained constant for the duration of the applied pulse (Fig. 3 trace A1). With further increments in the magnitude of the current, a small ringing or oscillation appeared at the onset (Fig. 3 traces A2, B1, and B2). The magnitude, duration and frequency of the oscillations increased with membrane voltage (Fig. 3 traces A3 and B2). However, beyond a certain point the duration of the oscillations decreased (Fig. 3 traces A4, A5, B4, and B5). All the cells underwent similar oscillatory phases, but the attenuation and magnitude of the oscillations varied across cells. The responses shown in Fig. 3A and B are representative of cells where the oscillations were short lived (n = 25). This was typical of cells presenting a depolarized resting potential level of around -30 mV.
Figure 3. Oscillatory potentials elicited by depolarizing current pulses of increasing magnitude.
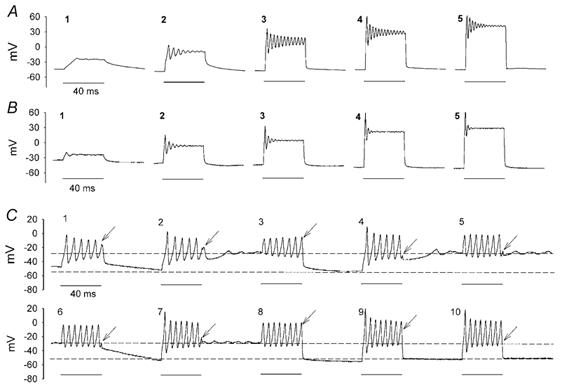
A and B, oscillatory potentials recorded from two different cells. Amplitude and frequency increased with moderate depolarizations. Attenuation occurred with the more pronounced depolarizations. Horizontal line at bottom represents application of the depolarizing pulses. C, sequence of responses from a cell that did not show significant attenuation during the presentation of a short, low threshold stimulus. Numbers on the upper corners of each panel indicate the order in which the depolarizations were presented. Unattenuated oscillations were maintained throughout the duration of the depolarization. This occurred even at depolarized levels here (see text) due to the short, marginally threshold stimulus. Upon termination of the pulse (arrows), the membrane potential recovered to one of two possible levels indicated by the dashed lines, the ‘choice’ was dependent on the phase of the oscillation at offset. Bistable membrane properties and unattenuated oscillations were commonly observed when the membrane potential of the cell between pulses was ‘forced’ to hyperpolarized levels of -60 to -70 mV (see text). Changes in frequency from the two resting levels are not apparent in this example. The effect of the sodium current on the magnitude of the first transient of the oscillation can be seen by comparing the initial peak amplitude in C7 to that of C8. INa participates in the first peak evoked from the hyperpolarized level (C7) but not from the depolarized level (C8) since the current is inactivated at that potential.
In other cells, the oscillations were maintained throughout the duration of the applied current pulse for short pulses (Fig. 3C, n > 50). For long current pulses (5 s) the oscillations would eventually die out as above after about 2.5 to 3 s (not shown). Interestingly, membrane potential bistability was seen in cells that showed little attenuation. Figure 3C shows responses from such a cell that was continuously recorded from while a series of 40 ms depolarizing current pulses were presented every 100 ms (i.e. 60 ms between pulses). Note that with application of the current pulse, a sustained oscillatory response was induced which lasted for the duration of the applied depolarization. At offset, however, the membrane potential did not always recover back to its original value. Rather, it alternatively relaxed in this case to either -55 mV or -29 mV. The recovery to -55 mV or to -29 mV appeared to be determined by the phase of the last oscillation at the moment of stimulus offset (arrows). If offset occurred during the downswing of the oscillation, the membrane potential recovered fully (-55 mV in this case, Fig. 3C traces 3, 8, 9 and 10). When the offset of the current pulse caught the oscillation on the upswing, then the membrane potential relaxed to -29 mV (Fig. 3C traces 2, 4, 5 and 7). When the offset occurred during the very early or late phase of the upswing, the membrane potential recovered fully, but along a sluggish time course (Fig. 3C traces 6 and 1, respectively). In this cell, unperturbed, the depolarized membrane potential could last up to 3 s before slowly returning to its original level.
The duration of the short-lived oscillatory responses (Fig. 3A and B) could be extended when the cell membrane potentials were hyperpolarized to -60 or -70 mV. This is illustrated in a scatter plot of the ratio of the amplitude of the oscillations at the end of the pulse (40 ms) to those at the beginning of the pulse as a function of pulse current (Fig. 4A). Responses of cells held at hyperpolarized potentials (open symbols) exhibited little attenuation as their ratio values clustered at levels of 0.8 or more. In contrast to this, responses of cells responding from more depolarized potentials (filled symbols) clustered at ratio values closer to 0.2, indicating a short-lived or transient ringing of the membrane potentials.
Figure 4. Properties of the oscillatory potentials.
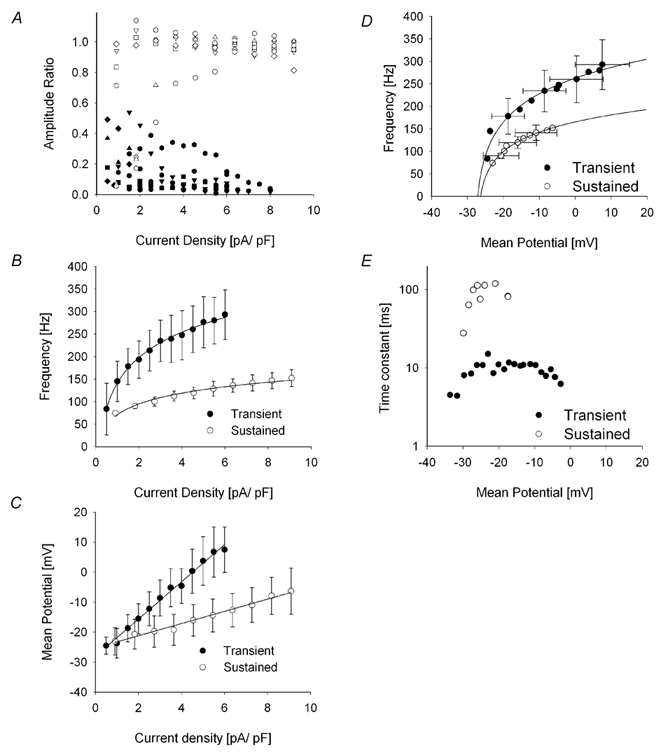
A, plot of the ratio of the amplitudes of the oscillations measured at the end of the depolarizing pulse to the amplitudes measured at the onset of the pulse as a function of pulse current density (n = 17). Filled symbols correspond to those obtained from amacrine cells ‘sitting’ at a depolarized resting potential and cluster at values below 0.4, indicative of the transient nature of the responses. Open symbols are for cells with membrane potentials at -60 to -70 mV. The ratios are generally over 0.8, indicative of the sustained nature of the oscillatory potentials. B, plot of the mean dominant frequency of the oscillatory potentials as a function of current density from the same cells as in A. Data sets were fitted with logarithmic functions. Clearly the frequency of the transient responses increased at a higher rate than the sustained oscillations. C, plot of the mean potential measured during the oscillations as a function of current density. See text for details. D, plot of the mean dominant frequency of the oscillatory potentials as a function of mean membrane potential. Data sets were fitted with logarithmic functions. Bidirectional standard deviations are indicated on selected points for clarity. See text for details. E, plot of the time constant of the exponential fit in D versus mean membrane potential. The curves peak at centre values then drop off indicative of tuning at the centre point (or membrane potential) and attenuation on either side. See text for details.
In order to better characterize this, we quantified different properties of the transient and sustained oscillations. Firstly, we determined their dominant frequency from FFT analysis. The frequency of the oscillations grew monotonically with the magnitude of the depolarizing current pulse (Fig. 4B). However, there was a significant difference in the frequencies of the transient and sustained oscillatory responses. Averaged data was well fitted (correlation coefficient > 0.98) with logarithmic functions (eqn (1)). From the fits we inferred a shift value (Th) of -1.5 pA pF−1, and a scaling factor (A) of 147 Hz for the transient oscillations. Sustained oscillations were well fitted with a logarithmic function with (Th) of -2.3 pA pF−1, and a scaling factor (A) of 62 Hz. The mean membrane potentials elicited by the depolarizing pulses were also markedly different (Fig. 4C). The mean potentials were well fitted by linear functions, with the potentials of the transient oscillatory responses growing at a faster rate, 6.2 vs.2.0 mV pA−1 pF−1, than the mean potentials of the sustained oscillations. Given that ionic conductances are triggered by membrane potential, it was also of interest to determine the characteristics of the response as a function of the membrane potential. Using the value of the current pulses as a common parameter, we found that the frequency of oscillations grew logarithmically (eqn (1)) as a function of the mean membrane potential (Fig. 4D). The frequency of the transient oscillations increased faster (scaling coefficient was 78 Hz) than those of the sustained oscillations (scaling coefficient was 50 Hz). In both cases, the threshold value of the oscillations extrapolated to a membrane potential of -28 mV. Altogether, these results suggest that these cells can present bistable properties in their resting membrane potentials, and that the characteristics of their oscillatory responses are dependent on the level of the resting membrane potential at the time of the depolarization. Cells at hyperpolarized membrane potentials (whether natural or imposed) will respond with sustained oscillations, whereas those at a depolarized resting potential exhibit high frequency, attenuating responses, suggesting that an adaptive mechanism is in place to control the properties of the responses.
An interesting feature observed in Fig. 3A and B is the apparent tuning of the responses. That is, with increasing current levels, the frequency of the oscillations increased continuously, but the duration of the oscillations first increased to a maximal level, after which it dropped with further increases in current. To obtain a measure of the attenuation in the responses as a function of the mean membrane potential, the oscillations were fitted with a damped sine wave (eqn (2)). Correlation coefficients were better than 0.9. From the fits, the period of the oscillation was in close correspondence with that inferred from the dominant frequencies. The other parameter of interest is the time constant of the exponential (τ), which is a measure of the attenuation, with lower values reflecting increasing attenuation. For the transient responses, the value of τ clustered about a maximum value of 10 ms and a mean membrane potential of -20 mV, showing a slight drop at the extremes, indicative of a mild tuning or resonance effect (Fig. 4E; Hutcheon & Yarom, 2000). During sustained oscillatory responses where the attenuation was mild, the value of the time constants often exceeded 100 ms in value and did not show any decrease with depolarization, probably because at the membrane potentials reached (≈0 mV), the frequency of the oscillations remained below the resistance/capacitance (RC) cut-off frequency of the cell. Thus they would not be filtered and possibly, under certain circumstances, these oscillations could be carried over large distances across the dendritic tree.
Ionic currents underlying the generation of oscillatory potentials
The ionic currents that gave rise to the oscillatory responses were next determined (Fig. 5A). In general, negligible currents were elicited by steps below -40 mV. Beyond that point and up to approximately -10 mV, the evoked currents consisted of an initial fast inward transient that was then followed by a sustained outward current. The fast transients lasted less than 10 ms and had peak amplitudes of around 500 pA. With subsequent depolarizing steps, the transient inward current was no longer noticeable and the sustained outward currents dominated the response. The I-V curve (Fig. 5C) showed an absence of inward rectification below -40 mV. The -40 mV point was a threshold, for beyond this voltage the sustained outward currents grew dramatically with depolarization at a steady rate reaching a magnitude, in one case, of 6110 pA at +40 mV.
Figure 5. Voltage clamp responses of a wide-field amacrine cell.
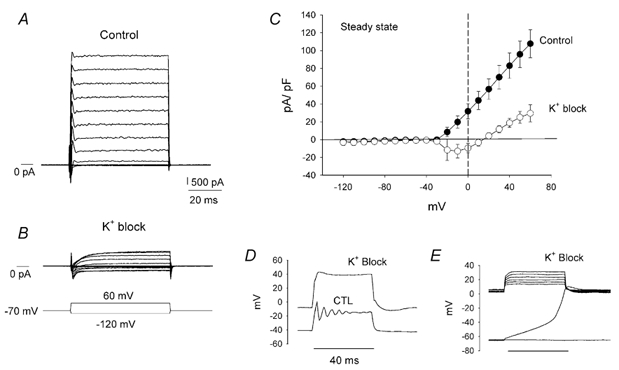
A, control voltage clamp response to a series of steps from -120 mV to +60 mV from a holding potential of -70 mV. An initial transient inward current followed by a sustained outward current characterized the response. B, a series of current traces obtained from the same cell after potassium currents had been blocked with 10 mm TEA and 7 mm 4-AP. Now a slow transient and a prominent sustained inward current were present. C, steady-state current-voltage relationships under control conditions and under conditions where the potassium currents were blocked, generated from points taken just prior to the end of the pulses. D, current clamp responses to depolarizing current pulses under control conditions (CTL) and in the presence of K+ channel blockers. The oscillatory responses were suppressed. In addition, this panel shows a depolarization of the resting membrane potential. However this was not usually such a dramatic or even a regular finding. E, cells can show two stable membrane potentials in the presence of K+ blockers.
The contribution of potassium, sodium and calcium currents to the overall response of these cells was determined. To this end, the cells were first superfused with Ringer solution complemented with the potassium channel blockers TEA (10 mm) and 4-AP (7 mm). This resulted in a significant decrease of the outward currents. For the cell shown in Fig. 5B, the currents decreased 88 % to 760 pA when measured at +40 mV. With the reduction of the outward currents, inward currents became readily apparent (Fig. 5B). In addition to the initial transient observed in Fig. 5A, a sustained inward current was also uncovered. Under these conditions the I-V curve reflects sustained inward currents in the voltage range between -30 and +20 mV (Fig. 5C). The current reversed polarity for voltages depolarized from +20 mV, and continued to grow at a modest rate probably due to incomplete blockage of the potassium channels. Similar results were obtained from five other cells. The outward currents measured at +40 mV averaged 4740 ± 942 pA, whereas blockage with TEA and 4-AP reduced the currents by 79 ± 6 % to an average of 955 ± 310 pA. Because of variations in the size of the cells studied, the currents relative to the cell capacitance were normalized for plotting. Capacitance of these five cells averaged 48 ± 6.2 pF, and the normalized currents were 82 ± 14 and 18.3 ± 5.4 pA pF−1, under control and blocked conditions, respectively.
Application of the potassium channels blockers TEA and 4-AP eliminated the oscillatory potentials that normally emerged in response to depolarizing current pulses (Fig. 5D). In response to a current pulse of the same magnitude, the mean membrane depolarizations increased by 1.9 times over the control values, consistent with a block of outward currents, but no oscillations were observed. While some cells depolarized, the majority of cells (> 15) hyperpolarized under these experimental conditions and the cells continued to show bistable resting membrane potentials. The hyperpolarizations could reach -65 to -70 mV in some cases. Subsequent application of current pulses revealed the bistable properties under these conditions (Fig. 5E). With the first depolarizing pulse, the membrane potential slowly climbed from -63 mV and settled at a depolarized level between 0 and +5 mV. This potential remained constant throughout the application of a series of depolarizing pulses and slowly relaxed to its hyperpolarized level when the pulses ceased. The observed bistability may be explained in terms of three zero crossings of the current axis in the I-V relationship (Fig. 5C, K+ block). As shown below, it is the uncovering of the inward calcium currents by the block of the potassium channels that enhances this effect, particularly in cells with small non-specific leak currents.
Sodium currents
The nature of the inward currents was investigated with a caesium-based intracellular solution supplemented with 20 mm TEA in the recording pipette (see Methods). After allowing 3-4 min for the pipette solution to equilibrate with the intracellular milieu, the potassium currents became negligible. When calcium currents were blocked with 1 mm Cd2+ (or 4 mm Co2+), under voltage clamp, depolarizing voltage steps from a holding potential of -70 mV elicited fast transient inward currents that quickly inactivated. This fast, transient current was eliminated with application of 0.5-1 μm TTX (not shown), indicating that these currents flow by way of voltage-gated sodium channels. The sodium currents were transient, in general lasting under 10 ms (Fig. 6A). Their voltage dependence is shown in the I-V plot of Fig. 6B. Currents were negligible until a threshold value of approximately -40 mV was reached. Beyond that voltage, the amplitudes increased with depolarization reaching maximal values for depolarizations to -10 mV. The maximal currents averaged -16.21 pA pF−1 (s.d. = ±3.9 pA pF−1, n = 6, capacitance = 56.0 ± 7.6 pF). After reaching the maximum at -10 mV, the amplitudes decreased with further depolarization as the voltage steps approached the reversal potential for sodium. The currents reversed at a potential more negative to the reversal potential for sodium due to small, residual potassium currents.
Figure 6. Dissection of sodium and calcium currents.
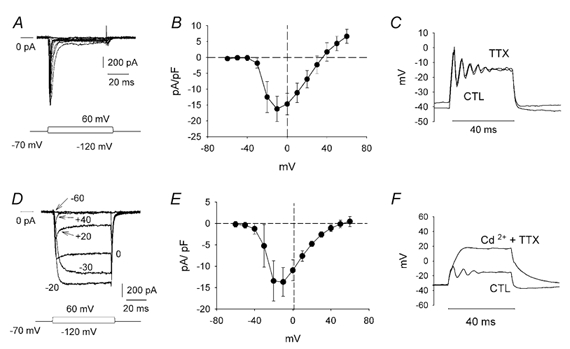
A, transient inward currents obtained as the difference of traces recorded under control conditions (K+ and Ca2+ currents blocked) and in the presence of 1 μm TTX. The holding potential was -70 mV, and voltage steps ranged between -120 mV and +60 mV. B, average current-voltage relationship for the sodium current (n = 6). The current has been normalized to cell capacitance to take into account cell size. C, block of TTX-dependent sodium currents (TTX) had no significant effect on oscillations. This could also be observed in Fig. 3C when the cell was depolarized and the sodium current was inactivated. D, calcium currents in response to a series of voltage steps between -120 mV and +60 mV (K+ and Na+ currents blocked). For clarity, only a few select traces are shown and the value of the voltage step eliciting the current is indicated for each trace. To isolate the calcium currents, difference traces were obtained from recordings performed with and without 1 mm cadmium superfusing the cell. A sustained current was at first present. A slow, initial transient which then sagged to a plateau appeared for voltage steps above about -20 to -10 mV. E, normalized current-voltage relationship for the calcium current (n = 5). F, application of cadmium (along with TTX) suppressed the oscillatory potentials (n = 16). CTL, control.
Given that the fast transient inward current was blocked by TTX, we tested the effects of TTX application on the oscillations (Fig. 6C). Recordings from 10 amacrine cells showed that the amplitude and frequency of the oscillations were unaltered by block of the sodium currents. We did notice that when the sodium current was not present, the rising phase of the first oscillation was slower and its initial peak was often reduced in amplitude (compare initial peak in Fig. 3C7 with that of 3C8 where INa was inactivated because of depolarization). This was not always seen as is the case in Fig. 6C; possibly because at more depolarized membrane potentials INa was inactivated. However it occurred frequently enough to suggest that a portion of the initial peak was due to sodium influx. These results imply that other ionic mechanisms must underlie the generation of the oscillations.
Calcium currents
We next focused on the nature of the sustained inward current. Potassium currents were reduced as described above, and 1 μm TTX was added to the medium to block the sodium currents in the absence of any calcium channel blockers. Under these conditions, the currents were inward and sustained in nature, indicative of a calcium current, reaching maximal magnitudes ranging between 800 and 1000 pA for cells averaging capacitance values of 88 ± 19.5 pF (n = 5) (Fig. 6D). For larger cells the current could be quite large, 2000 pA or more. Similar to the sodium currents, the calcium currents showed a strong voltage dependence, reaching a maximal value of 13.7 ± 3.4 pA pF−1 with depolarizations to -10 mV, and decreased asymptotically in amplitude until they became negligible at +60 mV (Fig. 6E). Currents evoked above -10 mV also exhibited a voltage-dependent inactivation which appeared as a transient peak and a sag to a plateau level (Fig. 6D, labelled 0, +20, +40). This seemed to be related to the amount of calcium that had entered into the cell over time as it was absent in the presence of barium, suggesting that it was a calcium-dependent inactivation of the calcium channel. Under current clamp, when the calcium current(s) were blocked (as well as the sodium current) an injected current pulse failed to elicit oscillations (Fig. 6F). This indicates a fundamental role for the calcium current(s) in the generation of the oscillatory potentials.
Potassium currents
Experiments to isolate and characterize the potassium currents of these cells were performed next. Under voltage clamp, the outward currents grew steadily with depolarization from a threshold level of -40 mV, reaching a level of 79 ± 10 pA pF−1 at +40 mV. Average capacitance of this set of cells was 57 ± 12 pF.
The cells were then superfused with Cd2+ (or Co2+) in order to block the calcium currents. The block of the calcium currents brought about a reduction (51 ± 25 %, n = 5) of the outward currents (open circles, Fig. 7A). A similar reduction of 38 ± 15 % (n = 7) was observed with application of 4 mm Co2+. A block of the potassium currents by TEA and 4-AP along with the block of the calcium currents by 1 mm Cd2+ resulted in further reduction of the outward currents, to 84 ± 7 % of its original value. We carried out similar experiments using a strong calcium-buffering solution in the pipette. This reduced the standing levels of calcium as well as any changes in intracellular calcium levels resulting from the inflow of calcium during the depolarizations. The average I-V relations showed that with strong buffering of the intracellular calcium levels (Fig. 7B), the overall currents decreased by more than 50 %. These results demonstrate the presence of a calcium-dependent potassium current(s).
Figure 7. Dissection of the potassium currents.
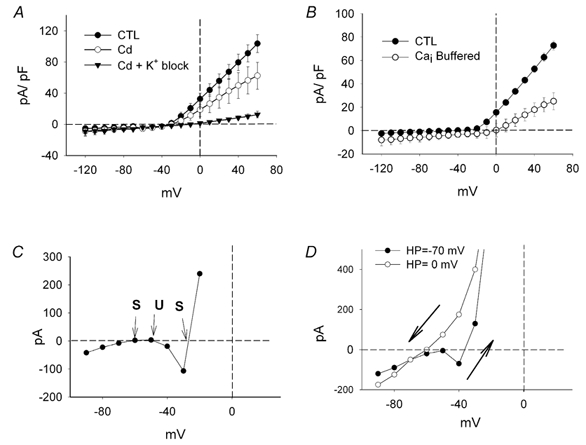
A, I-V curves determined at the end of the 60 ms voltage pulses. Here, control intracellular solution, without caesium or potassium channel blockers was used. TTX was continuously applied to block sodium currents. Under control conditions (CTL, •), the outward currents dominated the responses at membrane potential levels depolarized from -40 mV. Block of the calcium currents with cadmium (1 mm) resulted in a significant but highly variable reduction of the outward currents (○). Note the absence of the inward currents that are normally observed when only the potassium currents are blocked (Fig. 5C). Combined block of the calcium and potassium currents (▾) resulted in further reduction of the outward currents. B, when intracellular calcium was highly buffered the outward potassium current was reduced considerably as plotted by the open circles in the I-V relationship (n = 3). The recording pipette solution was supplemented with 5 mm EGTA (25× that of control) and contained no calcium. A control record was taken immediately after establishing the whole-cell configuration, and 5-10 min later, when the pipette solution had equilibrated with the intracellular milieu. C, I-V curve of an individual cell has a U-shape characteristic of regenerative systems. This I-V curve was obtained from a cell with bistable membrane properties (Fig. 3C) and crosses the zero axis at three points, consistent with the existence of two stable resting potentials (S) as inferred by the slopes of the I-V relationship at the corresponding points. A third crossing point with a negative slope is inherently unstable (U). D, typical result from holding a cell at two different membrane potentials. When the cell was held at -70 mV (•) and stepped to different values, the I-V relationship shows the typical U-shape. The application of voltage steps from a holding potential of 0 mV up to +20 then back down again (○) resulted in a hysteresis effect when the two curves were compared. The I-V relationship lost its characteristic U-shape and crossed the zero axis at a single, hyperpolarized point. This hysteresis probably occurs in vivo when the cell depolarizes from a low resting level then hyperpolarizes back down again. The arrows indicate the direction in which the membrane potential was stepped.
As shown above, block of the calcium channels by application of 1 mm cadmium or cobalt, in conjunction with TTX, was also sufficient to abolish the oscillatory potentials elicited by depolarizing current pulses (Fig. 6F). In addition, no bistable membrane potentials were observed. This is consistent with the I-V curves derived under these conditions (Fig. 7A), which had a single zero crossing point. More importantly, from the results obtained under voltage clamp it was clear that blocking the calcium channels also resulted in a reduction of the calcium-dependent potassium currents. When taken together, these data indicate that it is primarily the interplay between the potassium and calcium currents that underlies the generation of the oscillatory potentials.
Bistable membrane potentials
Although the oscillatory potentials and bistable membrane properties result from the kinetics and non-linear characteristics of the contributing currents, we found that the I-V relationships measured under voltage clamp, at the end of the 60 ms pulses could provide some insight into the underlying mechanisms involved. Close inspection of the I-V curves of individual cells held at a membrane potential of -70 mV showed that the currents generally followed a biphasic pattern, taking on the U-shaped I-V, characteristic of regenerative processes (Hille, 2001). In some cells the I-V curves were shifted upward and more clearly presented three zero crossings of the current axis, two of which corresponded to stable states (Fig. 7C, S), and the remaining one was inherently unstable (U). In this case (Fig. 7C), the values of the zero crossing for the stable states were approximately -27 and -60 mV, in close agreement with the bistable membrane potentials of the recordings shown above (Fig. 3C). The U-shape of the I-V relationship was progressively lost as the cells were held at increasingly more depolarized levels and a single crossing point remained. As shown in Fig. 7D, a cell had two stable points on the I-V curve when held at -70 mV but only one when held at 0 mV. Thus in vivo as the cell is depolarized from rest (≈-70 mV) the I-V relation will cross the voltage axis at a depolarized potential that is a second stable resting point. However, once the membrane potential goes above this, on the way back down, the cell cannot rest there and goes only to the lower, hyperpolarized value.
Pharmacology
Amacrine cells receive input from bipolar cells and other amacrine cells which signal using a variety of neurotransmitters. In order to more fully characterize these wide-field cells, the amacrine cells were tested with 100 μm glutamate, 100 μm GABA and 100 μm glycine, neurotransmitters known to mediate synaptic interactions in the inner retina of fish (Lasater, 1990; Fig. 8A). The cells responded to 100 μm glutamate with a sustained inward current. The size of the current varied with the size of the cell and for large cells could be several hundred picoamps (n = 10). The magnitude of these currents decreased with depolarized holding potentials. However, the noise levels of the intrinsic currents increased with sustained depolarization making it difficult to determine the exact level at which the currents reversed in polarity. The responses to GABA and glycine were quite different in nature. When the membrane potentials were held at -70 mV, the currents elicited by 100 μm GABA flowed inwardly and were transient in nature, lasting less than 1 s. The currents were negligible with holding potentials of -50 mV, and were reversed in polarity for a -30 mV step and increased when the cells were depolarized further to -10 mV. The responses to 100 μm glycine also showed a reversal potential at -50 mV but unlike the responses to GABA, their time course followed a slow decay to a plateau level. Given the chloride concentration in the intracellular and extracellular solutions, we estimate that the reversal potential for chloride during these experiments was -56 mV. This is very close to the observed reversal potential for both GABA- and glycine-induced currents, indicating that both GABA- and glycine-activated chloride conductances.
Figure 8. Currents elicited by 100 μm glutamte, GABA and glycine, and effects on the oscillatory potentials of the neurotransmitters.
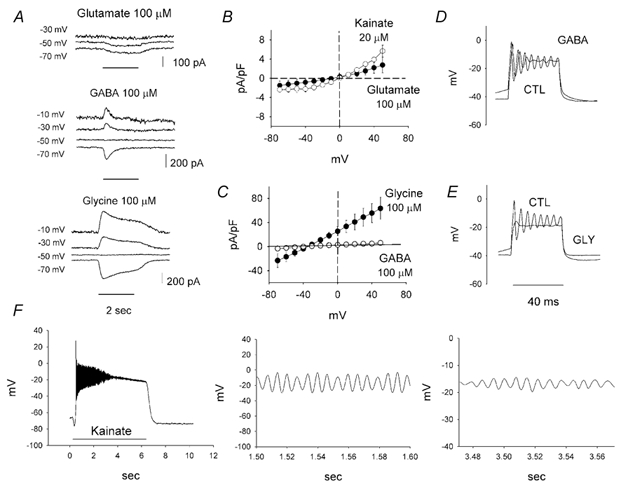
A, membrane potentials were held at the indicated potentials. The neurotransmitters were applied locally for 2 s as indicated by the horizontal line at the bottom. Glutamate induced a sustained inward current that did not reverse polarity within the observed voltage range. The responses to GABA and glycine reversed polarity at -50 mV, close to the reversal potential for chloride of -35 mV. B, sustained currents induced by 100 μm glutamate (•) and 20 μm of the glutamate agonist kainite (○). For both agents the currents reversed near 0 mV, consistent with the gating of a cationic conductance. I-V curves were constructed by taking the difference in the responses to voltage pulses (60 ms), measured at the end of the step, elicited under control conditions and in the presence of the corresponding transmitter. C, sustained currents induced by GABA (○) and glycine (•). Both reversed near the reversal potential for chloride, estimated to be ≈-35 mV. D, GABA applied with the current injection resulted in attenuation of the responses. CTL, control. E, glycine applied with the stimulation effectively inhibited the oscillatory potentials. F, kainate (50 μm) very effectively depolarized a cell and produced large attenuating oscillations. The cell was held at -70 mV and kainate was applied for 6 s. Note the longer time scale as compared to the previous figures. Middle and right panel are expansions of the kainate response for the times indicated on the abscissa. Note the differences in scale on both the ordinate and abscissa and the spindle-like waveform as the response dies out. See text for details.
A second series of experiments were performed to determine the reversal potential of the glutamate-elicited currents. In view of the sustained nature of the currents, we applied a series of depolarizing steps in the presence and absence of glutamate. The difference in the currents, measured at the end of the respective pulses, is the glutamate-activated current. It was plotted as a function of the applied potential (n = 10) (Fig. 8B). From this plot we can interpolate a reversal potential of approximately -5 mV for the currents induced by 100 μm glutamate, indicative of an essentially cationic conductance. The estimated slope conductance was 0.035 pA mV−1 pF−1 for 100 μm glutamate. Sustained currents were also activated by 20 μm kainate, reversing at around 0 mV, very close to the reversal value obtained with glutamate. These results confirmed a strong ionotropic component in the glutamate currents, which probably flowed through AMPA-type receptor-gated channels. The slope conductance for this concentration of kainate was 0.085 pA mV−1 pF−1.
Similar experiments in the presence of GABA revealed a sustained component that was not apparent during pulsed applications. For these experiments the caesium-based pipette solution was supplemented with 20 mm TEA chloride yielding a Nernst potential for chloride close to -40 mV. Application of 100 μm GABA gated a small sustained conductance of 0.078 pA mV−1 pF−1 (n = 3) that reversed at -33 mV (Fig. 8C). Under similar conditions the currents elicited by 100 μm glycine were an order of magnitude larger, yielding an estimated conductance of 0.76 pA mV−1 pF−1 (n = 3). The reversal potential was -35 mV. When using standard intracellular chloride concentrations, the reversal potential for GABA-elicited currents was -56.0 mV (n = 7) and -54.8 mV (n = 6) for glycine, close to the Nernst potential for chloride under these conditions. The reversal potentials closely followed the estimated Nernst potential for chloride, as expected if GABA- and glycine-activated chloride currents.
The effect of these transmitters on the oscillatory potentials was next examined. To this end, depolarizing current pulses were applied and compared to responses under control conditions and in the presence of the neurotransmitters. GABA and glycine (100 μm) produced an attenuation of the oscillations (Fig. 8D and E). Glycine in most cases eliminated the oscillations, as expected in view of the larger conductance it gated under steady-state conditions (Fig. 8C).
Although we found conditions that led to attenuation of the oscillatory potentials, it remained questionable whether these amacrine cells have the potential to generate oscillatory potentials under natural conditions, as for example, when the cell in situ receives excitatory glutamatergic input, say from bipolar cells. It was found that they do have this potential. When a cell was observed to oscillate upon current injection, application of glutamate (100 μm), kainate (50 μm) or AMPA (100 μm) alone would depolarize the cell and produce oscillations (n = 16). Kainate was particularly effective at doing this and a typical kainate response is shown in Fig. 8F (left). The cell rapidly depolarized and oscillated for about 3 s before the oscillations died out. This was very similar to the responses seen with long current pulses. The middle panel of Fig. 8F shows portions of the initial oscillatory response on an expanded time scale. The frequency of the oscillations was approximately 156 Hz. Close inspection of the plateau phase of the response after the large oscillations died out (Fig. 8F, right) revealed smaller membrane oscillations with a modulation of their amplitude. This is suggestive of the presence of a powerful intrinsic feedback mechanism that controls the amplitude and duration of the oscillatory events. We did not carefully evaluate the transmitter effects at the two stable membrane potentials but they qualitatively seemed similar to what was observed with current injection.
Discussion
For the first time, we have been able to characterize in isolation the membrane properties of a type of wide-field amacrine cell from the teleost retina. The cell labelled for the calcium binding proteins calmodulin, parvalbumin and calretinin and contained the neurotransmitter GABA. Interestingly, this cell type exhibited oscillatory potentials in response to membrane depolarizations evoked either by current injection or by the application of glutamate and its analogues. These intrinsic oscillatory potentials originate from the dynamic interaction between a non-inactivating calcium current and potassium currents. Also, GABA and glycine are able to modulate the amplitude and duration of the oscillations.
Identification and morphology
The unique morphology of the cells we studied here and their immunoreactivity to anti-syntaxin, a synaptic protein antibody that specifically stains amacrine cells in the retina (Akagawa & Barnstable, 1986; Barnstable, 1988), confirms that these isolated cells are amacrine cells. There is a very large diversity in the population of amacrine cells in the vertebrate retina (Teranishi et al. 1987; Ammermuller & Kolb, 1995; MacNeil & Masland, 1998) exemplified by 43 types of amacrine cells identified in the fish (roach) retina (Wagner & Wagner 1988). Immunohistochemical studies on the isolated bass cells showed that these cells express the inhibitory transmitter GABA but not glycine. Although GABA is found in wide-field, interstitial amacrine cells (Wagner, 1991), it is not specific to a single population of amacrine cells (Marc & Liu, 2000). However, we found that all cells with a morphology similar to those from which we recorded stained for calmodulin in addition to GABA. We combined studies using vertical slices and whole mounts and identified a type of wide-field amacrine cell that is immunoreactive to calmodulin and stratifies both in the distal and proximal IPL. Taken together, our data suggest that the cells we have studied in isolation are a bistratified, wide-field type of teleost retinal amacrine cell (Wagner & Wagner, 1988; Djamgoz et al. 1989; Djamgoz et al. 1990).
This notion is supported by past studies correlating morphology with physiology (Teranishi et al. 1987; Djamgoz et al. 1989; Djamgoz et al. 1990; Sakai & Naka, 1992; Sakai et al. 1997). Despite extensive morphological diversity, physiologically, teleost amacrine cells have been described simply in a broad sense as sustained or transient. On the one hand, those cells showing sustained and transient OFF or ON responses stratify in sublaminae a and b of the inner plexiform layer, respectively. On the other hand, cells with transient ON/OFF responses are bistratified, with dendrites extending into both sublaminae (Djamgoz et al. 1990; Sakai et al. 1997) such as seen here.
Oscillatory potentials and voltage-activated currents
In other studies of teleost retina, oscillatory membrane potentials were observed in wide-field amacrine cells that stratified in a single or in both laminae of the IPL (Djamgoz et al. 1990; Sakai & Naka, 1990b; Sakai et al. 1997). The oscillations were spontaneous or evoked by light and ranged in frequency from 35 to 65 Hz. The light-evoked oscillations of these wide-field amacrine cells were superimposed on sustained and transient depolarizations or on return from hyperpolarization (Djamgoz et al. 1990; Sakai & Naka, 1990b). However, the origin as well as the functional significance of the oscillatory potentials in these retinas (Sakai & Naka, 1990b), as well as in other retinas such as that of the turtle (Ammermuller & Kolb, 1995), is unknown.
Our results show that depolarizing currents can elicit oscillatory membrane potentials in amacrine cells in isolation and therefore they do not arise as a consequence of synaptic interactions between two or more cells (Sakai & Naka, 1990b; Ammermuller & Kolb, 1995; Bal et al. 2000). The bass cells express voltage-gated sodium, potassium, calcium and calcium-activated potassium currents, as described previously in amacrine cells of the salamander retina (Barnes & Werblin, 1986; Eliasof et al. 1987) and rat (Boos et al. 1993). In contrast to salamander but similar to rat, we did not detect the presence of a voltage-gated transient potassium current. The significance of this is not known. We also did not record an inward rectifier; this has not been observed in amacrine cells from other preparations and this, combined with our data, suggests that this current may not be a general feature of amacrine cells.
Basis of the oscillations
We found that the oscillatory potentials originate from the interplay of the voltage-gated calcium currents and potassium currents and do not involve sodium currents. This is different from the spike-generating mechanisms of some amacrine cells (Barnes & Werblin, 1986; Eliasof et al. 1987; Bloomfield, 1996; Cook et al. 1998; Yamada et al. 2002) and the sodium-based oscillations seen in many CNS systems (Pedroarena et al. 1999; Amir et al. 2002). It is not, however, without precedent. Regenerative potentials arising from interactions between non-inactivating, voltage-dependent calcium and potassium currents have been described in other model systems (Morris & Lecar, 1981; Art & Fettiplace, 1987; Hudspeth & Lewis, 1988).
The oscillations probably arise as a result of resonance intrinsic to the cell interacting with an amplifying current (Morris & Lecar, 1981; Hutcheon & Yarom, 2000). In brief, resonance occurs in a cell that has a voltage-activated current opposing membrane voltage change. This current will also have a reversal potential that falls near the base of its activation potential and which activates slowly with regard to the membrane time constant. The current acts as a high-pass filter while the RC of the cell behaves as a low-pass filter. Together this gives the cell the characteristics of a notch or band-pass filter that has a characteristic resonance frequency. Here, IK and/or IK(Ca) could fulfil the role of resonant current and are sufficient for producing oscillations that die out (Hutcheon & Yarom, 2000). An amplifying current is the opposite. This current potentiates membrane voltage change and has its reversal potential close to the peak of its voltage-activation curve. Also it activates rapidly relative to the membrane RC. The amacrine cell ICa is probably such a current. A rough calculation for our cells gives a low-pass cutoff frequency of ≈120 Hz and a high-pass cutoff of ≈30 Hz. This yields a peak resonance frequency somewhere around 70 Hz, close to the range of resonance frequencies for the sustained oscillations. When the amplifying current interacts with the resonant current, amplified resonance occurs and may be what we observed in some cases. If the amplifying current is large enough, resonance can be coupled to self-sustained oscillations of membrane voltage producing long duration oscillations capable of travelling long distances down the membrane. This might account for the oscillations we see from hyperpolarized potentials and with glutamate and its agonists.
The question remains as to the role of the sodium currents in our cells, which like other wide-field amacrine cells in fish retinas (Djamgoz et al. 1990; Sakai & Naka, 1990b) do not generate typical action potentials. Our data suggest that the sodium current is involved in the timing of the onset of the oscillations; that is the oscillations start much faster and the first spike amplitude is larger as a result of the rapid initial depolarization produced by the current. This may be a factor in producing sustained oscillations from a hyperpolarized membrane potential.
The frequency of the oscillations increased monotonically with the magnitude of the injected depolarizing current pulse and resulting membrane depolarization. However, the properties of the oscillations were strongly influenced by the membrane potential imposed on the cell prior to application of the depolarizing pulses. We found that for cells ‘resting’ at a relatively depolarized membrane potential in culture (≈-30 to -35 mV), the frequency of the oscillations grew at a faster pace than their counterparts originating from cells sitting hyperpolarized at around -70 mV. Also, the oscillations of the depolarized cells were attenuated or extinguished more rapidly than those of hyperpolarized cells. These changes demonstrate an intrinsic mechanism(s) for modulating or ‘tuning’ the properties of the oscillatory potentials, irrespective of their in situ resting potential. The tuning mechanism is probably tied to the resonant properties of the cell.
Bistable resting potentials
Our recordings showed that the wide-field amacrine cell is capable of supporting two resting membrane potentials, one hyperpolarized around -60 to -70 mV and the other more depolarized around -35 mV. This is a consequence of the small potassium current that is present over the normal operating range (about -70 to -30 mV) of the cell. Because of this there are two points on the current-voltage relationship which are stable (Hille, 2001). This is similar to what is seen in retinal horizontal cells (Shingai & Christensen, 1986; Sullivan & Lasater, 1990). The purpose of the upper resting potential is not known but could aid in maintaining the cell at a depolarized level with little glutamatergic input from bipolar cells.
Neurotransmitter effects
We also demonstrated that these cells have glutamate-, GABA- and glycine-activated conductances, all of which have an impact on the oscillatory potentials. Because of the long application times, it is possible that some of the currents we observed represent desensitized currents, particularly the glutamate-activated currents. Whether or not desensitization plays a role in the normal function of these amacrine cells is not known (Tran et al. 1999). Nonetheless, GABA and glycine suppress the oscillatory potentials probably as a result of shunting due to the opening of chloride channels. In vivo, if the cells have a low input resistance, this probably will have little effect. However, if resonant effects are high, and the signal is propagating, inhibitory input may act to decrease signal transfer across the cell. Thus in situ GABAergic and glycinergic input from other cells will play a part in the modulation of the oscillations (Yamada et al. 2002). Under certain circumstances it might be possible for input from other cells to prevent the cell from oscillating. Glutamate and its analogues, conversely, evoke a depolarization and subsequent long duration oscillations when the cell is resting at a hyperpolarized level (Fig. 8G). In contrast to the inhibitory transmitters, this occurs because the glutamate current is acting as an amplifying current. Glutamate may have this role in vivo and thus the oscillations may function to distribute information across the dendritic expanse of the cell and move it between electrically coupled cells (Vaney, 1999) similar to what is seen in olivary neurons (Llinas & Yarom, 1986) where oscillations travel great distances through the coupled network. The oscillations could therefore provide a mechanism for transmitting information over long distances possibly signalling important global information such as, for example, ambient light levels or adaptational states.
Acknowledgments
We thank Silke Haverkamp, Max-Planck-Institut für Hirnforschung, Frankfurt/Main, Germany for her help with the initial syntaxin staining. This work was supported by an NIH grant, EY05972 (E.M.L.) from the National Eye Institute and an unrestricted grant to the Department of Ophthalmology and Visual Sciences, University of Utah from Research to Prevent Blindness, Inc. (RPB). E.M.L. is an RPB Lew R. Wasserman Merit award recipient and J.V. is the recipient of a US-Hungarian Science and Technology Joint Fund travel grant.
References
- Akagawa K, Barnstable CJ. Identification and characterization of cell types in monolayer cultures of rat retina using monoclonal antibodies. Brain Research. 1986;383:110–120. doi: 10.1016/0006-8993(86)90012-0. [DOI] [PubMed] [Google Scholar]
- Amir R, Liu CN, Kocsis JD, Devor M. Oscillatory mechanism in primary sensory neurones. Brain. 2002;125:421–435. doi: 10.1093/brain/awf037. [DOI] [PubMed] [Google Scholar]
- Ammermuller J, Kolb H. The organization of the turtle inner retina. I. ON- and OFF-center pathways. Journal of Comparative Neurology. 1995;358:1–34. doi: 10.1002/cne.903580102. [DOI] [PubMed] [Google Scholar]
- Art JJ, Fettiplace R. Variation of membrane properties in hair cells isolated from the turtle cochlea. Journal of Physiology. 1987;385:207–242. doi: 10.1113/jphysiol.1987.sp016492. [DOI] [PMC free article] [PubMed] [Google Scholar]
- Baimbridge KG, Celio MR, Rogers JH. Calcium-binding proteins in the nervous system. Trends in Neurosciences. 1992;15:303–308. doi: 10.1016/0166-2236(92)90081-i. [DOI] [PubMed] [Google Scholar]
- Bal T, Debay D. Cortical feedback controls the frequency and synchrony of oscillations in the visual thalamus. Journal of Neuroscience. 2000;20:7478–7488. doi: 10.1523/JNEUROSCI.20-19-07478.2000. [DOI] [PMC free article] [PubMed] [Google Scholar]
- Barnes S, Werblin F. Gated currents generate single spike activity in amacrine cells of the tiger salamander retina. Proceeding of the National Academy of Sciences of the USA. 1986;83:1509–1512. doi: 10.1073/pnas.83.5.1509. [DOI] [PMC free article] [PubMed] [Google Scholar]
- Barnstable CJ. Monoclonal antibodies in studies of neuronal diversity. In: Jones E, editor. Molecular Biology of the Human Brain. New York: Alan R. Liss; 1988. pp. 27–41. [Google Scholar]
- Bieda MC, Copenhagen DR. Sodium action potentials are not required for light-evoked release of GABA or glycine from retinal amacrine cells. Journal of Neurophysiology. 1999;81:3092–3095. doi: 10.1152/jn.1999.81.6.3092. [DOI] [PubMed] [Google Scholar]
- Bloomfield SA. Effect of spike blockade on the receptive-field size of amacrine and ganglion cells in the rabbit retina. Journal of Neurophysiology. 1996;75:1878–1893. doi: 10.1152/jn.1996.75.5.1878. [DOI] [PubMed] [Google Scholar]
- Boos R, Schneider H. Voltage- and transmitter-gated currents of all-amacrine cells in a slice preparation of the rat retina. Journal of Neuroscience. 1993;13:2874–2888. doi: 10.1523/JNEUROSCI.13-07-02874.1993. [DOI] [PMC free article] [PubMed] [Google Scholar]
- Cook PB, Lukasiewicz PD, McReynolds JS. Action potentials are required for the lateral transmission of glycinergic transient inhibition in the amphibian retina. Journal of Neuroscience. 1998;18:2301–2308. doi: 10.1523/JNEUROSCI.18-06-02301.1998. [DOI] [PMC free article] [PubMed] [Google Scholar]
- Cook PB, McReynolds JS. Lateral inhibition in the inner retina is important for spatial tuning of ganglion cells. Nature Neuroscience. 1998;1:714–719. doi: 10.1038/3714. [DOI] [PubMed] [Google Scholar]
- Cook PB, Werblin FS. Spike initiation and propagation in wide field transient amacrine cells of the salamander retina. Journal of Neuroscience. 1994;14:3852–3861. doi: 10.1523/JNEUROSCI.14-06-03852.1994. [DOI] [PMC free article] [PubMed] [Google Scholar]
- Djamgoz M B A, Downing J E G, Wagner H-J. Amacrine cells in the retina of a cyprinid fish: Functional characterization and intracellular labelling with horseradish peroxidase. Cell and Tissue Research. 1989;256:607–622. doi: 10.1007/BF00225611. [DOI] [PubMed] [Google Scholar]
- Djamgoz MB, Spadavecchia L, Usai C, Vallerga S. Variability of light-evoked response pattern and morphological characterization of amacrine cells in goldfish retina. Journal of Comparative Neurology. 1990;301:171–190. doi: 10.1002/cne.903010204. [DOI] [PubMed] [Google Scholar]
- Dowling JE. The Retina: An Approachable Part of the Brain. Cambridge, MA, USA: The Belknap Press of Harvard University Press; 1987. [Google Scholar]
- Feigenspan A, Gustincich S, Bean BP, Raviola E. Spontaneous activity of solitary dopaminergic cells of the retina. Journal of Neuroscience. 1999;18:6776–6789. doi: 10.1523/JNEUROSCI.18-17-06776.1998. [DOI] [PMC free article] [PubMed] [Google Scholar]
- Gleason E, Borges S. Synaptic transmission between pairs of retinal amacrine cells in culture. Journal of Neuroscience. 1993;13:2359–2370. doi: 10.1523/JNEUROSCI.13-06-02359.1993. [DOI] [PMC free article] [PubMed] [Google Scholar]
- Hamill OP, Marty A, Neher E, Sakmann B, Sigworth FJ. Improved patch-clamp techniques for high-resolution current recording from cells and cell-free membrane patches. Pflügers Archiv. 1981;391:85–100. doi: 10.1007/BF00656997. [DOI] [PubMed] [Google Scholar]
- Hille B. Ion Channels of Excitable Membranes. 3. Sunderland, MA, USA: Sinauer Associates, Inc.; 2001. [Google Scholar]
- Hudspeth AJ, Lewis RS. Kinetic analysis of voltage- and ion-dependent conductances in saccular hair cells of the bull-frog, Rana catesbeiana. Journal of Physiology. 1988;400:237–274. doi: 10.1113/jphysiol.1988.sp017119. [DOI] [PMC free article] [PubMed] [Google Scholar]
- Hutcheon B, Yarom Y. Resonance, oscillation and the intrinsic frequency preferences of neurons. Trends in Neurosciences. 2000;23:216–222. doi: 10.1016/s0166-2236(00)01547-2. [DOI] [PubMed] [Google Scholar]
- Kamermans M, Fahrenfort I, Schultz K, Janssen-Bienhold U, Sjoerdsma T, Weiler R. Hemichannel-mediated inhibition in the outer retina. Science. 2001;292:1178–1180. doi: 10.1126/science.1060101. [DOI] [PubMed] [Google Scholar]
- Kaneko A. Responses of bipolar cells: on and off pathways. In: Toyoda J-I, Murakami M, Kaneko A, Saito T, editors. The Retinal Basis of Vision. Amsterdam: Elsevier; 1999. pp. 103–114. [Google Scholar]
- Lasater EM. Ionic currents of cultured horizontal cells isolated from white perch retina. Journal of Neurophysiology. 1986;55:499–513. doi: 10.1152/jn.1986.55.3.499. [DOI] [PubMed] [Google Scholar]
- Lasater EM. Neurotransmitters and neuromodulators of the fish retina. In: Douglas R, Djamgoz M, editors. The Visual System of Fish. London: Chapman and Hall; 1990. pp. 211–238. [Google Scholar]
- Llinas R, Yarom Y. Oscillatory properties of guinea-pig inferior olivary neurones and their pharmacological modulation: an in vitro study. Journal of Physiology. 1986;376:163–182. doi: 10.1113/jphysiol.1986.sp016147. [DOI] [PMC free article] [PubMed] [Google Scholar]
- MacNeil MA, Masland RH. Extreme diversity among amacrine cells: implications for function. Neuron. 1998;20:971–982. doi: 10.1016/s0896-6273(00)80478-x. [DOI] [PubMed] [Google Scholar]
- Marc RE, Liu W. Fundamental GABAergic amacrine cell circuitries in the retina: nested feedback, concatenated inhibition, and axosomatic synapses. Journal of Comparative Neurology. 2000;425:560–582. doi: 10.1002/1096-9861(20001002)425:4<560::aid-cne7>3.0.co;2-d. [DOI] [PubMed] [Google Scholar]
- Masland RH. The Functional Architecture of the Retina. Scientific American. 1986;255:102–111. doi: 10.1038/scientificamerican1286-102. [DOI] [PubMed] [Google Scholar]
- Morris C, Lecar H. Voltage oscillations in the barNaCle giant muscle fiber. Biophysical Journal. 1981;35:193–213. doi: 10.1016/S0006-3495(81)84782-0. [DOI] [PMC free article] [PubMed] [Google Scholar]
- Muller JF, Marc RE. GABA-ergic and glycinergic pathways in the inner plexiform layer of the goldfish retina. Journal of Comparative Neurology. 1990;291:281–304. doi: 10.1002/cne.902910210. [DOI] [PubMed] [Google Scholar]
- Pedroarena CM, Pose IE, Yamuy J, Chase MH, Morales FR. Oscillatory membrane potential activity in the soma of a primary afferent neuron. Journal of Neurophysiology. 1999;82:1465–1476. doi: 10.1152/jn.1999.82.3.1465. [DOI] [PubMed] [Google Scholar]
- Roska B, Nemeth E. Response to change is facilitated by a three-neuron disinhibitory pathway in the tiger salamander retina. Journal of Neuroscience. 1998;18:3451–3459. doi: 10.1523/JNEUROSCI.18-09-03451.1998. [DOI] [PMC free article] [PubMed] [Google Scholar]
- Sakai H, Machuca H, Naka K-I. Processing of color-and noncolor-coded signals in the gourami retina. II. Amacrine cells. Journal of Neurophysiology. 1997;78:2018–2033. doi: 10.1152/jn.1997.78.4.2018. [DOI] [PubMed] [Google Scholar]
- Sakai HM, Naka KI. Neuron network in catfish retina: 1968–87. In: Osborne N, Chader J, editors. Progress in Retinal Research. New York: Pergamon Press; 1988. pp. 149–208. [Google Scholar]
- Sakai HM, Naka K-I. Dissection of the neuron network in the catfish inner retina IV. Bidirectional interactions between amacrine and ganglion cells. Journal of Neurophysiology. 1990a;63:105–119. doi: 10.1152/jn.1990.63.1.105. [DOI] [PubMed] [Google Scholar]
- Sakai HM, Naka K-I. Dissection of the neuron network in the catfish inner retina V. Interactions between NA and NB amacrine cells. Journal of Neurophysiology. 1990b;63:120–130. doi: 10.1152/jn.1990.63.1.120. [DOI] [PubMed] [Google Scholar]
- Sakai HM, Naka K-I. Response dynamics and receptive-field organization of catfish amacrine cells. Journal of Neurophysiology. 1992;67:430–442. doi: 10.1152/jn.1992.67.2.430. [DOI] [PubMed] [Google Scholar]
- Shields CR, Lukasiewicz PD. GABAergic transmission in the inner plexiform layer depends on action potentials. Investigative Ophthalmology and Visual Science. 2001;42:S673. [Google Scholar]
- Shingai R, Christensen BN. Excitable properties and voltage-sensitive ion conductances of horizontal cells isolated from catfish (Ictalurus punctatus) retina. Journal of Neurophysiology. 1986;56:32–49. doi: 10.1152/jn.1986.56.1.32. [DOI] [PubMed] [Google Scholar]
- Sullivan JM, Lasater EM. An unusually small potassium current that is well-suited to a retinal neuron which is chronically depolarized. Brain Research. 1990;528:130–132. doi: 10.1016/0006-8993(90)90204-o. [DOI] [PubMed] [Google Scholar]
- Teranishi T, Negishi K. Functional and morphological correlates of amacrine cells in carp retina. Neuroscience. 1987;20:935–950. doi: 10.1016/0306-4522(87)90254-5. [DOI] [PubMed] [Google Scholar]
- Tran MN, Higgs MH, Lukasiewicz PD. AMPA receptor kinetics limit retinal amacrine cell excitatory synaptic responses. Visual Neuroscience. 1999;16:835–842. doi: 10.1017/s0952523899165039. [DOI] [PubMed] [Google Scholar]
- Vaney DI. Neuronal coupling in the central nervous system: lessons from the retina. Novartis Foundation Symposium. 1999;219:113–125. doi: 10.1002/9780470515587.ch8. [DOI] [PubMed] [Google Scholar]
- Wagner H-J, Wagner E. Amacrine cells in the retina of a teleost fish, the roach (Rutilus rutilus) Philosophical Transactions of the Royal Society. 1988;32:263–324. doi: 10.1098/rstb.1988.0094. [DOI] [PubMed] [Google Scholar]
- Wagner H-J. The mismatch problem for GABAergic amacrine cells in goldfish retina: Resolution and other issues. Neurochemical Research. 1991;16:327–339. doi: 10.1007/BF00966096. [DOI] [PubMed] [Google Scholar]
- Wu SM, Maple BR. Amino acid neurotransmitters in the retina: a functional overview. Vision Research. 1998;38:1371–1384. doi: 10.1016/s0042-6989(97)00296-4. [DOI] [PubMed] [Google Scholar]
- Yamada Y, Koizumi A, Iwasaki E, Watanabe S, Kaneko A. Propagation of action potentials from the soma to individual dendrite of cultured rat amacrine cells is regulated by local GABA input. Journal of Neurophysiology. 2002;87:2858–2866. doi: 10.1152/jn.2002.87.6.2858. [DOI] [PubMed] [Google Scholar]
- Yang C-Y, Lukasiewicz P, Macguire G, Werblin FS, Yazulla S. Amacrine cells in the tiger salamander retina: Morphology, physiology, and neurotransmitter identification. Journal of Comparative Neurology. 1991;312:19–32. doi: 10.1002/cne.903120103. [DOI] [PubMed] [Google Scholar]