

Abstract
In rat skeletal muscle, Na+–K+ pump activity increases dramatically in response to excitation (up to 20-fold) or β2-agonists (2-fold), leading to a reduction in intracellular Na+. This study examines the time course of these effects and whether they are due to an increased affinity of the Na+–K+ pump for intracellular Na+. Isolated rat soleus muscles were incubated at 30 oC in Krebs-Ringer bicarbonate buffer. The effects of direct electrical stimulation on 86Rb+ uptake rate and intracellular Na+ concentration ([Na+]i) were characterized in the subsequent recovery phase. [Na+]i was varied using monensin or buffers with low Na+. In the [Na+]i range 21–69 mm, both the β2-agonist salbutamol and electrical stimulation produced a left shift of the curves relating 86Rb+ uptake rate to [Na+]i. In the first 10 s after 1 or 10 s pulse trains of 60 Hz, [Na+]i showed no increase, but 86Rb+ uptake rate increased by 22 and 86 %, respectively. Muscles excited in Na+-free Li+-substituted buffer and subsequently allowed to rest in standard buffer also showed a significant increase in 86Rb+ uptake rate and decrease in [Na+]i. Na+ loading induced by monensin or electroporation also stimulated 86Rb+ uptake rate but, contrary to excitation, increased [Na+]i. The increase in the rate of 86Rb+ uptake elicited by electrical stimulation was abolished by ouabain, but not by bumetanide. The results indicate that excitation (like salbutamol) induces a rapid increase in the affinity of the Na+–K+ pump for intracellular Na+. This leads to a Na+–K+ pump activation that does not require Na+ influx, but possibly the generation of action potentials. This improves restoration of the Na+–K+ homeostasis during work and optimizes excitability and contractile performance of the working muscle.
Excitability and contractility of skeletal muscle are critically dependent on the existence of steep chemical gradients for Na+ and K+ across the plasma membrane, maintained by the Na+–K+ pump (Bigland-Ritchie et al. 1979; Overgaard et al. 1999; Sejersted & Sjøgaard, 2000). Muscle contraction is associated with a marked increase in the influx of Na+ and efflux of K+ (Sejersted & Sjøgaard, 2000) creating an urgent need for efficient activation of the Na+–K+ pump to restore the chemical gradients for Na+ and K+. Since the rate of active transport of Na+ and K+ in resting muscles only amounts to a few per cent of the theoretical maximum transport capacity of the Na+–K+ pump, muscle cells have a large spare capacity for acceleration of the Na+–K+ pump.
Several studies have shown that the activity of the Na+–K+ pump is dynamically regulated in relation to muscle activity. In perfused dog hindlimb, a 65 % increase in Na+–K+ pump activity during 4 Hz electrical stimulation has been reported (Hazeyama & Sparks, 1979). Microelectrode recordings of intracellular Na+ activity in mouse soleus muscles that had been stimulated repetitively with 40 Hz pulse trains showed a 10-fold increase in the ouabain-suppressible net Na+ extrusion (Juel, 1986). In rat soleus muscle a 12- to 20-fold increase in the activity of the Na+–K+ pump was elicited after electrical stimulation at 60–120 Hz, corresponding to transport rates of 60–100 % of the theoretical maximum Na+–K+ pump capacity estimated from the content of 3H-ouabain binding sites (Everts & Clausen, 1994; Nielsen & Clausen, 1997).
The increase in active Na+–K+ transport in contracting muscle can to some extent be explained by the excitation-induced elevation of the intracellular Na+ concentration ([Na+]i), which is a potent stimulus for the Na+–K+ pump (for review see Semb & Sejersted, 1996). During the recovery period following excitation, however, the net extrusion of Na+ has been reported to continue after the [Na+]i has reached the resting value. In Juel's study of mouse soleus muscles (Juel, 1986), the electrical stimulation led to an increase in [Na+]i from a resting level of 12.7 mm to 23.3 mm. After the stimulation, however, the Na+ level showed a fast recovery and a tendency to create an ‘undershoot’, where the intracellular Na+ was kept below resting level for 1 or 2 min. The fast recovery and following undershoot were inhibited by the addition of ouabain, indicating that the reduction in [Na+]i was created by increased Na+–K+ pump activity (Juel, 1986). In a study of rat soleus muscles, the time course of intracellular Na+ content after electrical stimulation showed a more pronounced and longer lasting ‘undershoot’ (Nielsen & Clausen, 1997). During 30 s of stimulation at 60 Hz the intracellular Na+ content increased by 3.2 μmol (g wet wt)−1. One minute after the stimulation had ceased the intracellular Na+ content had returned to resting level, but the net extrusion of Na+ continued for 10 min, lowering the intracellular Na+ content by more than 4 μmol (g wet wt)−1 corresponding to a 32 % reduction compared to the unstimulated controls. This study also showed that the net extrusion and the ensuing undershoot in intracellular Na+ could be inhibited by ouabain or cooling to 0 oC. It was hypothesized that the increased activity was due to an increased affinity of the Na+–K+ pump for intracellular Na+. A regulatory increase in the affinity for intracellular Na+ was elicited by insulin in kidney tubules (Feraille et al. 1994) and in isolated cardiomyocytes prepared from rabbits (Hansen et al. 2000).
In rat soleus muscles adrenaline and β2-agonists have been shown to produce up to a 2-fold increase in Na+–K+ pump activity (the ouabain-suppressible rates of 42K+ and 86Rb+ uptake) with a resulting reduction in intracellular Na+ (Clausen & Flatman, 1977; Pfliegler et al. 1983; Hsu & Guidotti, 1991; James et al. 1999). Since this could not be associated with any early increase in intracellular Na+ it has been suggested that β2-agonists and other stimuli for the Na+–K+ pump act by increasing the affinity of the Na+–K+ pump for intracellular Na+ (Clausen & Nielsen, 1998).
The aims of the present study were to test the following hypotheses:
(1) That the effects of the β2-agonist salbutamol and post-excitatory recovery on 86Rb+ uptake rate and [Na+]i in rat soleus muscle are similar and non-additive.
(2) That, when examined over a range of different levels of [Na+]i, both salbutamol and excitation stimulate the rate of 86Rb+ uptake by increasing the apparent affinity of the Na+–K+ pump for intracellular Na+.
(3) That the excitation-induced undershoot in [Na+]i during recovery is triggered by an effect of the action potentials on the Na+–K+ pump.
Part of the observations reported here have previously been presented in an abstract (Buchanan et al. 2002).
Methods
Animals and muscle preparation
All handling and use of animals complied with Danish animal welfare regulations. Experiments were carried out using 4-week-old female or male Wistar rats weighing 60–70 g. The animals had unlimited access to food and water, and were kept at a constant temperature (21 °C) and day length (12 h).
The animals were killed by cervical dislocation then decapitated, and the intact soleus muscles with tendons were dissected out as previously described (Nielsen & Clausen, 1996). The wet weight of the muscles ranged from 15 to 28 mg. All incubations took place at 30 °C and, if not otherwise stated, in standard Krebs-Ringer bicarbonate buffer (KR buffer) containing (mm): 120.1 NaCl, 25 NaHCO3, 4.7 KCl, 1.2 KH2PO4, 1.2 MgSO4, 1.3 CaCl, and 5 d-glucose (pH 7.4). The buffer was gassed continuously with a mixture of 95 % O2 and 5 % CO2. In most experiments, muscles were preincubated in the KR buffer for 60 min before the start of the experiment.
Manipulation of [Na+]i by use of low-Na+ buffer or monensin
To obtain a wider range of intracellular Na+ concentrations, muscle [Na+]i was in some experiments decreased or increased before the effect of salbutamol or excitation on muscle 86Rb+-uptake rate was determined. To decrease [Na+]i, muscles were preincubated for 30–120 min in a KR buffer where half of the Na+ was replaced by N-methyl-d-glucamine (NMDG; low-Na+ buffer). To increase [Na+]i, muscles were preincubated with monensin (a Na+, H+ ionophore). Control experiments showed that after 120 min incubation with 10−5m monensin the muscles were still able to develop 90–98 % of their initial tetanic force elicited by 2 s of stimulation at 60 Hz. Since the incubation with monensin did not result in any significant loss of contractile force, it was assumed that no major cellular damage had occurred during the time of incubation.
Experiments with salbutamol and electrical stimulation
Isolated muscles were placed in polyethylene baskets designed to contain four muscles and to allow rapid transfer from one tube to the next. In some experiments [Na+]i was modified before the start of the experiment as described above. After preincubation, pairs of contralateral muscles were incubated with or without the addition of salbutamol (10−5m).
For electrical excitation, muscles were mounted isometrically and stimulated directly through two platinum electrodes, passing current over the central part of the muscle (field stimulation), using pulses of 1 ms duration and a supramaximal voltage of 12 V. To avoid major increases in [Na+]i short (1-10 s) intervals of stimulation were used (Everts & Clausen, 1994).
Measurements of force
Force was measured as previously described in detail (Clausen & Everts, 1991). Isolated muscles were mounted vertically with their tendons intact in thermostatically controlled chambers. Isometric force was measured using a force displacement transducer (Grass FTO3, MA, USA) and recorded with a chart recorder calibrated with standard weights. After adjustment to optimal length (resting tension, 0.015 ± 0.002 N, n =8) and initial tests of contractility, muscles were equilibrated for at least 30 min without stimulation before the beginning of the experiment.
Electroporation
Electroporation was in some experiments used for Na+ loading of the muscle fibres. The electroporator applies a large electric field across the fibres creating pores in the sarcolemma, but not in the membranes of intracellular organelles, allowing extracellular Na+ ions to enter the fibres. Depending on the intensity and duration of the electric field, most of the pores in the sarcolemma reseal spontaneously (after 6–30 min in plated cells; Teissié et al. 1999).
Isolated muscles in groups of 3 or 4 were preincubated in polyethylene baskets for 30 min in KR buffer. Then they were transferred groupwise to the electroporation cuvette and given three square pulses each lasting 200 μs at 125 V corresponding to an electric field 313 V cm−1, using an Electro Square Porator (ECM 830, BTX, San Diego, CA, USA). After a resting period the muscles were transferred to tubes containing 86Rb+ (0.1 μCi ml−1) and incubated for 5 min. In some experiments the extracellular space was estimated by incubating the muscles for 75 min in KR buffer containing [14C]sucrose (0.1 μCi ml−1) and unlabelled sucrose (1 mm) prior to, during and after electroporation. Afterwards, the muscles were blotted, weighed and soaked overnight in 2 ml 0.3 m trichloroacetic acid (TCA). The following day the [14C]sucrose activity of the TCA extract was determined by liquid scintillation counting and the extracellular volume was calculated by comparison with the activity of [14C]sucrose in the incubation medium.
Intracellular Na+
For determination of intracellular Na+ content muscles were washed 4 × 15 min in ice-cold Na+-free Tris-sucrose buffer containing (mm): 263 sucrose, 10 Tris-HCl, 4.7 KCl, 1.3 CaCl2, 1.2 MgSO4, 1.2 KH2PO4 (pH 7.4). This procedure was in a previous study shown to remove all extracellular Na+. Part of the intracellular Na+ was, however, lost during the washout but this could be corrected for by multiplying the Na+ content of the muscles at the end of the washout by a factor of 1.46. In the present experiments with salbutamol where the washout was performed using the same polyethylene baskets as in the experiments reported earlier (Everts & Clausen, 1992), a correction factor of 1.46 was therefore used for the calculation of the intracellular Na+ content in all muscles undergoing washout. Since the muscles undergoing electrical stimulation in this study were mounted isometrically both during stimulation and washout, control experiments were done to examine whether this might modify the correction factor. Measurements of the Na+ content of 24 soleus muscles performed during washout (60-135 min) showed that the fractional loss of Na+ from isometrically suspended muscles was not changed by prior electrical stimulation (for methods, see Everts & Clausen, 1992). From the regression line correlating time and Na+ content a correction factor of 1.49 for the loss of intracellular Na+ during 60 min of washout was calculated.
After the 4 × 15 min washout at 0 °C, tendons were cut off, and the muscles were blotted and placed in 4 ml counting vials for determination of wet weight. After addition of 2 ml 0.3 m TCA the muscles were allowed to soak for 24 h, which gives complete extraction of Na+ and K+ from the tissue (Clausen et al. 1993). The concentration of Na+ in the TCA extract was measured by flame photometry (FLM3, Radiometer, Copenhagen, Denmark). In a few experiments, the intracellular Na+ content was determined without washout on the basis of measurements of total Na+ content and the extracellular water space. Muscles were equilibrated for 70 or 75 min in buffer containing [14C]sucrose, blotted, weighed and subsequently dried overnight at 60 °C to constant weight for determination of dry weight before the extraction in TCA. Using this technique, the extracellular water space of soleus muscles suspended at resting length was found to be 0.23 ± 0.02 ml (g wet wt)−1 (n = 4), and the intracellular water content of the muscles was calculated to be 0.54 ± 0.02 ml (g wet wt)−1. In a previous study no difference was found in the values for intracellular water content in resting and electrically stimulated muscles (Nielsen & Clausen, 1997). The value of 0.54 ml (g wet wt)−1 was therefore used for calculation of [Na+]i (expressed in mm) in all experiments with electrical stimulation. Thus, following the washout in ice-cold Na+-free buffer [Na+]i was calculated as total tissue Na+ content (in μmol (g muscle wet wt)−1) divided by 0.54. In some experiments, the Li+ content was measured by flame photometry, using K+ as internal standard.
86Rb+ uptake rate and Na+–K+ pump activity
After stimulation or equilibration the muscles were generally incubated for 1–10 min in buffer containing 86Rb+ (0.1 μCi ml−1). In some experiments, where muscles were only incubated for 10–20 s, the content of 86Rb+ was increased to 1 μCi ml−1. Incubation was followed by washout for 4 × 15 min at 0 °C in Na+-free Tris-sucrose buffer to remove extracellular 86Rb+. In control experiments the time-course of the decrease in 86Rb+ content of the muscles during washout in the cold was followed for 150 min. This showed that the standard 4 × 15 min washout procedure gave values for intracellular 86Rb+ content that were only around 5 % lower than the extrapolated intracellular 86Rb+ content at the onset of the washout. Moreover, the effect of electrical stimulation and salbutamol on 86Rb+ uptake could not be attributed to differences in the rate of 86Rb+ washout. Likewise, previous studies have shown that the loss of intracellular K+ during washout in the cold is negligible and unaffected by prior electrical stimulation (Everts & Clausen, 1992). For these reasons, the 86Rb+ content of the muscles was not corrected for the rather modest loss during washout. After wash, the muscles were blotted, weighed for determination of wet weight and taken for counting of 86Rb+ activity by Cerenkov radiation in a β-counter while soaking in 2 ml 0.3 m TCA in 4 ml counting vials. The amount of 86Rb+ activity retained after the cold wash was calculated and expressed as the relative uptake of the 86Rb+ activity from the incubation medium by the muscle. The uptake of K+ was then calculated by converting the relative uptake of 86Rb+ to K+ using the concentration of K+ in the incubation medium. Earlier studies with resting, electrically stimulated, or Na+-loaded muscles showed that the use of 86Rb+ and 42K+ gave closely similar results for the Na+–K+ pump-mediated K+ uptake and, thus, are suitable and comparable tracers for the transport of K+ via that system (Clausen et al. 1987; Everts et al. 1988; Dørup & Clausen, 1994).
Chemicals and isotopes
All chemicals were of analytical grade. N-methyl-d-glucamine and salbutamol were from Sigma-Aldrich. Bumetanide was a gift from Leo Pharmaceutical Products, Ltd, Copenhagen, Denmark. 86RbCl (0.4 Ci mmol−1) and [14C]sucrose (0.6 Ci mmol−1) were from Amersham International (Aylesbury, Bucks, UK).
Statistics
All data are expressed as means ± s.e.m. The statistical significance of any difference was ascertained using Students's two-tailed t test for non-paired observations.
Results
Effects of salbutamol and excitation on [Na+]i and 86Rb+ uptake rate
Figure 1 shows the time course of the changes in [Na+]i and 86Rb+ uptake rate in muscles during 5 min of incubation with or without the addition of 10−5m salbutamol. After 2 and 5 min of incubation with salbutamol, [Na+]i was significantly reduced by 22 and 39 %, respectively, compared to control muscles. After 1, 2 and 5 min of incubation with salbutamol 86Rb+ uptake rate was increased by 28, 57 and 52 %, respectively.
Figure 1. Time course of the effects of salbutamol on [Na+]i and 86Rb+ uptake rate in rat soleus muscle.

Groups of four muscles in polyethylene baskets were preincubated for 2 × 30 min in KR buffer. At time zero they were transferred into KR buffer containing 86Rb+ (0.1 μCi ml−1) ± 10−5m salbutamol and incubated for 1–5 min. After incubation the muscles were washed for 4 × 15 min in ice-cold Na+-free Tris-sucrose buffer, blotted and taken for counting of 86Rb+ activity and determination of [Na+]i (see Methods for details). •, control muscles; ○, incubated with 10−5m salbutamol. Each point represents the mean value ± s.e.m. of observations on 4 muscles.
The duration of the electrical stimulation was varied in order to determine the shortest stimulation period sufficient to produce an undershoot in [Na+]i during a subsequent 10 min recovery period. From Fig. 2 it can be seen that a significant effect of electrical stimulation on [Na+]i could be elicited after only 1 s of stimulation at 60 Hz, which reduced [Na+]i by 13 % (P < 0.004). After 2, 5 and 10 s of electrical stimulation [Na+]i was reduced by 20, 25 and 30 %, respectively. Accordingly, in most of the following experiments with excitation, a stimulation period of 10 s was used in order to ascertain a large detectable effect of the electrical stimulation.
Figure 2. Effects of duration of electrical stimulation on undershoot in [Na+]i after 10 min of recovery in rat soleus muscle.
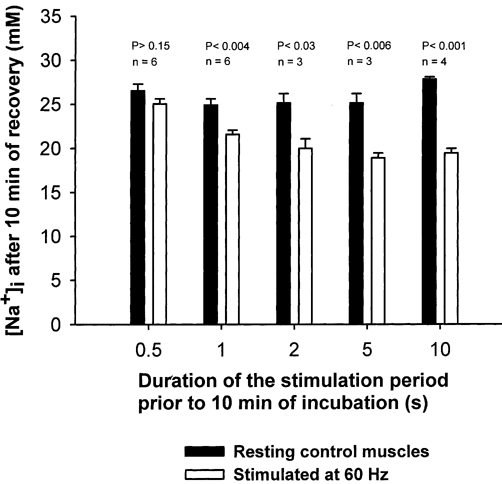
Muscles mounted isometrically on electrodes were preincubated for 2 × 30 min in KR buffer. Then they were stimulated for 0.5-10 s at 60 Hz (1 ms and 10 V) and incubated for another 10 min without stimulation. Finally the muscles were washed 4 × 15 min in ice-cold Na+-free Tris-sucrose buffer, blotted and taken for determination of [Na+]i (see Methods for details). Each column represents the mean value with bars denoting s.e.m. of observations on 3–6 muscles.
As shown in Fig. 3, the time course of the effects of electrical stimulation on [Na+]i and 86Rb+ uptake rate was strikingly different from that seen after addition of salbutamol. Within the first minute after the 10 s of stimulation at 60 Hz, there was no significant change in [Na+]i. At 2 and 4 min after the 10 s of stimulation at 60 Hz [Na+]i was 20 and 30 % lower, respectively, than in the resting control muscles. It should be noted that already within the first 10, 20 and 60 s after the cessation of stimulation, 86Rb+ uptake rate was 86, 107 and 73 % higher than in the resting control muscles, respectively, in spite of the fact that [Na+]i showed no significant increase. Moreover, immediately after the 10 s stimulation, [Na+]i was only increased by 11 % (from 25.0 ± 1.3 to 27.9 ± 0.6 mm; n = 4 vs. 4 muscles), which was not significant. Two to four minutes after the cessation of stimulation, muscles were able to maintain a significantly higher uptake rate of 86Rb+ than the resting control muscles, even though [Na+]i was still significantly lower. Additional experiments showed that both the undershoot in [Na+]i and the concomitant increase in 86Rb+ uptake rate following 10 s of 60 Hz stimulation, were abolished if the muscles had been preincubated with ouabain (10−3m) for 10 min before stimulation. Thus, 2 min into the post-excitatory recovery period [Na+]i was 57.8 ± 1.8 and 57.2 ± 1.6 mm without and with stimulation, respectively, while the 86Rb+ uptake rate was 307 ± 5 and 268 ± 8 nmol (g wet wt)−1 min−1 without and with stimulation, respectively; n =6 vs. 6 muscles).
Figure 3. Time course of the effects of 10 s of electrical stimulation on [Na+]i and86Rb+ uptake rate in rat soleus muscle.
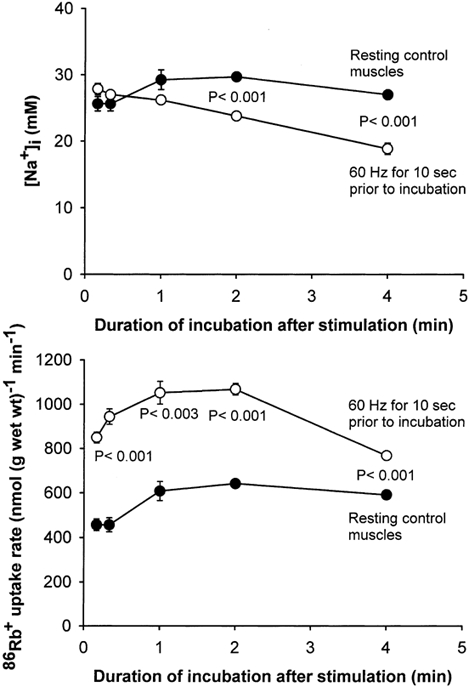
Muscles mounted isometrically on electrodes were preincubated for 2 × 30 min in KR buffer. Then they were stimulated for 10 s at 60 Hz (1 ms pulses at 10 V), immediately transferred into KR buffer containing 86Rb+ (0.1 μCi ml−1) and incubated for 1–4 min. In a few experiments, muscles were incubated for 10–20 s in a buffer containing 1 μCi ml−186Rb+. Finally the muscles were washed 4 × 15 min in ice-cold Na+-free Tris-sucrose buffer, blotted and taken for counting of 86Rb+ activity and determination of [Na+]i (see Methods for details). •, resting control muscles; ○, muscles stimulated electrically. Each point represents the mean value ± s.e.m. of observations on 3–8 muscles.
The effects of shorter periods of electrical stimulation were further explored by measuring the rate of 86Rb+ uptake during the first 10 and 120 s after 1 s of stimulation at 60 Hz. This showed a 23 and 40 % increase, respectively, in 86Rb+ uptake rate (n =6 vs. 6, P < 0.001), but no significant change in [Na+]i. Again, measurements performed immediately after the cessation of stimulation showed a non-significant increase in [Na+]i of 2 % (n =6 vs. 6 muscles).
Since it could be argued that 60 Hz is not an entirely physiological stimulus for rat soleus, the effect of low-frequency stimulation on the rate of 86Rb+ uptake was also explored. In these experiments we also assessed whether the excitation-induced increase in the rate of 86Rb+ uptake could mediated by the sodium-potassium-chloride cotransport system. As shown in Table 1, stimulation at 2 Hz produced a substantial and significant increase in the rate of 86Rb+ uptake, both during 2 and 10 min of stimulation. This effect was not suppressed by bumetanide added at a concentration (10−4m) previously shown to produce maximum inhibition of resting 86Rb+ uptake rate (Dørup & Clausen, 1994). Also in the present experiments, bumetanide clearly reduced the rate of 86Rb+ uptake.
Table 1.
Effect of electrical stimulation and bumetanide on 86Rb+ uptake in rat soleus
| Expermental conditions | 86Rb+ uptake in rate (nmol (g wet wt)−1 min−1) | P | Stim. induced increase (nmol (g wet wt)−1 min−1) |
|---|---|---|---|
| 2 min incubations | |||
| Controls | 439 ± 24(3) | — | — |
| Stim. (2Hz) | 642 ± 4 (3) | <0.002 | 203 |
| Bumetanide (10−4m) | 281 ± 44 (3) | — | — |
| Bumetanide (10−4m) + Stim. (2 Hz) | 549 ± 57 (3) | <0.03 | 268 |
| 10 min incubations | |||
| Controls | 443 ± 22 (6) | — | — |
| Stim. (2Hz) | 657 ± 36 (6) | <0.001 | 225 |
| Bumetanide (10−4m) | 337 ± 13 (6) | — | — |
| Bumetanide (10−4m) + Stim. (2 Hz) | 660 ± 25 (6) | <0.001 | 323 |
Muscles were mounted on electrodes and preincubated wtihout or with bumetanide (10−4m) for 15 min in standard Krebs-Ringer bicarbonate buffer. Then the incubations were continued in the presence of 86Rb+ (0.1 μCi ml−1) for 2 or 10 min without or with electrical stimulation at 2 Hz (1 ms pulses of 10 V), washed 4 × 15 min in ice-cold Na+ free Tris-sucrose buffer, blotted, weighed and taken for counting. For details, see Everts & Clausen (1994). The rates of 86Rb+ uptake are given as mean ± s.e.m. in nmol (g wet wt)−1 min−1 with the number of muscles in parentheses.
To examine if the effects of salbutamol and electrical stimulation were additive, we tested whether stimulation at 60 Hz also produced an undershoot in intracellular Na+ in muscles that had been preincubated with salbutamol. In muscles incubated for 40 min with 10−5m salbutamol, [Na+]i was 11.3 ± 0.6 mm (n =3). This value was the same as [Na+]i in muscles that were treated identically but in addition stimulated electrically for 30 s at 60 Hz 10 min before the end of the experiment (11.3 ± 1.1 mm; n =3). Likewise, no significant effect of electrical stimulation was found on the rate of 86Rb+ uptake, which was 660 ± 31 and 737 ± 30 nmol (g wet wt)−1 min−1 in muscles exposed to salbutamol or to salbutamol and electrical stimulation, respectively (P > 0.15; n =3 vs. 3).
Figure 4 shows the effect of salbutamol on the relation between 86Rb+ uptake rate, measured during an incubation period of 10 min, and [Na+]i over a range of [Na+]i values. The [Na+]i values of the control muscles ranged from 25 to 70 mm and the 86Rb+ uptake rates ranged from 511 to 1196 nmol (g wet wt)−1 min−1. The addition of salbutamol 30 min before the measurement of 86Rb+ uptake caused a shift of the curve to the left. Both curves seemed to merge at the highest values of [Na+]i, indicating that the maximum rate of 86Rb+ rate was not increased by salbutamol.
Figure 4. Effects of salbutamol on the relation between [Na+]i and 86Rb+ uptake rate in rat soleus muscle.

Groups of 4 muscles in polyethylene baskets were preincubated in KR buffer for 30–120 min. Then they were transferred to KR buffer containing 86Rb+ (0.1 μCi ml−1) and incubated for 10 min. Finally, the muscles were washed for 4 × 15 min in ice-cold Na+-free Tris-sucrose buffer, blotted and taken for counting of 86Rb+ activity and determination of [Na+]i (see Methods for details). In some experiments [Na+]i was manipulated by preincubating for 30–120 min in buffer where half of the Na+ was replaced with N-methyl-d-glucamine or in standard KR buffer where 10−6-10−4m monensin was added. •, control muscles; ○, 10−5m salbutamol added 30 min before determination of 86Rb+ uptake rate. Each point represents the mean value ± s.e.m. of observations on 4 muscles. The curves were fitted using a computer program.
Figure 5 shows the effects of electrical stimulation over a range of [Na+]i. Electrical stimulation, like salbutamol, produced a leftward shift of the curve representing the relation between 86Rb+ uptake rate and [Na+]i. Here the [Na+]i values of the unstimulated control muscles ranged from 21 to 69 mm and the 86Rb+ uptake rates ranged from 454 to 1081 nmol (g wet wt)−1 min−1. In these experiments the 86Rb+ uptake rate of the controls was slightly lower than in those illustrated in Fig. 4, possibly due to the shorter incubation (2 min) allowing incomplete access of the isotope to the central fibres of the muscles. Again, at the highest values of [Na+]i both the controls and the stimulated muscles showed evidence of saturation but it could not be ascertained whether the maximum rate of 86Rb+ uptake was increased by electrical stimulation.
Figure 5. Effects of electrical stimulation on the relation between [Na+]i and 86Rb+ uptake rate in rat soleus muscle.
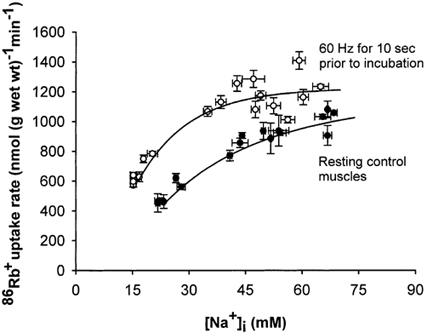
Muscles mounted isometrically on electrodes were preincubated in KR buffer. Then they were stimulated for 10 s at 60 Hz (1 ms pulses at 10 V). After a resting period of 2 min they were transferred into tubes containing 86Rb+ (0.1 μCi ml−1) and incubated for 2 min. Finally the muscles were washed 4 × 15 min in ice-cold Na+ -free Tris-sucrose buffer, blotted and taken for counting of 86Rb+ activity and determination of [Na+]i (see Methods for details). [Na+]i was manipulated by preincubating for 30–120 min in buffer where half of the Na+ was replaced with N-methyl-d-glucamine or in standard KR buffer with 10−6-10−4m monensin. •, resting control muscles; ○, muscles stimulated electrically. Each point represents the mean value ± s.e.m. of observations on 3 muscles. The curves were fitted using a computer program.
Na+-independent activation of the Na+–K+pump
Experiments were done to examine whether the excitation-induced increase in the rate of 86Rb+ uptake and the undershoot in [Na+]i were triggered by an effect on the Na+–K+ pump of the action potentials or of the rapid increase in [Na+]i associated with the action potentials. To examine the effects of action potentials separately, i.e. without any influx of Na+ during excitation, muscles were stimulated in a buffer where all the Na+ had been replaced by Li+. Since the permeability ratio of the Na+ channels for Li+ and Na+ is almost one (Zacharova et al. 1983), excitation of muscles incubated in Li+-buffer still elicits action potentials but initiated by influx of Li+ via Na+ channels (Keynes & Swan, 1959). Control experiments showed that after 10 min of incubation, muscles incubated in the Li+-KR buffer were still able to develop 93–96 % of their initial tetanic force when stimulated electrically (2 s at 30 Hz), indicating that replacing Na+ by Li+ had only minor effects on excitability.
Figure 6 shows that after 10 min of incubation in Li+-KR buffer, stimulation for 10 s at 60 Hz led to a 23 % reduction in [Na+]i (n =5 vs. 5, P < 0.02) during the subsequent 1 min recovery period in the standard KR buffer and a 21 % increase of the rate of 86Rb+ uptake (n =5 vs. 5, P < 0.03). Thus, an increase in [Na+]i is not required for activation of the Na+–K+ pump. The action potentials seem to be an adequate signal. It should be noted that in the muscles incubated in Li+-KR, the intracellular Li+ concentration after washout in the cold was 9.8 ± 0.4 and 14.1 ± 0.4 mm in the resting and stimulated muscles, respectively (P < 0.001; n =5 vs. 5). This shows that excitation leads to increased entry of Li+ and that in contrast to Na+, the intracellular Li+ level does not develop an ‘undershoot’. This is in keeping with the observation that intracellular Li+ is not a strong activator for the Na+–K+ pump, only allowing a Li+ efflux between 1/10th and 1/25th of the Na+ efflux (Keynes & Swan, 1959).
Figure 6. Effects of electrical stimulation during incubation in Li+-KR buffer on [Na+]i and 86Rb+ uptake rate in rat soleus muscle.

Muscles mounted isometrically on electrodes were preincubated for 30 min in KR buffer followed by 10 min of preincubation in Li+-KR buffer. Then they were stimulated for 10 s at 60 Hz (1 ms pulses at 10 V) and immediately transferred into tubes containing standard KR buffer with 86Rb+ (0.1 μCi ml−1) and incubated for 1 min. Finally the muscles were washed 4 × 15 min in ice-cold Na+-free Tris-sucrose buffer, blotted and taken for counting of 86Rb+ activity and determination of [Na+]i (see Methods for details). Each column represents the mean value with bars denoting s.e.m. of observations on 5 muscles.
Effects of electroporation-induced elevation of intracellular Na+
Electroporation elicits a rapid, but reversible breakdown of cell membrane integrity (Teissié et al. 1999). This would allow prompt and short-lasting influx of Na+ and could indicate whether this alone was sufficient to elicit a stimulation of the rate of 86Rb+ uptake and a subsequent undershoot in intracellular Na+. Figure 7A shows that 5 min after electroporation there was a small, but not significant increase in the total Na+ content of the muscle, measured without washout in ice-cold Na+-free buffer. Additional experiments with electroporation were done to determine the Na+ content in the space not accessible to [14C]sucrose. In these experiments no significant change in the [14C]sucrose space was found. Figure 7A shows that in response to electroporation the intracellular Na+ content increased by around 7 μmol (g wet wt)−1 (P < 0.004), which was similar to the increase in the total Na+ content. As shown in Fig 7B this increase in [Na+]i was associated with a marked (97 %) increase in 86Rb+ uptake rate (n =6 vs. 6, P < 0.001). The initial increase in Na+ was not followed by any significant undershoot in the total Na+ content or [Na+]i measured up to 20 min after electroporation. In the presence of ouabain (10−3m, added 10 min before), electroporation clearly increased Na+ uptake, but the stimulating effect of electroporation on the rate of 86Rb+ uptake was totally abolished, demonstrating that this was not due to non-specific inward leakage of 86Rb+ (data not presented, n =6 muscles).
Figure 7. Effects of electroporation on total Na+ content, intracellular Na+ content and 86Rb+ uptake rate in rat soleus muscle.
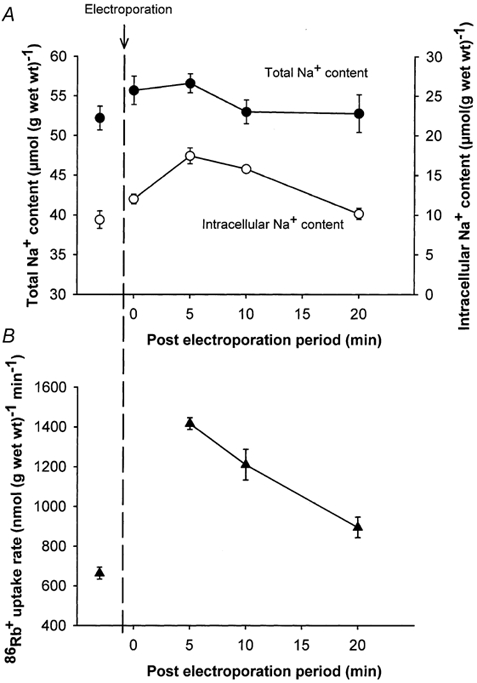
Isolated muscles in groups of 3 or 4 were placed in polyethylene baskets and incubated at 30 °C in KR buffer. Then the groups of muscles were transferred to an electroporation cuvette containing KR buffer and given three square pulses at 125 V (313 V cm−1) and for a 200 μs duration followed by resting periods lasting from 0 to 15 min. Afterwards they were incubated for 5 min in KR buffer containing 86Rb+ (0.1 μCi ml−1), blotted and taken for counting of 86Rb+ activity and determination of Na+ content (see Methods for details). In some experiments muscles were preincubated for 75 min in KR buffer containing [14C]sucrose (0.1 μCi ml−1) and 1 mm unlabelled sucrose before they were transferred to the electroporation cuvette containing KR buffer with the same concentrations of [14C]sucrose and unlabelled sucrose as in the incubation medium and stimulated 3 times for 200 μs at 125 V (313 V cm−1). Subsequently the muscles were incubated for 5–20 min in KR containing [14C]sucrose. Each point represents the mean value ± s.e.m. of observations on 4–6 muscles.
Discussion
Effects of salbutamol and excitation on [Na+]i and 86Rb+ uptake rate
This study demonstrates that in rat soleus muscle salbutamol (Fig. 1 and Fig. 4) and recovery from short intervals of excitation (Figs 2, 3 and 5) induce a decrease in [Na+]i, which is associated with an increase in 86Rb+ uptake rate and that these effects can be seen within 1–2 min. Moreover, already during the first 10 s of recovery after 1 s of stimulation at 60 Hz, 86Rb+ uptake rate shows a significant increase of 22 % and during recovery after 10 s of stimulation the 86Rb+ uptake rate is doubled. The excitation-induced undershoot in [Na+]i can be elicited by only 1 s of stimulation at 60 Hz and is maintained for at least 10 min.
Previous studies have shown that the effects of both salbutamol and excitation on [Na+]i and 86Rb+ uptake can be abolished by ouabain or by cooling to 0 °C (Clausen & Flatman, 1977; Juel, 1986; Everts & Clausen, 1994; Nielsen & Clausen, 1997). Likewise, the present experiments showed that the effects of excitation on [Na+]i and the rate of 86Rb+ uptake were blocked by ouabain, indicating that the changes were caused by an increase in the activity of the Na+–K+ pump. This conclusion is supported by the finding that after electrical stimulation similar to that used in this study, no changes were found in muscle water content or in the passive rate of uptake of 22Na+ (Nielsen & Clausen, 1997). Thus, the decrease in intracellular Na+ following excitation does not reflect an increase in water content or a decreased Na+ influx into the muscle fibres. Taken together, these results show that the net extrusion of Na+ and the increased rate of 86Rb+ uptake during recovery after electrical stimulation reflect an increased activity of the Na+–K+ pump. When exposed to repeated excitation at 2 Hz for 2 or 10 min, 86Rb+ uptake was clearly stimulated. In keeping with previous studies (Everts et al. 1988; Everts & Clausen, 1992; 1994), this demonstrates that increased 86Rb+ uptake can be elicited even at rather low frequencies of stimulation. Moreover, since this increase could not be blocked by bumetanide, it cannot be attributed to stimulation of the sodium-potassium-chloride cotransport system.
Excitation is associated with simultaneous increases in [Na+]i and [K+]o, which according to traditional views, could explain the activation of the Na+–K+ pump (for review see Semb & Sejersted, 1996). In agreement with this, the curves representing the control muscles in Fig. 4 and Fig. 5, illustrate that the monensin-induced elevation of [Na+]i alone leads to an increase in 86Rb+ uptake rate. Figure 4 and Figure 5 show, however, that addition of salbutamol or electrical stimulation for 10 s at 60 Hz produce a leftward shift of the curves relating the 86Rb+ uptake rate to [Na+]i. These leftward shifts could, like the observation that an increased 86Rb+ uptake rate can be maintained under conditions where [Na+]i is below resting level (Fig. 1 and Fig. 3), indicate that both salbutamol and excitation stimulate the Na+–K+ pump by increasing its affinity for intracellular Na+. Whereas the maximum rate of 86Rb+ uptake seemed unaffected by salbutamol, the data do not exclude the possibility that electrical stimulation induces a minor increase in the maximum rate of 86Rb+ uptake. In a previous study (Everts et al. 1988), 2 Hz stimulation failed to increase further Na+–K+ pump activity in muscles incubated with adrenaline. Together with the present finding that the effects of salbutamol and excitation on [Na+]i and 86Rb+ uptake rate were not additive, this suggests that β2-adrenoceptor stimulation and action potentials stimulate the same activating mechanism for the Na+–K+ pump.
In the context of excitation-induced Na+ influx, it has been suggested that due to compartmentalization of intracellular Na+, the influx of Na+ during action potentials will preferentially give rise to an increase in [Na+]i in the subsarcolemmal space, which could augment the Na+-induced increase in Na+–K+ pump activity to a larger extent than predicted by the average rise in [Na+]i (Akera et al. 1976; Semb & Sejersted, 1996). In the experiments shown in Fig. 3 and Fig. 5, however, care was taken to ensure that the relation between [Na+]i and Na+–K+ pump activity only was determined after average [Na+]i had returned to the prestimulated value or below. The observed increase in Na+–K+ pump activity cannot therefore be explained by an increase in the average intracellular level of Na+. Moreover, it seems unlikely that a compartmentalized rise in the concentration of Na+ in the subsarcolemmal space (or around the t-tubules) can be maintained long enough to cause an increased rate of 86Rb+ uptake 2–4 min after the cessation of excitation. Finally, the considerable (32 %) postexcitatory ‘undershoot’ in intracellular Na+, which can be maintained for up to 25 min after electrical stimulation (Nielsen & Clausen, 1997), cannot be explained by an elevated subsarcolemmal Na+ level.
Another explanation for the excitation-induced decrease in [Na+]i and increase in 86Rb+ uptake rate could be that Na+–K+ pumps are being translocated from an intracellular pool to the plasma membrane. This would increase the content of Na+–K+ pumps in the plasma membrane leading to a higher ion transport capacity. A study of rat soleus muscle showed that 1 h of treadmill running increased the plasma membrane content of the α2-subunit isoform of the Na+–K+ pump by 43 % (Tsakiridis et al. 1996). Likewise, a study of human vastus lateralis muscles showed a 33 % elevation of sarcolemmal Na+–K+ pumps after exercise to exhaustion (2.8-7.8 min), and it was concluded that translocation of Na+–K+ pump subunits to the sarcolemma is an important mechanism in the adaptation of the Na+–K+ pump to the demands during muscle activity (Juel et al. 2000). An exercise-induced increase in Na+–K+ pumps in the sarcolemma of up to 32 % has also been reported in rat skeletal muscle (Juel et al. 2001). From these data it was concluded that both low and high intensity exercise are able to induce a translocation of pumps to the sarcolemmal membrane. However, several lines of evidence argue against these conclusions. Firstly, a recent study of rat soleus and extensor digitorum longus muscles showed that electrical stimulation causing a close-to-maximum increase in net Na+ extrusion produced no significant change in [3H]ouabain binding sites per gram of tissue (wet or dry weight). It was concluded that the effect of electrical stimulation on the Na+–K+ pump in rat skeletal muscle is not accounted for by an acute increase in the contents of functional Na+–K+ pumps in the sarcolemma (McKenna et al. 2002). Secondly, in the study by Tsakiridis et al. (1996) it was found that following exercise in rats, there was no significant change in the internal membrane fraction of Na+–K+ pumps, which would be expected if significant translocation of Na+–K+ pumps from an internal pool were taking place. Thirdly, the translocation studies were weakened by the fact that the determination of membrane bound Na+–K+ pumps was based on a membrane isolation procedure with a very modest recovery (less than 5 %), making the measurements very sensitive to effects of the isolation procedure on the yield of representative plasma membranes.
Na+-independent activation of the Na+–K+pump
The recurring message of the present study is that during the recovery following electrical stimulation, the rate of 86Rb+ uptake is increased, even when [Na+]i is reduced or unaltered. Thus, only 1 s of stimulation at 60 Hz caused no significant rise in [Na+]i, but a 40 % increase in the rate of 86Rb+ uptake measured over the following 2 min. The minute increase in [Na+]i is in keeping with measurements of excitation-induced Na+ influx, which amounts to 2.4 nmol (g wet wt)−1 (action potential)−1 corresponding to an increase in [Na+]i of 0.28 mm or around 1 % following 1 s of stimulation at 60 Hz (Nielsen & Clausen, 1997). As shown in Fig. 4 and Fig. 5, an increase in [Na+]i of 1 % does not give rise to any measurable increase in 86Rb+ uptake rate, suggesting that the effect of electrical stimulation on Na+–K+ pump activity cannot be ascribed to the excitation-induced elevation of [Na+]i. These results are in keeping with the earlier observation that 1 or 10 s of 60 Hz stimulation produced, respectively, a 22 and 57 % increase in the efflux of 22Na+ from 22Na+-preloaded rat soleus muscles as measured in standard KR buffer at 30 °C (Everts & Clausen, 1994). Such effects are difficult to explain by an influx of unlabelled Na+ from the incubation medium. If anything, this should lead to dilution of the intracellular isotope and decreased efflux of 22Na+. The stimulation of 22Na+ efflux is more likely to reflect an excitation-induced increase in the affinity of the Na+–K+ pump for intracellular Na+. Moreover, as shown in Fig. 6, muscles incubated in buffer where all Na+ had been replaced by Li+ prior to electrical stimulation are still able to create an undershoot in [Na+]i during recovery in a standard KR buffer. In spite of a significant (23 %) decrease in [Na+]i, the rate of 86Rb+ uptake was significantly higher (20 %), indicating that the affinity of the Na+–K+ pump for intracellular Na+ had increased. This indicates that the excitation-associated activation of the Na+–K+ pump can be elicited by the action potentials per se and may not depend on a concomitant rapid influx of Na+ and ensuing rise in [Na+]i.
Effects of electroporation-induced elevation of intracellular Na+
Following electroporation there was an increase in total Na+ content as well as in intracellular Na+ content, but this did not elicit any undershoot in intracellular Na+ content during the following 20 min of recovery (Fig. 7). These data indicate that the undershoot seen after electrical stimulation is not the simple outcome of an elevation of intracellular Na+, but may require action potentials. This is in keeping with the experiments with monensin (Fig. 4 and Fig. 5), showing that increasing [Na+]i induces progressive stimulation of the 86Rb+ uptake rate but no undershoot in [Na+]i. Following electroporation, there was a 97 % increase in the 86Rb+ uptake rate and this was suppressed by ouabain, indicating that it was the result of stimulation of the Na+–K+ pump.
Physiological significance of increased Na+–K+ pump affinity during contractile activity
A rapid increase of the affinity of the Na+–K+ pump for intracellular Na+ induced by β2-agonists or excitation has two implications. (1) It improves and accelerates the restoration of the transmembrane chemical gradients for Na+ and K+ during work. Thus, during recovery after stimulation at 60 Hz [Na+]i can be reduced below resting level (Fig. 2 and Fig. 3) and this lowered [Na+]i can be maintained for up to 30 min (Nielsen & Clausen, 1997). (2) An activation of the Na+–K+ pump increases its electrogenic contribution to the membrane potential (Hicks & McComas, 1989) and thereby further protects the excitability of the muscle fibres.
Several studies indicate that both the increase in the electrogenic contribution of the Na+–K+ pump and the improved maintenance of the chemical Na+–K+ gradients limits the development of contractile failure due to reduced excitability in working muscles (for review see Nielsen & Clausen, 2000). In addition, an increase in its affinity for intracellular Na+ lasting for several minutes after the cessation of contraction could prepare the muscle for subsequent contractions.
In conclusion, both salbutamol and excitation induce a decrease in [Na+]i, which is associated with an increase in the 86Rb+ uptake rate. This indicates that β2-agonists and excitation cause an increase in the affinity of the Na+–K+ pump for intracellular Na+. Thus, during intense exercise, both the increased plasma level of catecholamines (Galbo et al. 1975) and the excitation of the muscles contribute to a faster restoration of the Na+–K+ homeostasis during work and optimize the maintenance of excitability and contractile performance of the muscles.
Acknowledgments
We thank Tove Lindahl Andersen, Vibeke Uhre, Marianne Stürup Johansen and Ann-Charlotte Andersen for skilled technical assistance. We thank Professor H. Rasmussen for proposing excitation experiments in Li+-substituted buffer. The study was supported by grants from the Danish Medical Research Council (j. nr. 9802488) and the Danish Biomembrane Research Centre.
References
- Akera T, Bennet RT, Olgaard MK, Brody TM. Cardiac Na+, K+-adenosine triphosphatase inhibition by ouabain and myocardial sodium: A computer simulation. Journal of Pharmacology and Experimental Therapeutics. 1976;199:287–297. [PubMed] [Google Scholar]
- Bigland-Ritchie B, Jones DA, Woods JJ. Excitation frequency and muscle fatigue: electrical responses during human voluntary and stimulated contractions. Experimental Neurology. 1979;64:414–427. doi: 10.1016/0014-4886(79)90280-2. [DOI] [PubMed] [Google Scholar]
- Buchanan R, Nielsen OB, Clausen T. Excitation- and β2-agonist-induced activation of the Na+, K+-pump in skeletal muscle. Acta Physiologica Scandinavica. 2002;174:A182. [Google Scholar]
- Clausen T, Andersen SLV, Flatman JA. Na+–K+-pump stimulation elicits recovery of contractility in K+-paralysed rat muscle. Journal of Physiology. 1993;472:521–536. doi: 10.1113/jphysiol.1993.sp019960. [DOI] [PMC free article] [PubMed] [Google Scholar]
- Clausen T, Everts ME. K+ induced inhibition of contractile force in rat skeletal muscle: role of active Na+–K+ transport. American Journal of Physiology. 1991;261:799–807. doi: 10.1152/ajpcell.1991.261.5.C799. [DOI] [PubMed] [Google Scholar]
- Clausen T, Everts ME, Kjeldsen K. Quantification of the maximum capacity for active sodium-potassium transport in rat skeletal muscle. Journal of Physiology. 1987;388:163–181. doi: 10.1113/jphysiol.1987.sp016608. [DOI] [PMC free article] [PubMed] [Google Scholar]
- Clausen T, Flatman JA. The effect of catecholamines on Na-K transport and membrane potential in rat soleus muscle. Journal of Physiology. 1977;270:383–414. doi: 10.1113/jphysiol.1977.sp011958. [DOI] [PMC free article] [PubMed] [Google Scholar]
- Clausen T, Nielsen OB. Rapid activation of the Na+, K+-pump - mechanisms and functional significance. Biologiske skrifter Det Kongelige Danske Videnskabernes Selskab. 1998;49:153–158. [Google Scholar]
- DøRUP I, Clausen T. 86Rb is not a reliable tracer for potassium in skeletal muscle. Biochemical Journal. 1994;302:745–751. doi: 10.1042/bj3020745. [DOI] [PMC free article] [PubMed] [Google Scholar]
- Everts ME, Clausen T. Activation of the Na-K pump by intracellular Na in rat slow- and fast-twitch muscle. Acta Physiologica Scandinavica. 1992;145:353–362. doi: 10.1111/j.1748-1716.1992.tb09375.x. [DOI] [PubMed] [Google Scholar]
- Everts ME, Clausen T. Excitation-induced activation of the Na+, K+-pump in rat skeletal muscle. American Journal of Physiology. 1994;266:925–934. doi: 10.1152/ajpcell.1994.266.4.C925. [DOI] [PubMed] [Google Scholar]
- Everts ME, RetterstØL K, Clausen T. Effects of adrenaline on excitation-induced stimulation of the sodium-potassium pump in rat skeletal muscle. Acta Physiologica Scandinavica. 1988;134:189–198. doi: 10.1111/j.1748-1716.1988.tb08479.x. [DOI] [PubMed] [Google Scholar]
- Feraille E, Carranza ML, Rousselot M, Favre H. Insulin enhances sodium sensitivity of Na-K-ATPase in isolated rat proximal convoluted tubules. American Journal of Physiology. 1994;267:F55–62. doi: 10.1152/ajprenal.1994.267.1.F55. [DOI] [PubMed] [Google Scholar]
- Galbo H, Holst JJ, Christensen NJ. Glucagon and plasma catecholamine responses to graded and prolonged exercise in man. Journal of Applied Physiology. 1975;38:70–76. doi: 10.1152/jappl.1975.38.1.70. [DOI] [PubMed] [Google Scholar]
- Hansen PS, Buhagiar KR, Gray DF, Rasmussen HH. Voltage-dependent stimulation of the Na+–K+ pump by insulin in rabbit cardiac myocytes. American Journal of Physiology - Cell Physiology. 2000;278:C546–553. doi: 10.1152/ajpcell.2000.278.3.C546. [DOI] [PubMed] [Google Scholar]
- Hazeyama Y, Sparks HV. A model of potassium ion efflux during exercise of skeletal muscle. American Journal of Physiology. 1979;236:R83–90. doi: 10.1152/ajpregu.1979.236.1.R83. [DOI] [PubMed] [Google Scholar]
- Hicks A, McComas AJ. Increased sodium pump activity following repetitive stimulation of rat soleus muscles. Journal of Physiology. 1989;414:337–349. doi: 10.1113/jphysiol.1989.sp017691. [DOI] [PMC free article] [PubMed] [Google Scholar]
- Hsu YM, Guidotti G. Effects of hypokalemia on the properties and expression of the (Na+, K+)-ATPase of rat skeletal muscle. Journal of Biological Chemistry. 1991;266:427–433. [PubMed] [Google Scholar]
- James JH, Wagner KR, King J-K, Leffler RE, Upputuri RK, Balasubramaniam A, Friend LA, Shelly DA, Paul RJ, Fischer JE. Stimulation of both aerobic glycolysis and Na+–K+-ATPase activity in skeletal muscle by epinephrine or amylin. American Journal of Physiology. 1999;277:E176–186. doi: 10.1152/ajpendo.1999.277.1.E176. [DOI] [PubMed] [Google Scholar]
- Juel C. Potassium and sodium shifts during in vitro isometric muscle contraction, and the time course of the ion-gradient recovery. Pflügers Archiv. 1986;406:458–463. doi: 10.1007/BF00583367. [DOI] [PubMed] [Google Scholar]
- Juel C, Grunnet L, Holse M, Kenworthy S, Sommer V, Wulff T. Reversibility of exercise induced translocation of Na+–K+ pump subunits to the plasma membrane in rat skeletal muscle. Pflügers Archiv. 2001;443:212–217. doi: 10.1007/s004240100674. [DOI] [PubMed] [Google Scholar]
- Juel C, Nielsen JJ, Bangsbo J. Exercise-induced translocation of Na+, K+ pump subunits in the plasma membrane in human skeletal muscle. American Journal of Physiology - Regulatory, Integrative and Comparative Physiology. 2000;278:R1107–1110. doi: 10.1152/ajpregu.2000.278.4.R1107. [DOI] [PubMed] [Google Scholar]
- Keynes RD, Swan RC. The permeability of frog muscle fibres to lithium ions. Journal of Physiology. 1959;147:626–638. doi: 10.1113/jphysiol.1959.sp006265. [DOI] [PMC free article] [PubMed] [Google Scholar]
- McKenna MJ, Gissel H, Clausen T. Effects of electrical and hormonal stimulation on Na+, K+-ATPase (3H-ouabain binding) in rat skeletal muscle. Acta Physiologica Scandinavica. 2002;174:A183. [Google Scholar]
- Nielsen OB, Clausen T. The significance of active Na+, K+ transport in the maintenance of contractility in rat skeletal muscle. Acta Physiologica Scandinavica. 1996;157:199–209. doi: 10.1046/j.1365-201X.1996.d01-748.x. [DOI] [PubMed] [Google Scholar]
- Nielsen OB, Clausen T. Regulation of Na+–K+-pump activity in contracting rat muscle. Journal of Physiology. 1997;503:571–581. doi: 10.1111/j.1469-7793.1997.571bg.x. [DOI] [PMC free article] [PubMed] [Google Scholar]
- Nielsen OB, Clausen T. The Na+, K+-pump protects muscle excitability and contractility during exercise. Exercise and Sport Science Reviews. 2000;28:159–164. [PubMed] [Google Scholar]
- Overgaard K, Nielsen OB, Flatman JA, Clausen T. Relations between excitability and contractility in rat skeletal muscle: role of the Na+–K+ pump and Na+/K+ gradients. Journal of Physiology. 1999;518:215–225. doi: 10.1111/j.1469-7793.1999.0215r.x. [DOI] [PMC free article] [PubMed] [Google Scholar]
- Pfliegler G, Szabo I, Kovacs T. The influence of catecholamines on Na, K transport in slow- and fast-twitch muscles of the rat. Pflügers Archiv. 1983;398:236–240. doi: 10.1007/BF00657158. [DOI] [PubMed] [Google Scholar]
- Sejersted OM, SjØGAARD G. Dynamics and consequences of potassium shifts in skeletal muscle and heart during exercise. Physiological Reviews. 2000;80:1411–1465. doi: 10.1152/physrev.2000.80.4.1411. [DOI] [PubMed] [Google Scholar]
- Semb SO, Sejersted OM. Fuzzy space and control of Na+, K+ pump rate in heart and skeletal muscle. Acta Physiologica Scandinavica. 1996;156:213–225. doi: 10.1046/j.1365-201X.1996.211000.x. [DOI] [PubMed] [Google Scholar]
- TeissiÉ J, Eynard N, Gabriel B, Rols MP. Electropermeabilization of cell membranes. Advanced Drug Delivery Reviews. 1999;35:3–19. doi: 10.1016/s0169-409x(98)00060-x. [DOI] [PubMed] [Google Scholar]
- Tsakiridis T, Wong P, Liu Z, Rogers C, Vranic M, Klip A. Exercise increases the plasma membrane content of the Na+, K+ pump and its mRNA in rat skeletal muscles. Journal of Applied Physiology. 1996;80:699–705. doi: 10.1152/jappl.1996.80.2.699. [DOI] [PubMed] [Google Scholar]
- Zacharova D, Zachar J, Hencek M, Nasledov GA. Selectivity of sodium channels in denervated tonic muscle fibre membrane of the frog. General Physiology and Biophysics. 1983;2:425–435. [PubMed] [Google Scholar]