

Abstract
Loading slices of rat barrel cortex with 50 μm BAPTA-AM while recording from pyramidal cells in layer II induces a marked reduction in both the frequency and amplitudes of mEPSCs. These changes are due to a presynaptic action. Blocking the refilling of Ca2+ stores with 20 μm cyclopiazonic acid (CPA), a SERCA pump inhibitor, in conjunction with neuronal depolarisation to activate Ca2+ stores, results in a similar reduction of mEPSCs to that observed with BAPTA-AM, indicating that the source for intracellular Ca2+ is the endoplasmic reticulum. Block or activation of ryanodine receptors by 20 μm ryanodine or 10 mm caffeine, respectively, shows that a significant proportion of mEPSCs are caused by Ca2+ release from ryanodine stores. Blocking IP3 receptors with 14 μm 2-aminoethoxydiphenylborane (2APB) also reduces the frequency and amplitude of mEPSCs, indicating the involvement of IP3 stores in the generation of mEPSCs. Activation of group I metabotropic receptors with 20 μm (RS)-3,5-dihydroxyphenylglycine (DHPG) results in a significant increase in the frequency of mEPSCs, further supporting the role of IP3 receptors and indicating a role of group I metabotropic receptors in causing transmitter release. Statistical evidence is presented for Ca2+-induced Ca2+ release (CICR) from ryanodine stores after the spontaneous opening of IP3 stores.
Under physiological conditions, transmitter release is exquisitely dependent on Ca2+. We wondered if the high rate of miniature excitatory postsynaptic currents (mEPSCs) in pyramidal cells in layer II of rat barrel cortex was dependent on intracellular Ca2+ and, if so, what the source of this Ca2+ was. In Simkus & Stricker (2002) block of Ca2+ channels did not result in a reduction of the frequency of mEPSCs. We therefore considered intracellular sources of Ca2+, such as intracellular Ca2+ stores formed by the endoplasmic reticulum (ER), mitochondria and Golgi organelles.
The role of presynaptic intracellular Ca2+ stores in transmitter release has recently been studied in basket cell terminals onto Purkinje cells in the cerebellum of rat (Llano et al. 2000), in organotypic slice cultures of CA3 hippocampal cells (Savic & Sciancalepore, 1998; Emptage et al. 2001) and at the neuromuscular junctions of the frog (Narita et al. 2000) and lizard (Melamed-Book et al. 1993). In these preparations stores are involved in generating and modulating transmitter release.
We found that intracellular Ca2+ stores in presynaptic terminals onto layer II pyramidal cells in rat barrel cortex are responsible for a significant proportion of mEPSCs. The pharmacological investigation suggests that both ryanodine- and IP3-mediated stores participate in generating mEPSCs and that, under our experimental conditions, about a third of the mEPSCs are related to activity dependent on Ca2+ from stores. Antagonist and agonist action at both receptor types were investigated. We found that, at the concentrations used, the frequency of mEPSCs could be modulated by a factor of up to 6. This modulation is effected through two different pathways, the first is Ca2+-induced Ca2+ release from the ryanodine stores and the second one is IP3-mediated Ca2+ release from ER stores. We also provide statistical evidence for interaction between the stores through Ca2+-induced Ca2+ release.
Methods
Twelve- to seventeen-day-old Wistar rats were decapitated with a guillotine and the brain rapidly removed. The methods were approved by the veterinary office of the Canton of Zürich and conform to Swiss Federal legislation. The preparation of slices, electrophysiological techniques and the procedures to detect mEPSCs are described in Simkus & Stricker (2002). In the present paper, the majority of recordings were restricted to pyramidal cells in layer II to obtain a homogeneous population. The identification of the cells was as described in Simkus & Stricker (2002). All experiments were performed in artificial cerebrospinal fuid (ACSF) of the composition described in Simkus & Stricker (2002) to which tetrodotoxin (TTX, 1 μm) was added to block activity-dependent spontaneous EPSCs together with bicuculline (10 μm) to block inhibitory currents. After a control period, sufficient time was allowed for solution changes to establish their effect. Typically, the conditioned recording was started more than 20 min after superfusion began. This time contrasts with that of a full solution exchange in the superfusing bath, which typically took 2-3 min.
Loading of BAPTA-AM was done according to the method described in Ouanounou et al. (1999). The source of ryanodine was Molecular Probes (Eugene, OR, USA); 1,2-bis-(2-aminophenoxy)-ethane-N,N,N’,N’-tetraacetic-(acetoxymethyl) ester (BAPTA-AM) and 2-hydroxypropyl-β-cyclodextran were from Fluka (Buchs, Switzerland); TTX was from Latoxan (Rosans, France); and 2-aminoethoxydiphenylborane (2APB), (RS)-3,5-dihydroxyphenylglycine (DHPG) and 2,3-dioxo-6-nitro-1,2,3,4-tetrahydrobenzo[f]-quinoxaline-7-sulphonamide (NBQX, disodium salt) were from Tocris Cookson (Bristol, UK). All other chemicals were purchased from Sigma (Buchs, Switzerland).
Iontophoresis was done with fine glass microelectrodes (100-120 MΩ when filled with 5 mm AMPA), which were pulled on a P97 puller (Sutter, Novato, CA, USA) from 1.2 mm borosilicate glass (GC120F, Clark Electromedical, Reading, UK). An Axoclamp 2B with a × 1 headstage (Axon instruments, Union City, CA, USA) served to supply the current pulses. To minimise leakage from the electrode tip, a retention current of 5 nA was applied. An isolated stimulator (type DS2, Digitimer Ltd, Welwyn Garden City, UK) provided the command voltages of up to 60 V to the Axoclamp, which could then deliver 600 nA of current. Paired pulses were applied with an inter-pulse interval of 50 ms to qualitatively gauge glutamate clearance within the tissue as well as the effect of and recovery from desensitisation.
To avoid the problem of changes in series resistance (Rs), which can affect the amplitudes and the threshold of detection of the mEPSCs, Rs was assessed before and after recording of an experimental sequence. If the change was greater than ± 15 % of the starting value, the recording was excluded from the analysis. Peak amplitudes of inward currents are given as magnitudes (without sign).
Since Rs in the range of 8-15 MΩ together with the uncompensated electrode and whole-cell capacitance (average mEPSC ≈7 pA) did not significantly change AMPA current amplitudes from experiment to experiment (see Simkus & Stricker, 2002), we pooled data from different experiments without normalisation. Differences between average values were assessed using Student's paired t test (Ppt). Statistical significance was judged at Ppt < 0.05. Error bars associated with parameter values indicate ± s.d. Cumulative probability density functions (cPDFs) were compared using Kolmogorov-Smirnov (KS) statistics (PKS) as described in Numerical Recipes in C (Press et al. 1992). Since large samples were analysed, the significance level for this statistic was usually taken at PKS < 0.001.
During the course of the experiments, we noticed that there was a significant variability from slice to slice, from animal to animal and from litter to litter. We therefore resorted to obtaining, where possible, control experiments from the same slice or at least from a slice from the same animal. As a result, there is variability between control values for different sets of experiments.
Results
In a first set of experiments, we tested if, under conditions where the intracellular Ca2+ was buffered with high concentrations of BAPTA, the rate and/or size of mEPSCs decreased.
Intracellular Ca2+ buffering with BAPTA-AM
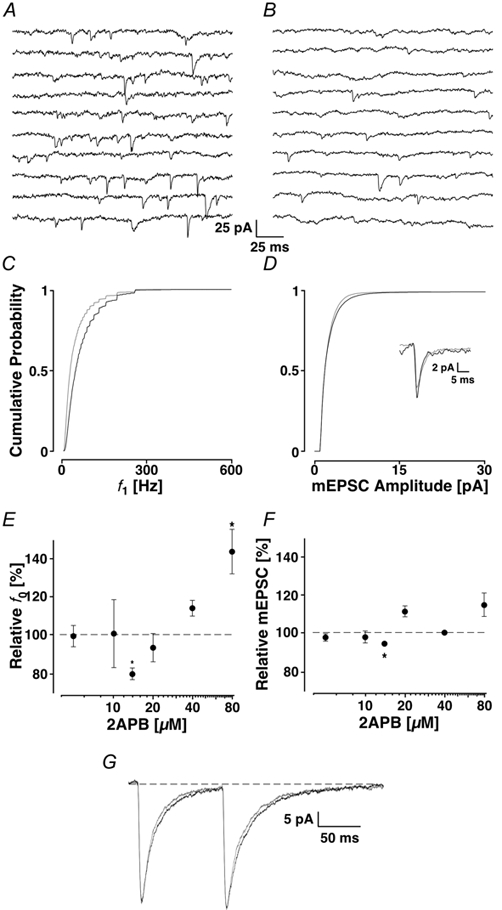
In Fig. 1A and B, a typical experiment is illustrated showing mEPSCs under control conditions (Fig. 1A) and after the loading of 50 μm BAPTA-AM (Fig. 1B). Shortly after loading, an initial increase in mEPSCs was observed (data not shown). The delay between the two recording epochs was 20 min. The average frequency of mEPSCs decreased from 22 ± 2 to 9 ± 1 Hz. The instantaneous frequency (f1) was reduced from 73 ± 87 to 40 ± 73 Hz. This is documented in a leftward shift of cPDF for BAPTA-AM illustrated in Fig. 1C. The average mEPSC amplitude changed from 6.3 ± 3.5 to 5.2 ± 2.4 pA; the cPDF for the peak amplitudes is given in Fig. 1D. In both panels, the two distributions are clearly different from each other as assessed by the KS test statistic (PKS < 0.001). The reduction in amplitudes can also be seen in the inset in Fig. 1D, which shows the time course of the average mEPSCs. The time course of the mEPSCs did not change significantly.
Figure 1. Loading the slice with 50 μm BAPTA-AM.
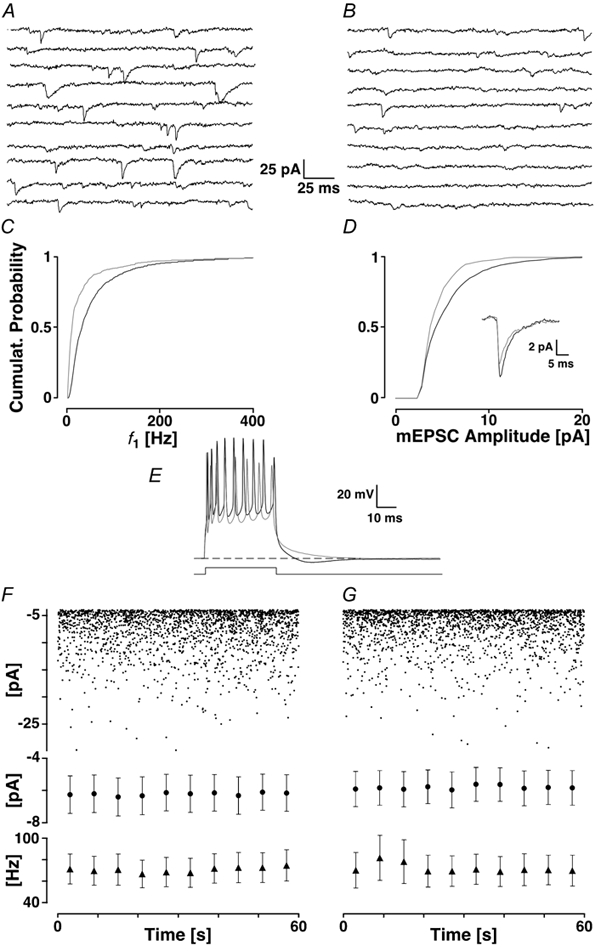
The first 2 s of recording taken before (A) and after the addition of BAPTA-AM and waiting for > 20 min (B). C, the cPDF of f1 before (black line) and after the addition of BAPTA-AM (grey line). D, the cPDF of the mEPSC amplitudes before (black line) and following the addition of BAPTA-AM (grey line). The average mEPSC time courses are given in the inset before (black line) and after (grey line) the addition of BAPTA-AM. E, bursts of action potentials elicited by an 80 ms current pulse of 0.3 nA before (black line) and after loading (grey line). The grey trace no longer shows the sAHP. The dashed line indicates resting membrane potential. F and G, assessing the stability of mEPSCs illustrated with a 1 min recording in control (left) and after 20 min (right). The peak amplitudes are plotted in time. There is no difference in either frequency or amplitude. Below are pooled data of 5 experiments with average values taken every 6 s for the peak amplitudes (•) and f1 (▴). There was no difference between control and a recording 20 min later.
In a set of six experiments, similar changes in frequency and amplitude to those illustrated in Fig. 1 were consistently observed. Pooling of the data indicates that the average mEPSC frequency dropped to 68 ± 24 % and the average amplitude to 85 ± 10 % of control; both changes were significant at Ppt < 0.05. At the same time, the overall kinetics of the mEPSCs did not change.
A control experiment for Ca2+ release from stores is illustrated in Fig. 1E. The loading of the tissue with BAPTA-AM was assessed in current-clamp (Fig. 1E). A brief current step of 0.3 nA and 80 ms resulted in a burst of action potentials, which in control solution was followed by a pronounced after-hyperpolarisation (AHP) via the activation of a Ca2+-mediated potassium current, which without BAPTA was maintained for the time of recording (no washout). Upon wash-in of the drug and after a delay of 12 min, the AHP was abolished. Since Ca2+ channels and stores are in close proximity to the potassium channels, which they activate (Sah, 1996), this control indicates that Ca2+ from this store can be chelated efficiently with the concentration of extracellular BAPTA used. Block of Ca2+ release from presynaptic stores is documented below.
We checked if the rate and amplitudes of mEPSCs were stable even after 20 min of recording. Such an experiment is illustrated in Fig. 1F and G, in which 1 min of recording is illustrated during control and after waiting for 20 min. No differences are detectable. Below are the average peak amplitudes and f1 from five similar experiments plotted every 6 s. Such data indicated that recording stability could be maintained over the time required to wash pharmacological agents in. We also tested if the addition of DMSO (< 0.1 %), 2-hydroxypropyl-β-cyclodextran (0.7 mm) and probenecid (0.5 mm), which were used for loading BAPTA-AM, changed mEPSC frequency and size. We could not find a statistically significant change in either the frequency or size of mEPSCs (n = 5; Ppt << 0.05, data not shown).
A further set of control experiments was required to rule out any postsynaptic effect of the BAPTA loading on mEPSCs. We checked if 10 mm BAPTA in the intracellular solution had an effect on mEPSCs. Comparing the rate of mEPSCs just after break-in and after 15 min when a high intracellular concentration of BAPTA would have been reached in most compartments of the cell, we could not observe any change in either the frequency, the amplitude or the kinetics of the mEPSCs (data not shown). These experiments indicate that the effect of BAPTA-AM was presynaptic and that Ca2+ induced transmitter release in the terminal.
The source of Ca2+
The next set of experiments was designed to determine the source of Ca2+. There are two candidates, firstly voltage-dependent Ca2+ channels (VDCCs) in the membrane of the presynaptic structures, and secondly intracellular Ca2+ stores. The lowering of extracellular Ca2+, the block of VDCCs and presynaptic NMDA receptors are documented in Simkus & Stricker (2002) and allowed us to conclude that extracellular Ca2+ entry was an unlikely candidate.
Thus, presynaptic Ca2+ stores appear to be the source of intracellular Ca2+. We reasoned that if the stores could be depleted of Ca2+ by blocking the Ca2+-ATPase (SERCA pump), which refills the stores, a reduction in mEPSC frequency and amplitude might be seen. We used the SERCA pump inhibitor cyclopiazonic acid (CPA, 20 μm). During the control period (Fig. 2A), the average frequency was 39 ± 2 Hz, f1 was 90 ± 126 Hz and the average amplitude was 7.3 ± 4.2 pA. After the addition of CPA (delay > 20 min), the average frequency decreased to 29 ± 1 Hz, and the amplitude did not change significantly (7.1 ± 4.2 pA). In the Fig. 2D and E, the cPDFs are shown for the frequency and the amplitudes, respectively. In this example, the change in frequency was significant (PKS < 0.001), but the one for the amplitude was not (PKS + 0.09). Consistently, in five experiments, CPA produced a significant reduction in the average mEPSC frequency to 82.8 ± 6.7 % of control (Ppt < 0.01). A small reduction to 93 ± 14 % of control was observed in the average mEPSC amplitude, but this was not significant (Ppt + 0.31).
Figure 2. Preventing the loading of ER stores with the SERCA pump inhibitor CPA (20 μm).
A, control sequence; B, after the addition of CPA; and C, in the presence of CPA after a K+ depolarisation. Below are the cPDFs of the three conditions illustrated for f1 (D) and amplitudes (E). The black line corresponds to the control condition, the grey line to CPA alone and the dashed line to CPA following a K+ depolarisation. The inset in E shows the time courses of the average mEPSCs under the three conditions.
Under normal conditions, Ca2+ stores may release only a small amount of Ca2+ when activated, such that the effect of CPA by itself may only be evident after an extended period of time. To enhance the effect of store depletion, we added a drop of 3 m KCl to depolarise the cells to approximately −15 mV. This depolarisation activates presynaptic VDCCs, which causes Ca2+ influx and activates release from stores. The preceding block of SERCA pumps should prevent the ER from refilling and significantly reduce stored Ca2+. After depolarisation and a recovery time of 15 min, the average frequency decreased to 22 ± 1 Hz (Fig. 2C), the cPDF of f1 was shifted even further to the left (mean 62 ± 90 Hz, Fig. 2D, dashed line) and the amplitude was reduced to 6.0 ± 2.9 pA.
Averaged over five experiments, the addition of KCl significantly reduced the average mEPSC frequency to 67 ± 19 % of control (Ppt + 0.02). Whereas the changes in mEPSC amplitudes from CPA to CPA plus depolarisation were close to significant, the changes from the first to the last condition were significant in all experiments (PKS < 0.01). These values are not different from when intracellular Ca2+ is chelated with BAPTA-AM, suggesting that the Ca2+ contribution from the stores is within the buffering range of BAPTA. It also shows that blocking the SERCA pump does not result in the immediate emptying of the stores. This result emphasises that Ca2+ from internal stores plays an important role in generating a subset of mEPSCs. Control experiments for the potassium depolarisation are documented below.
Since Ca2+ from intracellular stores can produce mEPSCs, we asked which type of stores might be involved. There are two types of intracellular Ca2+ stores: ryanodine and IP3 receptor-gated stores (Pozzan et al. 1994). Since the subsequent study relies on pharmacological tools to identify the nature and action of these receptors, we required an internal check for consistency. We therefore used both blocking and activating agents to establish the functional role of these receptors.
Block of ryanodine receptors
Ryanodine is a specific blocker of the ryanodine receptor, which can be located on intracellular stores (Sutko et al. 1997). Its action results from an open-channel block of the receptor-gated channel. We first tested if 20 μm ryanodine added to the superfusate resulted in sufficient block. In a set of 11 experiments (data not shown), in which the elapsed time between the two recording periods was > 20 min, we could not find a difference between the characteristics of mEPSCs in control ACSF and one with ryanodine added. This finding indicated that within this time, an insufficient number of ryanodine receptors were blocked. The physiological activators of the ryanodine receptor are Ca2+ and voltage, the latter at least in cardiac muscle (McPherson & Campbell, 1993). Therefore, a depolarisation that reliably changes the membrane voltage to above −20 mV would open most of the ryanodine receptors and then allow open channel block of the receptors.
We induced the depolarisation by a small drop of 3 m KCl to the superfusate. In our bath with a solution flow of about 4 ml min−1, the membrane depolarised immediately, peaked at −15 mV 5-10 s later and repolarised within about 2-3 min. We were concerned that the depolarisation would cause vesicle depletion in the terminals. We therefore tested if the depolarisation by itself could cause a lasting change in mEPSC frequency and amplitude. We measured mEPSCs before and after the onset of this K+ depolarisation. We found that it did not cause any significant change in either the frequency or the amplitude of the mEPSCs when assessed 20 min later (data not shown), indicating that both stores and vesicles were replenished to control levels within this time frame.
We tested if, after a depolarisation in the presence of ryanodine, we could observe a change in mEPSC frequency or amplitude. Such an experiment is shown in Fig. 3. The control period is illustrated in Fig. 3A, and the membrane currents after depolarisation in ryanodine in Fig. 3B. The average frequency dropped from 30 ± 2 to 17 ± 1 Hz. The reduction in mEPSC frequency is also reflected in the leftward shift of the cPDF of f1, the mean of which was reduced from 69 ± 77 to 48 ± 67 Hz (PKS < 0.001; Fig. 3C). Similarly, the cPDF of the amplitude was also significantly shifted, such that the average amplitude was reduced from 6.6 ± 3.9 to 5.7 ± 2.9 pA (PKS < 0.001; Fig. 3D). There was no striking change in the mEPSC time course (inset).
Figure 3. Block of ryanodine receptors using 20 μm ryanodine.
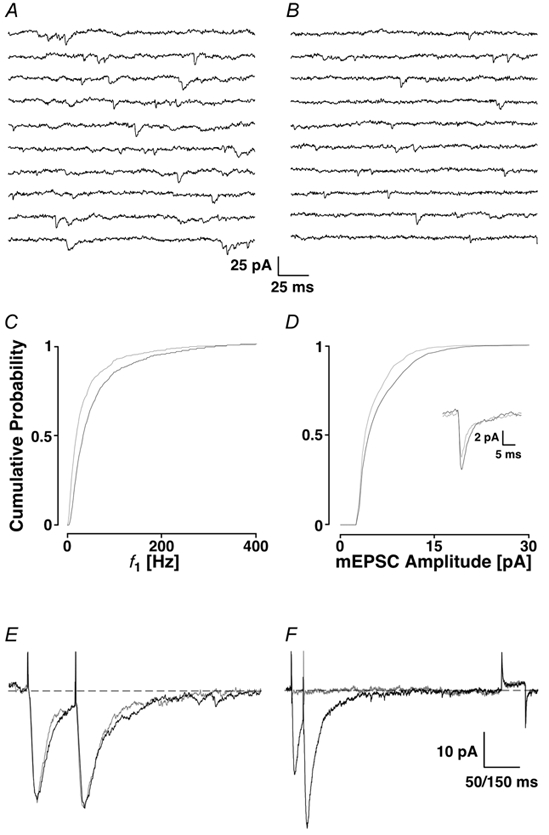
A recording sequence of 2 s before (A) and after (B) the block of ryanodine receptors with the corresponding cPDFs shown in C and D for f1 and amplitudes (black lines control; grey lines, ryanodine receptors blocked). E, EPSC-like currents evoked by AMPA iontophoresis on the apical dendrite recorded from a pyramidal cell. Inter-pulse interval is 50 ms. The black line was obtained during control and the grey line when ryanodine with a K+ depolarisation was washed in. F, in an experiment with different time courses, 10 μm NBQX abolished the EPSC-like currents (grey line), illustrating that the iontophoresis activated AMPA receptors.
Similar results were found in a set of 15 experiments. In some other experiments, we used ryanodine at concentrations of 10 μm (n = 6) and 50 μm (n = 7). All three concentrations gave the same results. This allowed us to pool the data. The overall change in mEPSC frequency was 64 ± 15 % of control (Ppt < 0.001). The average mEPSC amplitude was not significantly reduced, but significant leftward shifts were seen in 9 of 15 recordings (PKS < 0.001). These results suggest that Ca2+ from ryanodine-sensitive stores is capable of causing some of the mEPSCs.
To further rule out the possibility that postsynaptic AMPA receptors are affected by ryanodine, recordings of the postsynaptic response to paired pulses of AMPA iontophoresis onto the apical dendrite were made. These recordings were done before and after the application of ryanodine combined with KCl depolarisation. Recordings of EPSC-like currents were generally 10-40 pA in amplitude, had a rise time of 4-10 ms and a half-width of 10-45 ms, significantly slower than the fastest mEPSCs reported in Simkus & Stricker (2002). Iontophoretic responses were completely blocked 5 min after the addition of 10 μm NBQX (n = 3; Fig. 3F). This block of the EPSC-like currents confirmed that AMPA receptors generated the iontophoretic responses. The average response (30 traces) to two iontophoretic pulses was unaffected by the addition of ryanodine with a KCl depolarisation (Fig. 3E). For six experiments, the average amplitude was 30 ± 12 pA before and 29 ± 12 pA with ryanodine (Ppt + 0.14). In addition, the half-width of the current was 18.4 ± 4 ms before and 17.4 ± 4 ms after this manipulation, which was also not significant (Ppt + 0.08). The slight change in the decay phase of the EPSC-like currents in Fig. 3E may reflect a small ryanodine-sensitive effect on the AMPA receptors. We think, however, it is more likely that a small movement in the position of the iontophoretic electrode might have caused the small kinetic change. These results suggest that ryanodine does not have a significant effect on postsynaptic AMPA receptors.
An alternative explanation for the effects of ryanodine is that the depolarisation caused a change in the rate of delivery and/or retrieval/endocytosis of AMPA receptors into and out of the postsynaptic membrane. The K+-induced depolarisation leads to a large influx of Ca2+ into the cell, which could activate cascades leading to AMPA receptor insertion or removal. To rule out such a scenario, we checked if postsynaptic depolarisation in the presence of ryanodine could change mEPSC characteristics. We mimicked the depolarisation in current-clamp mode by applying a time-varying current through the pipette, which closely followed the time course of the membrane potential during the K+ depolarisation. No significant change in either the amplitude or the frequency of mEPSCs was observed (data not shown).
The experiments so far suggest that presynaptic ryanodine receptors are involved in generating mEPSCs.
Activation of ryanodine receptors
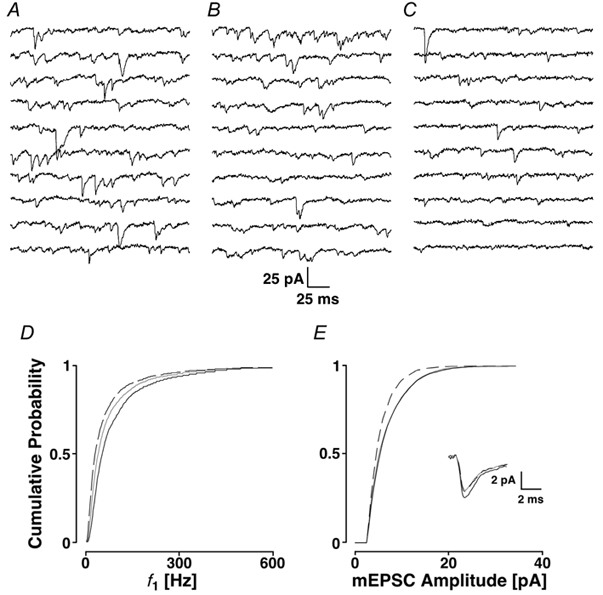
Since ryanodine receptors appear to be tonically active, we tested whether their activity could be further stimulated by 10 mm caffeine, an agonist which sensitises the ryanodine receptor. In Fig. 4A, a sequence during a control period is shown and in Fig. 4B a sequence 20 min after the addition of caffeine. A strong increase in frequency and amplitude of the mEPSCs is documented in Fig. 4C and D. The control and conditioned cPDFs are significantly different from each other in both cases (PKS < 0.001). The frequency increased by 235 ± 40 % and the amplitude by 123 ± 30 %. The time course of the mEPSC did not change as the scaled version of the control current corresponded well with the current after the addition of caffeine (inset in Fig. 4D).
Figure 4. Activation of ryanodine receptors using 10 mm caffeine.
A, a control period is shown and B, after the addition of caffeine. The cPDFs are illustrated for f1 (C) and amplitudes (D). Control conditions are in black and responses after the activation of ryanodine receptors are in grey. The inset refers to the time course of the mEPSCs before and after the addition of caffeine.
All caffeine experiments (n = 6) showed qualitatively the same result. The average frequency increased from 32 ± 16 to 60 ± 27 Hz. A significant increase in the amplitudes of the mEPSCs was observed in all experiments. These results indicate that activation of ryanodine stores can modulate mEPSC frequency by a factor of at least 200 %.
Blockade of IP3 receptors
In addition to the ryanodine receptors, IP3 receptors also control Ca2+ release from endoplasmic stores. We wondered if these receptors contribute to the generation of mEPSCs. We used the membrane-permeant compound 2APB (Maruyama et al. 1997) and established the concentration- response curve in our preparation. This is illustrated in Fig. 5E and F where the frequency and amplitudes are plotted semi-logarithmically as a function of 2APB concentration (n = 28 at 6 different concentrations). We found that the biggest reduction of both mEPSC frequency and amplitude was at 14 μm 2APB. At concentrations > 80 μm, the relative mEPSC frequency was significantly increased, but the amplitude was not significantly different. In all our subsequent experiments with 2APB, the concentration was 14 μm.
Figure 5. Block of the IP3 receptors using 14 μm 2APB.
Two seconds of recording are illustrated in control (A) and after the addition of 2APB (B) with the appropriate cPDFs illustrated for f1 (C) and for the amplitudes (D) with the time course information shown in the inset. The results in 2APB are shown in grey. Concentration-response curves for average frequency (f0) are shown in E and amplitude in F. An asterisk marks significant deviations from control. Note the minimum at 14 μm 2APB. G, EPSC-like currents evoked by AMPA iontophoresis on the apical dendrite. The black line was obtained during control and the grey line when 2APB was present.
A typical experiment with 2APB is illustrated in Fig. 5 showing control conditions (Fig. 5A) and the effect of adding 2APB (Fig. 5B). The frequency was clearly lower in 2APB than in control, namely 40 ± 2 versus 23 ± 1 Hz. The mean of the cPDF f1 decreased from 85 ± 83 to 58 ± 70 Hz. The cPDFs are shown in Fig. 5C and D for the frequency and amplitudes, respectively. In this example, the amplitudes were slightly but not significantly reduced (6.9 ± 5.0 to 6.4 ± 3.8 pA, PKS + 0.14). In 10 experiments, the average mEPSC frequency was reduced to 78 ± 10 % (Ppt < 0.001) and the average amplitude decreased to 94 ± 3 % of control (Ppt < 0.001). The average current time course illustrated in the inset shows that there was essentially no change after the addition of 2APB, suggesting that the compound does not interfere with AMPA receptors.
To rule out the possibility that 2APB affects postsynaptic AMPA receptors and as a result the mEPSC characteristics, we examined the effect of 2APB on iontophoretic AMPA currents. Figure 5G shows that 2APB appears to speed up the decay phase of the AMPA currents without affecting the peak amplitudes. In six experiments, the average amplitude was 36 ± 15 before and 38 ± 17 pA after the application. The half-width of the currents was 77 ± 70 and 70 ± 66 ms, respectively. On average, these differences were not significant (Ppt > 0.05 for both parameters) suggesting that this concentration of 2APB had no appreciable effect on AMPA currents.
Activation of IP3 receptors
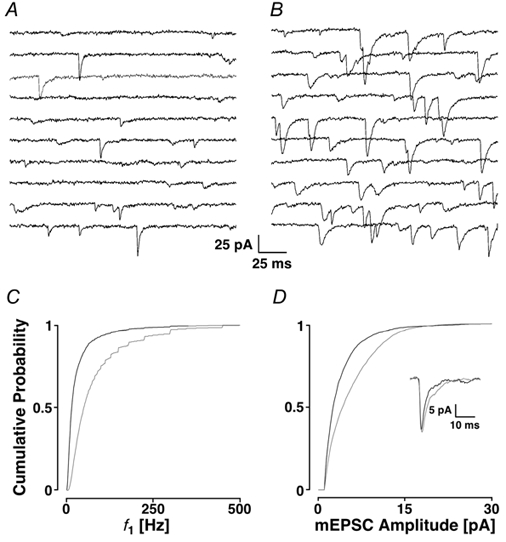
If IP3 receptor-gated stores are tonically active, we might be able to increase their activity by producing an increase in intracellular IP3 concentration. There are multiple signalling cascades producing IP3. Because in our system mEPSCs are glutamatergic, we asked if glutamate itself could produce IP3 by activating presynaptic group I metabotropic glutamate receptors. We chose the selective group I metabotropic glutamate receptor agonist DHPG (Schoepp et al. 1994). To ensure that the effects of DHPG could be attributed solely to an action at presynaptic terminals, the experiments were conducted using a patch pipette solution containing 10 mm BAPTA, a concentration, which should buffer any increase in Ca2+ resulting from mGluR activation in the postsynaptic neurone. In Fig. 6A, a control period is illustrated followed by the addition of 20 μm DHPG in Fig. 6B. The frequency increased from 38 ± 2 to 59 ± 4 Hz, and the mEPSC amplitude from 9.7 ± 7.4 to 10.3 ± 8.2 pA. The cPDFs for both f1 and amplitudes are illustrated in Fig. 6C and D, respectively; both changes were significant (PKS < 0.001). The time course of the average mEPSC is illustrated in the inset of Fig. 6D and shows that DHPG did not have a significant action on AMPA receptor current kinetics.
Figure 6. Activation of presynaptic metabotropic receptors using 20 μm DHPG.
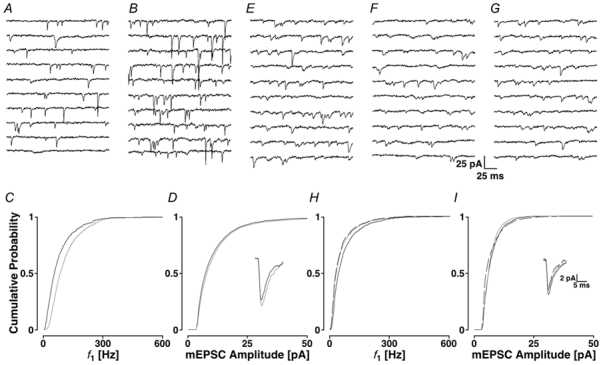
The control is illustrated in A and the response to DHPG in B. The cPDFs are shown for f1 and amplitudes in C and D, respectively, and the time courses are illustrated in the inset. Grey lines represent the data after the addition of DHPG. Activation of mGluRs by DHPG fails to increase mEPSC frequency after IP3 receptor blockade. E, control period, F, after the addition of 2APB and G, after the further addition of DHPG. In H and I, the cPDFs are shown for f1 and amplitudes, respectively. Black lines, control; grey lines, 2APB; dashed lines, subsequent addition of DHPG in the presence of 2APB. The inset shows the time courses of the mEPSCs.
In five experiments, the average mEPSC frequency significantly increased to 146 ± 13 % of control (Ppt + 0.02). In two of five experiments, DHPG produced a significant increase in the mEPSC amplitude (PKS < 0.001 in both cases), while a small decrease was observed in the remaining three experiments. This variability was reflected in the average mEPSC amplitude, which, despite a small decrease to 86 ± 13 %, was not significantly altered (Ppt + 0.07). The increase in mEPSC frequency produced by DHPG suggests that IP3 can cause Ca2+ release from stores. It also shows that there are presynaptic group I metabotropic glutamate receptors on the terminals which, when stimulated, increase the rate of mEPSCs.
To test if activation of group I metabotropic glutamate receptors resulted in the production of IP3 and the subsequent receptor activation, 20 μm DHPG was applied to slices, which were first exposed to 2APB. Figure 6E-I shows that following the decrease in mEPSC frequency caused by 2APB (from 37 ± 2 to 26 ± 1 Hz), DHPG failed to produce an increase in either frequency (26 ± 1 Hz; PKS + 0.46) or amplitude, which is in contrast to when DHPG was applied alone (see Fig. 6B).
In five experiments, 2APB reduced the average mEPSC frequency to 62 ± 14 % of the control (Ppt + 0.04). The subsequent addition of DHPG did not produce any increase (61 ± 20 %; Ppt + 0.51). In this series of experiments, 2APB and DHPG failed to alter the average mEPSC amplitude (98 ± 11 % versus 93 ± 12 % of the initial control recording).
Ryanodine to IP3 store interactions
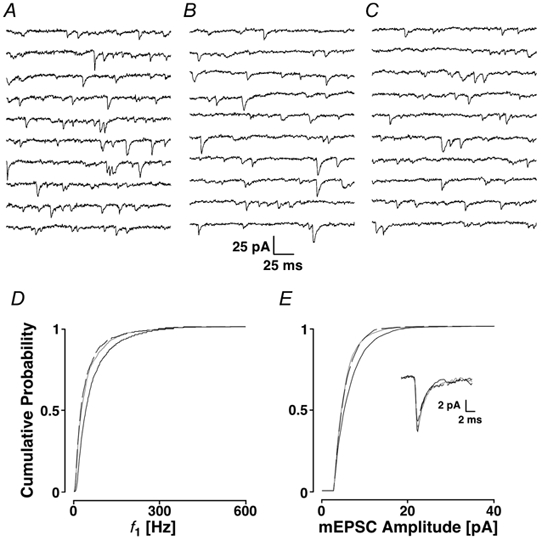
IP3 receptors have been shown to be sensitive to changes in cytoplasmic Ca2+ concentration (Iino & Endo, 1992). If Ca2+ from ryanodine stores sensitised release of Ca2+ from IP3 stores, then the initial block by ryanodine should prevent any reduction in mEPSC frequency when 2APB is applied subsequently. Figure 7A-C shows that ryanodine with a K+ depolarisation reduced the average frequency from 42 ± 2 to 26 ± 1 Hz, following which 2APB still reduced the frequency to 24 ± 1 Hz. This change can also be seen in the cPDFs of f1 (Fig. 7D), the mean of which was significantly decreased from 89 ± 100 Hz in the control to 66 ± 84 Hz in ryanodine and to 61 ± 78 Hz in 2APB (dashed line, PKS < 0.001 for both changes). In addition, Fig. 7E demonstrates that in this cell, ryanodine significantly reduced the average mEPSC amplitude, which initially had a mean of 7.8 ± 4.6 pA and was significantly reduced to 6.6 ± 3.4 pA with ryanodine (PKS < 0.001), but remained unchanged after 2APB (6.6 ± 3.1 pA; PKS + 0.41). There was no noticeable change in the average mEPSC time course (inset).
Figure 7. Interaction of ryanodine stores with IP3 stores.
A, control period; B, after the addition of ryanodine (with K+ depolarisation); and C, after the subsequent addition of 2APB. In D and E, the cPDFs are shown for f1 and amplitudes, respectively. Black lines, control; grey lines, ryanodine; and dashed lines, subsequent addition of 2APB. Inset refers to the time courses.
In seven experiments, ryanodine reduced the average mEPSC frequency to 72 ± 16 % of control, with 2APB further reducing the frequency of events to 88 ± 7 % of that in ryanodine. Across these experiments, ryanodine significantly reduced the average mEPSC amplitude to 91 ± 5 % of control (Ppt < 0.001), which did not change after the addition of 2APB. These results suggest that there is little activation of IP3 stores by ryanodine stores and that the IP3 stores operate independently.
IP3 to ryanodine store interactions
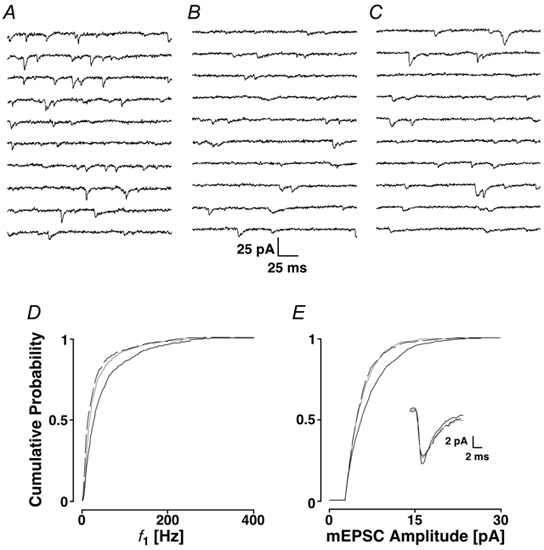
Ca2+ is the physiological agonist for the ryanodine receptor. The question arises of whether Ca2+, when liberated by spontaneous activation of IP3 receptors, is capable of activating ryanodine receptors. If under normal conditions, ryanodine receptors were activated by Ca2+ release from IP3 receptors, there should be no further decrease in mEPSC frequency when ryanodine (with depolarisation) is applied. In Fig. 8A-C, the addition of 2APB produced a reduction in the average frequency from 19 ± 1 to 12 ± 1 Hz, which remained unchanged by the subsequent addition of ryanodine (12 ± 1 Hz). This sequence could also be documented in the cPDFs of f1 (Fig. 8D), where there was a significant difference between the control distribution and after the addition of 2APB (mean 57 ± 100 and 35 ± 48 Hz; PKS < 0.001), but not after the additional treatment with ryanodine (dashed line; PKS + 0.32; mean 34 ± 47 Hz). This effect on mEPSC frequency was mirrored by a reduction of mEPSC amplitudes (Fig. 8E), the mean of which shifted from 8.1 ± 4.6 to 6.7 ± 3.3 pA (PKS < 0.001), following which ryanodine did not produce any further decrease (mean 6.7 ± 3.4 pA; PKS + 0.18). The average mEPSC time courses showed no apparent changes (inset). Averaged over five experiments, the initial addition of 2APB reduced the average mEPSC frequency to 76 ± 12 % of control (Ppt < 0.001), with ryanodine failing to produce any additional change (93 ± 11 % of the 2APB recording; Ppt + 0.68). Both of these manipulations failed to produce a significant change in the average mEPSC amplitude.
Figure 8. Interaction of IP3 stores with ryanodine stores.
A, control period; B, after the addition of 2APB; and C, after the subsequent addition of ryanodine. In D and E, the cPDFs are shown for f1 and amplitudes, respectively. Black lines, control; grey lines, 2APB; and dashed lines, subsequent addition of ryanodine. The inset refers to the time courses.
The frequency data from the two types of experiment regarding store interaction are summarised in Table 1. Ryanodine produced a significant reduction in the mEPSC frequency in every series of experiments, except when applied after 2APB. These results provide statistical evidence that if IP3 stores are first blocked by 2APB, the subsequent block of ryanodine receptors is largely ineffective. Therefore, it tentatively appears that under normal conditions, when Ca2+ from IP3 stores is released, ryanodine receptors are activated through a process of Ca2+-induced Ca2+ release.
Table 1.
Interactions between stores as assayed by the changes in mEPSC frequency upon sequential blocking of receptors on Ca2+ stores
| Control | →Ryanodine | →2APB |
| 29.9 ± 8.1 Hz | 21.5 ± 7.1 Hz | 19.0 ± 7.3 Hz |
| 72 ± 16%* | 88 ± 7%* | |
| Control | →2APB | →Ryanodine |
| 31.9 ± 8.0 Hz | 24.1 ± 7.6 Hz | 22.5 ± 7.2 Hz |
| 76 ± 12%* | 93 ± 11% |
Significant changes (Ppt < 0.05).
Discussion
We have provided comprehensive evidence that intracellular Ca2+ stores participate in the generation of mEPSCs in layer II neurones of rat barrel cortex. We were able to investigate the role of Ca2+ stores because the frequency of mEPSCs in layer II cells is sufficiently high to assess changes caused by pharmacological interactions. We found that both ryanodine- and IP3-sensitive stores are present in presynaptic terminals and that there might be cross-talk from IP3- to ryanodine-sensitive stores via Ca2+-induced Ca2+ release (CICR). Based on our experiments, we propose that tonic activation of and interactions between Ca2+ signalling pathways in nerve terminals cause spontaneous Ca2+ release from stores, which can trigger the release machinery (Fig. 9).
Figure 9. Schematic drawing illustrating the generation of mEPSCs with the sites of actions of the drugs used indicated.
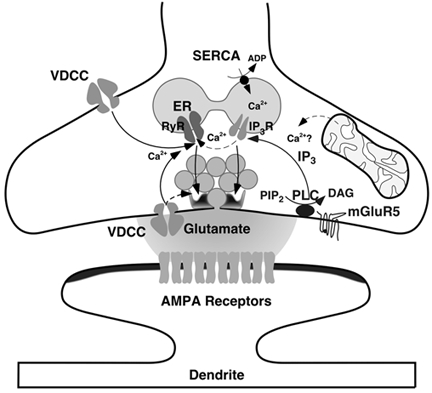
Abbreviations: RyR, ryanodine receptor; IP3R, IP3 receptor; PLC, phospholipase C; DAG, diacylglycerol; and PiP2, phosphatidylinositol bisphosphate. Pharmacologically, ryanodine receptors are activated by caffeine and blocked by ryanodine; IP3 receptors are blocked by 2APB; DHPG activates mGluR5 receptors; SERCA pumps are blocked by CPA.
We have made numerous and careful attempts to rule out a postsynaptic site of action, which could cause the changes in mEPSCs. Postsynaptic dialysis with 10 mm BAPTA did not induce a significant change in the mEPSC characteristics; nor did experiments designed to activate and maximise Ca2+ entry into the postsynaptic cell (depolarisation). In addition, AMPA iontophoresis failed to reveal significant changes in either the amplitudes or the time course of the EPSC-like currents when tested with the compounds used. All these experiments suggest that Ca2+ stores in presynaptic structures play a role in transmitter release in layer II of rat neocortex.
The classical interpretation of these findings is consistent with release from presynaptic nerve terminals (Del Castillo & Katz, 1954). However, we are unable to confirm that the recorded mEPSCs were caused by release from nerve terminals. There is evidence that glia, in particular astrocytes (Parpura et al. 1994; Parri et al. 2001), and dendrites of other pyramidal cells (Zilberter, 2000) are capable of releasing glutamate upon an intracellular rise in Ca2+. Glia and dendrites are endowed with the appropriate receptors on the ER (Seymour-Laurent & Barish, 1995; Nett et al. 2002).
Morphological evidence
Anatomical studies revealed that ER is present throughout neurones and that ER membranes intermingle with synaptic vesicles in nerve terminals of the peripheral (Heuser & Reese, 1973; Westrum & Gray, 1986; Lysakowski et al. 1999) and central nervous system (Bird, 1978; Westrum & Gray, 1986; Hartter et al. 1987). In some preparations, Ca2+ is contained in presynaptic vesicles (for example see Parducz & Dunant, 1993).
Little is known about the presence of ryanodine stores in nerve terminals. At the EM level, ryanodine staining was found in axons near vesicles in rat hippocampus and caudate-putamen (Sharp et al. 1993; Pickel et al. 1997). In a recent study based on immunohistochemical evidence obtained by confocal microscopy, Llano et al. (2000) reported that ryanodine receptors were present in inhibitory nerve terminals of basket cells onto Purkinje cells in cerebellum. IP3 receptor staining was also found in nerve terminals of deep cerebellar nuclei (Sharp et al. 1993). However, the picture for presynaptic IP3 stores is much less clear than that for ryanodine receptors.
Functional evidence
In our study, the presence of presynaptic Ca2+ stores is evidenced by the pharmacological profile obtained: Ca2+ could be chelated by BAPTA-AM, the block of VDCCs did not have an appreciable effect (Simkus & Stricker, 2002) and when stores were prevented from refilling by CPA, a SERCA pump inhibitor, the frequency and amplitude of the mEPSCs were reduced. In addition, both the activation and the block of ryanodine and IP3 receptors provided complementary results (internal consistency).
The buffering capacity of BAPTA suggests that if the concentration achieved within the terminals reached only half of that in the ACSF (50 μm), it would be sufficient to efficiently buffer the basal cytoplasmic Ca2+ concentration (in the range of 50-100 nm). However, the fact that mEPSC frequency was reduced by only one-third might have several causes. Firstly, it is possible that Ca2+ transients overwhelmed the chelator BAPTA. This could be the case within microdomains formed by VDCCs, in which concentrations of tens of micromolar can be reached (Naraghi & Neher, 1997). If release from stores is capable of producing transients of comparable amplitude, transmitter release could still be observed. Secondly, some of the stores may be located closer to the release machinery than the buffering range of BAPTA indicates. Thirdly, the high frequency of mEPSCs could be a basic characteristic of terminals onto layer II cells in neocortex depending on additional Ca2+-insensitive factors. We think that this is the most likely cause since buffering with BAPTA provided the same quantitative results as emptying the stores.
Ryanodine stores
Emptage et al. (2001) used Ca2+ imaging to show functional ryanodine-sensitive Ca2+ sparks in putative glutamatergic terminals in CA3 cells of organotypic hippocampal slice cultures (but see Carter et al. 2002). At the frog neuromuscular junction, presynaptic ryanodine-sensitive stores have recently been imaged and described to contribute to increased acetylcholine release after bursts of activity (Narita et al. 2000). These studies together with the one by Llano et al. (2000) support the notion that ryanodine receptors are localised in nerve terminals in a variety of preparations.
We have provided evidence for tonic release of Ca2+ from ryanodine-sensitive stores under control conditions. The block of the ryanodine receptor occurs at low concentrations (2 μm in skeletal muscle), but even 20 μm ryanodine did not show an appreciable block of mEPSC frequency when added alone to the ACSF. This is expected since about 104 synapses are formed onto a pyramidal cell (Larkman, 1991). If in each of these synapses there were many ryanodine receptor-gated channels and if we accept a conservative estimate of 10 channels and based our estimation on the data indicating that less than a third of the mEPSCs are caused by ryanodine receptor activation (about 13 Hz), it would take more than 2 h for all ryanodine receptors to be blocked. For an increase in the rate of action, we combined ryanodine with K+ depolarisation and found that the concentration used in our study is sufficient for a full block. Indeed, raising the concentration to 50 μm did not improve the block. The blocking concentration used is in line with other studies (Narita et al. 2000; Emptage et al. 2001) but contrasts with the concentration used by Llano et al. (2000, 100 μm) without depolarisation.
The addition of 10 mm caffeine to the superfusate caused a marked increase in mEPSC frequency and amplitude. Interestingly, the increase persisted for the whole duration of the experiment (> 20 min), which suggests that over this time the Ca2+ stores had not been depleted by the enhanced release of Ca2+. This is in contrast to studies with hippocampal neurones, which have used caffeine to deplete postsynaptic Ca2+ stores (Garaschuk et al. 1997). It also contrasts with the rapid effect of CPA in reducing mEPSC frequency. A possible explanation could be that caffeine increases SERCA pump activity either directly or indirectly, and thereby causes rapid refilling of the Ca2+ stores. SERCA pumps are sensitive to Ca2+ concentration and increase their transport rates in response to high internal Ca2+ (Xu et al. 1993).
Caffeine, however, not only activates ryanodine receptors, but also blocks presynaptic adenosine receptors (Fredholm et al. 1999) and thereby raises cAMP levels, which result in an increased probability of transmitter release at inhibitory nerve terminals in organotypic hippocampal cultures (Capogna et al. 1995) and cerebellar slices (Llano & Gerschenfeld, 1993) and also at excitatory nerve terminals in CA1 (Chavez-Noriega & Stevens, 1994). In these reports, the activation of the cAMP pathway was restricted to changes in frequency of miniature currents but not amplitudes. This characteristic was used to attribute a presynaptic action. Since we did see an appreciable increase in mEPSC amplitude without a significant change in AMPA current kinetics (see also Chavez-Noriega & Stevens, 1994), we think that at least some activation of ryanodine receptors is evident in our data. Further support comes from the wash-in of ryanodine, in which at low concentrations of the drug, at which the ryanodine receptors are sensitised, we also saw a similar picture. However, we cannot rule out that at least some of the action is not related to rises in intracellular Ca2+.
The block and activation of ryanodine receptors with ryanodine and caffeine, respectively, provided insight into the frequency range over which the release from Ca2+ stores could operate. This dynamic range corresponds to a factor of about three (0.64-1.9), whereas that for the mEPSC amplitude is very much smaller (< 0.4).
IP3 stores
IP3 receptors have been found to be associated with the generation of autaptic mPSCs in retinal ganglion cells (Han et al. 2001). Using a similar argument to that for ryanodine receptors, it seems likely that these receptors are located on portions of the ER with a position relatively close to the release machinery. This is in contrast to anatomical studies, which have found staining for IP3 receptors only in dendritic and somatic portions of neurones (Sharp et al. 1993). The failure to detect IP3 receptors in presynaptic terminals may lie in the lack of specificity and/or purity of antibodies available.
Classical antagonists at IP3 receptors like heparin and decavanadate are not membrane permeant. Hence, we used the membrane permeant compound 2APB to block presynaptic IP3 receptors. The dose-response curve for 2APB, which we determined, was similar to the one originally described (Maruyama et al. 1997), with a slight shift towards lower concentrations. At higher concentrations, 2APB interferes with Ca2+ homeostasis due to a putative partial inhibition of Ca2+-ATPase (Maruyama et al. 1997). This causes an increase in basal Ca2+ levels accompanied by an increase in mEPSC frequency, which might be interpreted as agonist action (see Fig. 5E). It is likely that the block by 2APB was close to complete, since the production of IP3 in response to DHPG did not result in an increase in the frequency of mEPSCs and the cumulative action of ryanodine and 2APB resulted in a reduction of mEPSCs, which was similar to the one obtained by BAPTA-AM alone.
We are aware that 2APB not only blocks IP3 receptors but also TRP channels (for example Dobrydneva & Blackmore, 2001). Our experiments using 2APB are also consistent with a block of TRP channels. However, it is unlikely that 2APB acted on TRP channels for the following reason. Since these channels allow Ca2+ entry from the extracellular space, lowering extracellular Ca2+ should have reduced the mEPSC frequency. This was not observed (Simkus & Stricker, 2002).
Like ryanodine receptors, IP3 receptors have a very low probability of opening without IP3 binding. Since we provide evidence for tonic activation of IP3 receptors, it is likely that Ca2+ release from IP3 stores does not reflect the spontaneous gating of the channel but the local IP3 availability. The opening of a set of IP3 receptors causes a local increase in Ca2+, called a Ca2+ puff (Parker & Yao, 1991), which is likely to underlie the 2APB-sensitive mEPSCs.
Presynaptic group I metabotropic glutamate receptors
We chose to activate intracellular IP3 production using a group I metabotropic glutamate receptor (mGluR) agonist, DHPG. Group I mGluRs are widely distributed in the neuropil of the superficial layers; in particular the mGluR5 subtype is the predominant form on postsynaptic dendritic spines and shafts in these layers. However, some mGluR5 immunoreactivity has been found on presynaptic axon terminals (Romano et al. 1995). The pharmacological profile and the immunocytochemical data suggest that in our case, the receptor subtype is likely to be mGluR5 since mGluR1 is only found on postsynaptic structures (Luján et al. 1997).
The activation of group I mGluRs results in the production of both IP3 and diacyl glycerol (DAG). It is possible that activation with DHPG may have induced a change in transmitter release via the action of DAG, which acts as a second messenger to activate protein kinase C. The activation of protein kinase C could activate the release machinery directly (Yawo, 1999). However, our results suggest that DHPG caused transmitter release via direct activation of IP3 receptors, rather than via a stimulation of the DAG-protein kinase C signalling pathway, since DHPG failed to cause an increase in mEPSC frequency when IP3 receptors were blocked with 2APB. The same experiment provides an excellent control for the specificity of 2APB to block IP3 stores, which is consistent with the report by Maruyama et al. (1997). It also indicates that mGluRs are located in close proximity to the presynaptic terminal.
Our data suggests that under physiological conditions the concentration of IP3 is sufficiently high to tonically activate endoplasmic IP3 receptors. IP3 might be produced as a result of metabotropic receptor activation by glutamate and/or another transmitter like acetylcholine. This consideration highlights the potential of modulatory interaction between different transmitter systems.
The results of blocking and activating IP3 receptors indicate that the dynamic range over which IP3 receptor activation can modulate mEPSC frequency corresponds to a factor of 2. This modulation is markedly smaller than that of the ryanodine receptor response.
Store interactions
The results presented in Table 1 indicate that after the reduction in mEPSC frequency by ryanodine by approximately 28 %, there is an additional decrease of almost 12 % when 2APB is added. This suggests that Ca2+ release from ryanodine stores produces approximately twice the number of mEPSCs as generated by the Ca2+ from IP3-sensitive stores alone. Given that with the reverse experiment ryanodine receptors do not induce mEPSCs when IP3 receptors are blocked, this result implies that an amplification step is involved. This is likely to be CICR. Amplification could occur through any of several ways. The first is if the Ca2+ concentration for activation of the ryanodine receptor is less than that for the release machinery. Data in different preparations indicate that the Kd value for activation of the ryanodine receptor is in the range of a 0.5-3 μm (Meissner, 1994), but the value for synchronous release of transmitter is in the range of 100 μm (Heidelberger et al. 1994). Therefore, it is possible that ryanodine stores could assist in amplifying the Ca2+ transient from IP3 stores. Another way relies on properties of the receptor channels alone, such as the reported single channel conductance, which is more than double the conductance of the IP3-receptor channel (McPherson & Campbell, 1993; Watras et al. 1991) and which would allow more efficient triggering of the release machinery. Other contributions could come from kinetic differences between the two channels; the relative spatial distribution of the receptors; or the location of the stores to the release machinery.
We have provided evidence for presynaptic intracellular Ca2+ stores capable of causing transmitter release either via Ca2+ sparks or puffs; the latter might be amplified by CICR. Our data provide a new perspective on how excitatory transmitter release can be caused and modulated in neocortex.
Acknowledgments
We thank Drs Anna Cowan, Urs Gerber and Steve Redman for their comments on earlier drafts of this manuscript. This work was supported by grants from the Swiss National Science Foundation (5002-42787 and 5002-057809).
References
- Bird MM. Presynaptic and postsynaptic organelles of synapses formed in cultures of previously dissociated mouse spinal cord. Cell and Tissue Research. 1978;194:503–511. doi: 10.1007/BF00236169. [DOI] [PubMed] [Google Scholar]
- Capogna M, Gähwiler BH, Thompson SM. Presynaptic enhancement of inhibitory synaptic transmission by protein kinases A and C in the rat hippocampus in vitro. Journal of Neuroscience. 1995;15:1249–1260. doi: 10.1523/JNEUROSCI.15-02-01249.1995. [DOI] [PMC free article] [PubMed] [Google Scholar]
- Carter AG, Vogt KE, Foster KA, Regehr WG. Assessing the role of calcium-induced calcium release in short-term presynaptic plasticity at excitatory central synapses. Journal of Neuroscience. 2002;22:21–28. doi: 10.1523/JNEUROSCI.22-01-00021.2002. [DOI] [PMC free article] [PubMed] [Google Scholar]
- Chavez-Noriega LE, Stevens CF. Increased transmitter release at excitatory synapses produced by direct activation of adenylate cyclase in rat hippocampal slices. Journal of Neuroscience. 1994;14:310–317. doi: 10.1523/JNEUROSCI.14-01-00310.1994. [DOI] [PMC free article] [PubMed] [Google Scholar]
- Del Castillo J, Katz B. Quantal components of the end-plate potential. Journal of Physiology. 1954;124:560–573. doi: 10.1113/jphysiol.1954.sp005129. [DOI] [PMC free article] [PubMed] [Google Scholar]
- Dobrydneva Y, Blackmore P. 2-aminoethoxydiphenyl borate directly inhibits store-operated calcium entry channels in human platelets. Molecular Pharmacology. 2001;60:541–552. [PubMed] [Google Scholar]
- Emptage NJ, Reid CA, Fine A. Calcium stores in hippocampal synaptic boutons mediate short-term plasticity, store-operated Ca2+ entry, and spontaneous release. Neuron. 2001;29:197–208. doi: 10.1016/s0896-6273(01)00190-8. [DOI] [PubMed] [Google Scholar]
- Fredholm BB, Bättig K, Holmén J, Nehlig A, Zvartau EE. Actions of caffeine in the brain with special reference to factors that contribute to its widespread use. Pharmacological Reviews. 1999;51:83–147. [PubMed] [Google Scholar]
- Garaschuk O, Yaari Y, Konnerth A. Release and sequestration of calcium by ryanodine-sensitive stores in rat hippocampal neurones. Journal of Physiology. 1997;502:13–30. doi: 10.1111/j.1469-7793.1997.013bl.x. [DOI] [PMC free article] [PubMed] [Google Scholar]
- Han M-H, Kawasaki A, Wei J-Y, Barnstable CJ. Miniature postsynaptic currents depend on Ca2+ released from internal stores via PLC/IP3 pathway. NeuroReport. 2001;12:2203–2207. doi: 10.1097/00001756-200107200-00032. [DOI] [PubMed] [Google Scholar]
- Hartter DE, Burton PR, Laveri LA. Distribution and calcium-sequestering ability of smooth endoplasmic reticulum in olfactory axon terminals of frog brain. Neuroscience. 1987;23:371–386. doi: 10.1016/0306-4522(87)90297-1. [DOI] [PubMed] [Google Scholar]
- Heidelberger R, Heinemann C, Neher E, Matthews G. Calcium dependence of the rate of exocytosis in a synaptic terminal. Nature. 1994;371:513–515. doi: 10.1038/371513a0. [DOI] [PubMed] [Google Scholar]
- Heuser JE, Reese TS. Evidence for recycling of synaptic vesicle membrane during transmitter release at the frog neuromuscular junction. Journal of Cell Biology. 1973;57:315–344. doi: 10.1083/jcb.57.2.315. [DOI] [PMC free article] [PubMed] [Google Scholar]
- Iino M, Endo M. Calcium-dependent immediate feedback control of inositol 1,4,5-trisphosphate-induced Ca2+ release. Nature. 1992;360:76–78. doi: 10.1038/360076a0. [DOI] [PubMed] [Google Scholar]
- Larkman AU. Dendritic morphology of pyramidal neurones of the visual cortex of the rat: III. Spine distributions. Journal of Comparative Neurology. 1991;306:332–343. doi: 10.1002/cne.903060209. [DOI] [PubMed] [Google Scholar]
- Llano I, Gerschenfeld HM. Beta-adrenergic enhancement of inhibitory synaptic activity in rat cerebellar stellate and Purkinje cells. Journal of Physiology. 1993;468:201–224. doi: 10.1113/jphysiol.1993.sp019767. [DOI] [PMC free article] [PubMed] [Google Scholar]
- Llano I, González J, Caputo C, Lai FA, Blayney LM, Tan YP, Marty A. Presynaptic calcium stores underlie large-amplitude miniature IPSCs and spontaneous calcium transients. Nature Neuroscience. 2000;3:1256–1265. doi: 10.1038/81781. [DOI] [PubMed] [Google Scholar]
- Luján R, Roberts JDB, Shigemoto R, Ohishi H, Somogyi P. Differential plasma membrane distribution of metabotropic glutamate receptors mGluR1α, mGluR2 and mGluR5, relative to neurotransmitter release sites. Journal of Chemical Neuroanatomy. 1997;13:219–241. doi: 10.1016/s0891-0618(97)00051-3. [DOI] [PubMed] [Google Scholar]
- Lysakowski A, Figueras H, Price SD, Peng Y-Y. Dense-cored vesicles, smooth endoplasmic reticulum, and mitochondria are closely associated with non-specialized parts of plasma membrane of nerve terminals: Implications for exocytosis and calcium buffering by intraterminal organelles. Journal of Comparative Neurology. 1999;403:378–390. doi: 10.1002/(sici)1096-9861(19990118)403:3<378::aid-cne7>3.0.co;2-x. [DOI] [PMC free article] [PubMed] [Google Scholar]
- McPherson PS, Campbell KP. The ryanodine receptor/Ca2+ release channel. Journal of Biological Chemistry. 1993;268:13765–13768. [PubMed] [Google Scholar]
- Maruyama T, Kanaji T, Nakade S, Kanno T, Mikoshiba K. 2APB, 2-aminoethoxydiphenyl borate, a membrane-permeable modulator of Ins(1, 4, 5)P3-induced Ca2+ release. Journal of Biochemistry. 1997;122:498–505. doi: 10.1093/oxfordjournals.jbchem.a021780. [DOI] [PubMed] [Google Scholar]
- Meissner G. Ryanodine receptor/Ca2+ release channels and their regulation by endogenous effectors. Annual Review of Physiology. 1994;56:485–508. doi: 10.1146/annurev.ph.56.030194.002413. [DOI] [PubMed] [Google Scholar]
- Melamed-Book N, Helm PJ, Rahamimoff R. Confocal microscopy reveals coordinated calcium fluctuations and oscillations in synaptic boutons. Journal of Neuroscience. 1993;13:632–649. doi: 10.1523/JNEUROSCI.13-02-00632.1993. [DOI] [PMC free article] [PubMed] [Google Scholar]
- Naraghi M, Neher E. Linearized buffered Ca2+ diffusion in microdomains and its implications for calculation of [Ca2+] at the mouth of a calcium channel. Journal of Neuroscience. 1997;17:6961–6973. doi: 10.1523/JNEUROSCI.17-18-06961.1997. [DOI] [PMC free article] [PubMed] [Google Scholar]
- Narita K, Akita T, Hachisuka J, Huang S-M, Ochi K, Kuba K. Functional coupling of Ca2+ channels to ryanodine receptors at presynaptic terminals. Amplification of exocytosis and plasticity. Journal of General Physiology. 2000;115:519–532. doi: 10.1085/jgp.115.4.519. [DOI] [PMC free article] [PubMed] [Google Scholar]
- Nett WJ, Oloff SH, McCarthy KD. Hippocampal astrocytes in situ exhibit calcium oscillations that occur independent of neuronal activity. Journal of Neurophysiology. 2002;87:528–537. doi: 10.1152/jn.00268.2001. [DOI] [PubMed] [Google Scholar]
- Ouanounou A, Zhang L, Charlton MP, Carlen PL. Differential modulation of synaptic transmission by calcium chelators in young and aged hippocampal CA1 neurons: Evidence for altered calcium homeostasis in aging. Journal of Neuroscience. 1999;19:906–915. doi: 10.1523/JNEUROSCI.19-03-00906.1999. [DOI] [PMC free article] [PubMed] [Google Scholar]
- Parducz A, Dunant Y. Transient increase of calcium in synaptic vesicles after stimulation. Neuroscience. 1993;52:27–33. doi: 10.1016/0306-4522(93)90178-i. [DOI] [PubMed] [Google Scholar]
- Parker I, Yao Y. Regenerative release of calcium from functionally discrete subcellular stores by inositol trisphosphate. Proceedings of the Royal Society B. 1991;246:269–274. doi: 10.1098/rspb.1991.0154. [DOI] [PubMed] [Google Scholar]
- Parpura V, Basarsky TA, Liu F, Jeftinija K, Jeftinija S, Haydon PG. Glutamate-mediated astrocyte-neuron signalling. Nature. 1994;369:744–747. doi: 10.1038/369744a0. [DOI] [PubMed] [Google Scholar]
- Parri HR, Gould TM, Crunelli V. Spontaneous astrocytic Ca2+ oscillations in situ drive NMDAR-mediated neuronal excitation. Nature Neuroscience. 2001;4:803–812. doi: 10.1038/90507. [DOI] [PubMed] [Google Scholar]
- Pickel VM, Clarke CL, Meyers MB. Ultrastructural localization of sorcin, a 22 kDa calcium binding protein in the rat caudate-putamen nucleus: Association with ryanodine receptors and intracellular calcium release. Journal of Comparative Neurology. 1997;386:625–634. doi: 10.1002/(sici)1096-9861(19971006)386:4<625::aid-cne8>3.0.co;2-4. [DOI] [PubMed] [Google Scholar]
- Pozzan T, Rizzuto R, Volpe P, Meldolesi J. Molecular and cellular physiology of intracellular calcium stores. Physiological Reviews. 1994;74:595–636. doi: 10.1152/physrev.1994.74.3.595. [DOI] [PubMed] [Google Scholar]
- Press WH, Teukolsky SA, Vetterling WT, Flannery BP. Numerical Recipes in C. Cambridge: Cambridge University Press; 1992. [Google Scholar]
- Romano C, Sesma MA, McDonald CT, O'Malley KL, Van Den Pol AN, Olney JW. Distribution of metabotropic glutamate receptor mGluR5 immunoreactivity in rat brain. Journal of Comparative Neurology. 1995;355:455–469. doi: 10.1002/cne.903550310. [DOI] [PubMed] [Google Scholar]
- Sah P. Ca2+-activated K+ currents in neurones: Types, physiological roles and modulation. Trends in Neurosciences. 1996;19:150–154. doi: 10.1016/s0166-2236(96)80026-9. [DOI] [PubMed] [Google Scholar]
- Savic N, Sciancalepore M. Intracellular calcium stores modulate miniature GABA-mediated synaptic currents in neonatal rat hippocampal neurons. European Journal of Neuroscience. 1998;10:3379–3386. doi: 10.1046/j.1460-9568.1998.00342.x. [DOI] [PubMed] [Google Scholar]
- Schoepp DD, Goldsworthy J, Johnson BG, Salhoff CR, Baker SR. 3,5-Dihydroxyphenylglycine is a highly selective agonist for phosphoinositide-linked metabotropic glutamate receptors in the rat hippocampus. Journal of Neurochemistry. 1994;63:769–772. doi: 10.1046/j.1471-4159.1994.63020769.x. [DOI] [PubMed] [Google Scholar]
- Seymour-Laurent KJ, Barish ME. Inositol 1,4,5-trisphosphate and ryanodine receptor distributions and patterns of acetylcholine- and caffeine-induced calcium release in cultured mouse hippocampal neurons. Journal of Neuroscience. 1995;15:2592–2608. doi: 10.1523/JNEUROSCI.15-04-02592.1995. [DOI] [PMC free article] [PubMed] [Google Scholar]
- Sharp AH, McPherson PS, Dawson TM, Aoki C, Campbell KP, Snyder SH. Differential immunohistochemical localization of inositol 1,4,5-trisphosphate- and ryanodine-sensitive Ca2+ release channels in rat brain. Journal of Neuroscience. 1993;13:3051–3063. doi: 10.1523/JNEUROSCI.13-07-03051.1993. [DOI] [PMC free article] [PubMed] [Google Scholar]
- Simkus CRL, Stricker C. Properties of mEPSCs recorded in layer II neurones of rat barrel cortex. Journal of Physiology. 2002;545:509–520. doi: 10.1113/jphysiol.2002.022095. [DOI] [PMC free article] [PubMed] [Google Scholar]
- Sutko JL, Airey JA, Welch W, Ruest L. The pharmacology of ryanodine and related compounds. Pharmacological Reviews. 1997;49:54–98. [PubMed] [Google Scholar]
- Watras J, Bezprozvanny I, Ehrlich BE. Inositol 1,4,5-trisphosphate-gated channels in cerebellum: Presence of multiple conductance states. Journal of Neuroscience. 1991;11:3239–3245. doi: 10.1523/JNEUROSCI.11-10-03239.1991. [DOI] [PMC free article] [PubMed] [Google Scholar]
- Westrum LE, Gray EG. New observations on the substructure of the active zone of brain synapses and motor endplates. Proceedings of the Royal Society. 1986;B229:29–38. doi: 10.1098/rspb.1986.0072. [DOI] [PubMed] [Google Scholar]
- Xu A, Hawkins C, Narayanan N. Phosphorylation and activation of the Ca2+-pumping ATPase of cardiac sarcoplasmic reticulum by Ca2+/calmodulin-dependent protein kinase. Journal of Biological Chemistry. 1993;268:8394–8397. [PubMed] [Google Scholar]
- Yawo H. Protein kinase C potentiates transmitter release from the chick ciliary presynaptic terminal by increasing the exocytotic fusion probability. Journal of Physiology. 1999;515:169–180. doi: 10.1111/j.1469-7793.1999.169ad.x. [DOI] [PMC free article] [PubMed] [Google Scholar]
- Zilberter Y. Dendritic release of glutamate suppresses synaptic inhibition of pyramidal neurons in rat neocortex. Journal of Physiology. 2000;528:489–496. doi: 10.1111/j.1469-7793.2000.00489.x. [DOI] [PMC free article] [PubMed] [Google Scholar]