Abstract
We report on responses of olfactory receptor neurons (ORNs) upon application of amino acids and forskolin using a novel slice preparation of the olfactory epithelium of Xenopus laevis tadpoles. Responses were measured using the patch-clamp technique. Both amino acids and forskolin proved to be potent stimuli. Interestingly, a number of ORNs that responded to amino acids did not respond to forskolin. This suggests that some amino acids activate transduction pathways other than the well-known cAMP-mediated one. The differential processing of cAMP-mediated stimuli on the one hand and amino acid stimuli on the other was further elucidated by calcium-imaging of olfactory bulb neurons using a novel nose-olfactory bulb preparation of Xenopus laevis tadpoles. The projection pattern of amino acid-sensitive ORNs to olfactory bulb neurons differed markedly from the projection pattern of forskolin-sensitive ORNs. Olfactory bulb neurons activated by amino acids were located laterally compared to those activated by forskolin, and only a small proportion responded to both stimuli. The ensemble of neurons activated by forskolin was also activated by the phosphodiesterase inhibitor 3-isobutyl-1-methylxanthine (IBMX) and the membrane-permeant cAMP analogue 8-(4-chlorophenylthio)adenosine 3′,5′-cyclic monophosphate (pCPT-cAMP). We therefore conclude that sensory transduction of a number of amino acids is cAMP independent, and amino acid- and cAMP-mediated responses are processed differentially at the level of the olfactory bulb.
Olfactory receptor neurons convey information about the chemical environment to the brain. Among the first steps in this signalling process are the binding of odorants to olfactory receptors (ORs) (Buck & Axel, 1991) and the transduction of this event into action potentials. The number of ORs in higher vertebrates is assumed to be about 1000. The question of whether all ORs couple to one or more transduction cascades has been debated over a number of years (Schild & Restrepo, 1998; Gold, 1999), and the simple view of cAMP as the only olfactory second messenger has had to be abandoned (Zufall & Munger, 2001). Rather there appears to be a diversity of transduction mechanisms in different kinds of ORNs (Michel & Ache, 1994; Zufall & Munger, 2001). Although a number of stimuli have been shown to be associated with either cAMP or IP3 production (Sklar et al. 1986; Boekhoff et al. 1994, 1990), such relationships are unknown for most olfactory stimuli and the ORNs they act upon.
In aquatic species, amino acids are potent olfactory stimuli (Caprio & Byrd, 1984; Restrepo et al. 1990; Freitag et al. 1995; Kang & Caprio, 1995, 1997; Iida & Kashiwayanagi, 1999; Vogler & Schild 1999). Chemically they are a well-defined group of molecules, many of which act as neurotransmitters or neurotransmitter precursors. In the CNS, amino acid neurotransmitter receptors couple to a variety of transduction mechanisms (Kandel et al. 2000). Their transduction pathways in ORNs are not known. Here we present evidence that the transduction pathways of many amino acids in ORNs are independent of cAMP.
Methods
Slice preparation for patch-clamp recordings
Tadpoles of Xenopus laevis (stages 49-54) (Nieuwkoop & Faber, 1956) were chilled in a mixture of ice and water and decapitated, as approved by the Göttingen University Committee for Ethics in Animal Experimentation. A block of tissue containing the olfactory mucosae, the intact olfactory nerves and most of the brain was cut out and kept in bath solution (see below). The tissue was glued onto the stage of a vibroslicer (VT 1000S, Leica, Bensheim, Germany) and cut horizontally into 120-125 μm-thick slices (Fig. 1A). The slices were placed under a grid in a recording chamber (Edwards et al. 1989) and viewed using Nomarski optics (Axioskop 2, Zeiss, Göttingen, Germany). Olfactory receptor neurons were easily recognized by their characteristic shape. Figure 1C and D shows a slice of the olfactory epithelium (‘mucosa slice’) stained with biocytin- avidin by backfilling the receptor axons from the glomerular layer of the olfactory bulb. The slice was counterstained with propidium iodide (see next section for staining procedures).
Figure 1. Slice of the olfactory mucosa and the olfactory bulb.
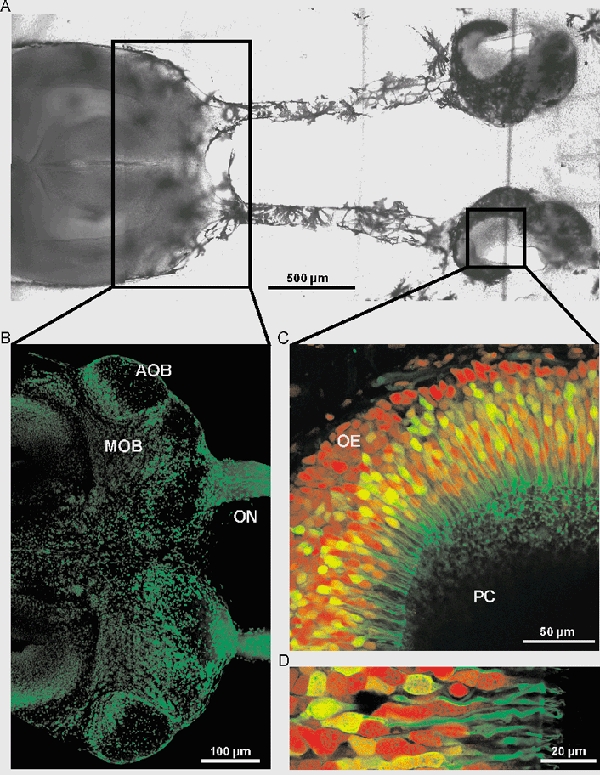
A, image of the slice of the olfactory mucosa and the olfactory bulb. B, slice of the anterior part of the brain including the olfactory nerve (ON), the main olfactory bulb (MOB) and the accessory olfactory bulb (AOB) stained with propidium iodide. C, horizontal overview of the olfactory epithelium (PC, principal cavity and OE, olfactory epithelium). The neurons were backfilled through the nerve using biocytin-avidin staining (green fluorescence), and the slice was counterstained with propidium iodide (red fluorescence). D, higher magnification of C, showing ORNs with dendrites, dendritic knobs and cilia.
Staining of the olfactory mucosa and the olfactory bulb
Tadpoles were chilled and killed as described above. For staining the olfactory mucosa, a block of tissue containing the olfactory mucosa, the olfactory nerves and the anterior part of the brain, including the olfactory bulb, was cut out. The blocks of tissue were pinned to the bottom of a silicone-covered Petri dish, and the tissue above the olfactory bulb was removed. Then, 5 μl of DMSO was dropped onto the olfactory bulb and crystals of biocytin (Molecular Probes, Eugene, OR, USA) were pinched into the glomerular layer using a fine needle. After 40 min of nerve backfilling the blocks were put into bath solution (see below) for 1 h. The blocks were then fixed in 4 % formaldehyde in phosphate-buffered saline (PBS, pH 7.4) overnight, washed in PBS, embedded in 5 % low melting point agarose (Sigma, Deisenhofen, Germany), and sectioned at 70 μm thickness on a vibroslicer. Sections were washed in PBS containing 0.2 % Triton X-100 (PBST), and the tissue was incubated in avidin, ALEXA 488 conjugated (Molecular Probes, 1 : 200 in PBS with 0.2 % Triton X-100) for 2 h at room temperature. After washing off the avidin in PBS, sections were incubated for 15 min in 25 μg ml−1 propidium iodide (Molecular Probes) in PBS to stain cell nuclei. Sections were washed in at least five changes of PBS and transferred into 60 % glycerol-PBS for at least 1 h and finally mounted on slides in 80 % glycerol-PBS. For staining cell nuclei of olfactory bulb neurons, slices of the anterior part of the brain were fixed in formaldehyde, incubated in propidium iodide, washed and mounted on slides as described above. Preparations were viewed and imaged using a laser-scanning confocal microscope (Zeiss LSM 510/Axiovert 100, Jena, Germany).
Patch-clamp recordings
Patch electrodes with a tip diameter of 1-2 μm and approximately 7-10 MΩ resistance were fabricated from borosilicate glass with 1.8 mm outer diameter (Hilgenberg, Malsfeld, Germany) using a two-stage electrode puller (Narishige, Tokyo, Japan) and fire-polished. Pulse protocols, data acquisition and evaluation programs were written in ‘C’. Voltage pulses were delivered from a microcontroller (Schild et al. 1996) to a D/A converter and then to the patch-clamp amplifier (EPC7; List, Darmstadt, Germany) in order to assess the impedance in the on-cell and whole-cell configurations. Holding voltage in the on-cell configuration was 0 mV, while in whole-cell recordings, an average voltage of −75 mV was set by current injection in the current-clamp mode. Currents and voltages were recorded on video tape using a PCM unit (Instrutech, Elmont, NY, USA). The data were digitized off-line using an 8-pole Bessel filter, an A/D converter and a PC. Further data analysis was performed on a PC under the LINUX operating system.
Nose-olfactory bulb preparation and calcium imaging
Tadpoles (stages 51-53) were chilled in a mixture of ice and water and after subsequent decapitation a block of tissue containing the olfactory mucosae, olfactory nerves and the brain was cut out. The tissue was glued on a stage of a vibroslicer, and only the dorsal surface of the olfactory bulb was sliced off. The olfactory mucosae and olfactory nerves were left intact. The nose-olfactory bulb preparation was transferred to a recording chamber, and 200 μl of bath solution (see below) containing 50 μm Fura-2 AM (Molecular Probes) was added. After incubation for 1 h at room temperature on a shaker, the tissue block was rinsed with bath solution, glued into the recording chamber using 5 % low melting point agarose, covered with bath solution and viewed under an upright microscope using a ×10 objective (Axioskop 2, Zeiss, Göttingen, Germany). Preparations were rinsed with bath solution for ar least 20 min under a bath flow at a rate of 550 μl min−1 in the recording set-up. To estimate intracellular calcium concentrations ([Ca2+]i), pairs of fluorescence images (F340 and F380, alternating excitation at 340 and 380 nm; emission > 505 nm) of the olfactory bulb were taken using a frame transfer, back-illuminated CCD camera (Micromax, Visitron, München, Germany) and a custom-built monochromator with a xenon light source. Image pairs were acquired at 0.96 Hz and 500 ms exposure time per image. The [Ca2+]i responses of mitral and granule cells were represented pixelwise as the ratio F340/F380, whereby the mean values of the autofluorescence of unstained slices were taken as background values. The background-corrected ratio R of the fluorescence images excited at 340 and 380 nm (F340 and F380) was taken as an estimate of [Ca2+]i, and correspondingly, the changes ΔR(t) + R(t) - R(t + 0) were taken as estimates for Δ[Ca2+]i(t). Anatomical identification of mitral and granule cells was based on morphological criteria according to previous investigations by Nezlin & Schild (2000).
Figure 1B shows a slice of the anterior part of the brain including the olfactory nerves (ON), the main olfactory bulb (MOB) and the accessory olfactory bulb (AOB) stained with propidium iodide (see above).
Solutions and stimulus application
The composition of the bath solution was (mm): 98 NaCl, 2 KCl, 1 CaCl2, 2 MgCl2, 5 glucose, 5 sodium pyruvate, 10 Hepes. The pipette solution used for whole-cell and on-cell recordings contained (mm): 2 NaCl, 47 KCl, 2 MgCl2, 43 potassium gluconate, 10 Hepes, 0.2 EGTA, 2 Na2-ATP, 0.1 Na2-GTP. All solutions were adjusted to pH 7.8. Osmolarities of the bath and pipette solutions were 230 mosmol l−1 and 190 mosmol l−1, respectively. The amino acids listed in Table 1 were used as odorants, applied either as a mixture of 19 amino acids (AA), or as submixtures (LCN, SCN, BAS, ACID and AROM), or single amino acids. The amino acids, as well as the membrane-permeant cAMP analogue 8-(4-chlorophenylthio)adenosine 3′,5′-cyclic monophosphate (pCPT-cAMP), were dissolved in bath solution (10 mm stock, each), while forskolin and the phosphodiesterase inhibitor 3-isobutyl-1-methylxanthine (IBMX) were dissolved in DMSO (10 mm and 50 mm stock, respectively). All of these chemicals were purchased from Sigma. Stimulus solutions were prepared immediately before use by dissolving the respective stock solution in bath solution (for final concentrations see text and figure legends).
Table 1.
Water-soluble mixtures of L-amino acids
| Mixture | Amino acids |
|---|---|
| LCN | Proline, valine, leucine, isoleucine, methionine |
| SCN | Glycine, alanine, serine, threonine, cysteine, asparagine, |
| BAS | Arginine, lysine, histidine |
| ACID | Glutamate, aspartate |
| AROM | Tryptophane, phenylalanine |
| AA | LCN, SCN, BAS, ACID and AROM |
Mxtures of L-amino acids following groups established by Caprio & Byrd (1984). LCN, long chain neutral amino acids. SCN, short chain neutral amino acids. BAS, alkline amino acids. ACID, acidic amino acids. AROM, aromatic amino acids.
In patch-clamp experiments, the bath solution was applied to the recording chamber by gravity feed from a storage syringe through a funnel drug applicator (Schild, 1985). The tip of the applicator was placed as close as possible to the olfactory epithelium. The flow was 250 μl min−1. Odorants were pipetted directly into the funnel without stopping the flow. The minimum interstimulus interval was 1 min. The dilution of the stimulus within the funnel was less than 1 %. The dilution of the stimulus in the mucosa was determined by putting a confocal volume (≈1 fl) of a laser-scanning confocal microscope (Zeiss LSM 510/Axiovert 100, Jena, Germany), firstly, in front of the funnel outlet and, secondly, in front of the epithelial surface and measuring the respective fluorescences. For this control measurement the fluorescent probe tetramethylrhodamine (TMR, 500 nm) was used as a ‘dummy stimulus’. The dilution factor was 0.91 ± 0.02 (mean ± s.d., n = 7). The delay between TMR leaving the funnel outlet and reaching the mucosal surface was less than 1 s, and after the end of stimulation, TMR was completely rinsed from the mucosa within 15 s.
In the calcium-imaging experiments, odorants were applied directly into the funnel as described above. The tip of the applicator was placed directly above the ipsilateral mucosa. Odorants were pipetted into the funnel without stopping the flow. An additional bath applicator was positioned close to the olfactory bulb using a higher flow rate of 550 μl min−1. Outflow was through a syringe needle placed close to the mucosa and the stimulus applicator to ensure that odorant molecules were removed rapidly with the fast bath stream. Suction was adjusted to balance the slower bath flow through the funnel applicator and the fast bath flow. The minimum interstimulus interval in calcium-imaging experiments was 5 min. To exclude any direct effects of odorant stimuli on olfactory bulb neurons, a series of control experiments were performed. After stimulation with the mix of amino acids and forskolin, the olfactory nerves were cut and the stimulation repeated. We did not observe any responses to either stimuli after transsection of the olfactory nerves, and we found no differences from control conditions. However, to further exclude any direct effects on olfactory bulb neurons, we removed critical amino acids (l-glutamate, l-aspartate, l-glutamine, l-asparagine). Therefore, the amino acid mix we used in calcium-imaging experiments contained only 15 l-amino acids compared to the mix of 19 amino acids used for patch-clamp measurements in ORNs.
Results
Responses to amino acids
We recorded the response behaviour of ORNs (stages 49-54) upon application of 19 amino acids using the patch-clamp technique. Two hundred and twenty-seven cells were tested, 111 in the on-cell configuration and 116 in the whole-cell configuration. The amino acids were applied either as a mixture of 19 amino acids (AA), each at a concentration of 200 μm, or as amino acid submixtures (Fig. 2), or as single amino acids, each at 200 μm. Twenty-seven ORNs out of 227 responded to at least one amino acid. In 11 cells, all 19 amino acids were tested (Table 2). In all cases the overall effect on spiking rate was excitatory, whereby the spontaneous spiking activity of the ORNs was always sufficiently high (Fig. 3) to detect a decrease if it should have occurred.
Figure 2. Odorant responses of different ORNs (stages 53 and 54) in the mucosa slice recorded in the on-cell configuration.
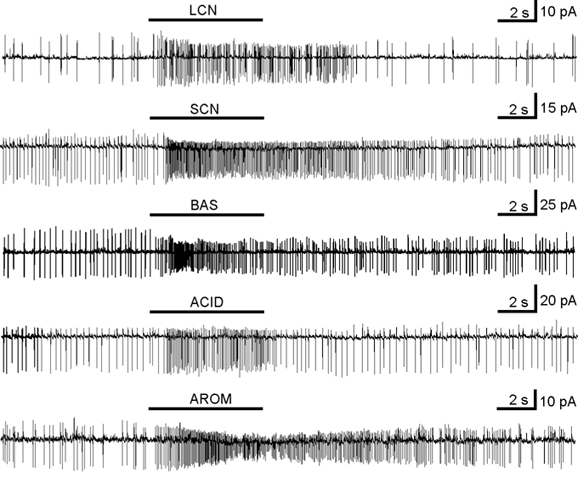
The current traces from top to bottom show excitatory responses to the mixtures of long chain neutral (LCN), short chain neutral (SCN), alkaline (BAS), acidic (ACID) and aromatic (AROM) amino acids. In all of the submixtures the concentration of the individual amino acids was 200 μm.
Table 2.
Responses of 11 ORNs to single amino acids
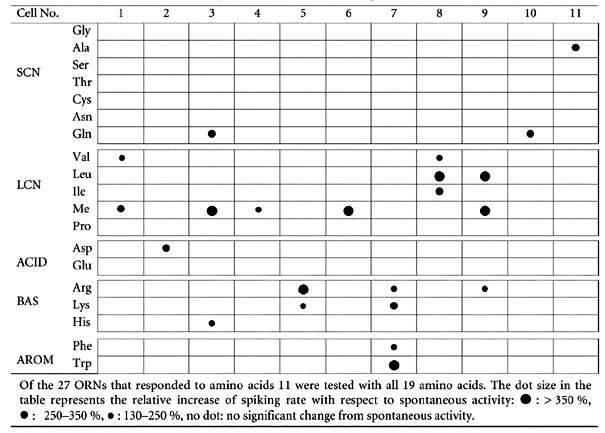
Figure 3. Frequency histogram of spontaneous spiking activities of ORNs in the mucosa slice.
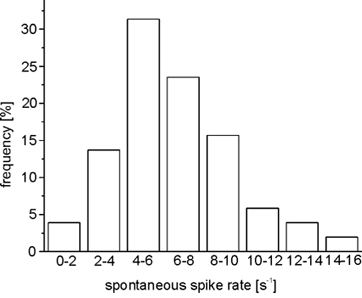
Fifty-one ORNs (stages 49-54), recorded in the on-cell mode and tested for both forskolin and amino acids, were evaluated for this histogram.
Figure 4 shows an example of a cell (Table 2, cell No. 3) which responded to the amino acid mixture, to the mixtures of the long chain neutral amino acids (LCN), the short chain neutral amino acids (SCN), and the alkaline amino acids (BAS), as well as to l-methionine, l-glutamine and l-histidine. It responded neither to the mixtures of aromatic amino acids (AROM) or acidic amino acids (ACID) nor to other long chain neutral, short chain neutral or alkaline amino acids. Stimulus responses came back to spontaneous activity within a variable time that depended on the specific stimulus and never exceeded 60 s.
Figure 4. Odorant responses of a single ORN in the mucosa slice from a tadpole (stage 53) recorded in on-cell configuration.
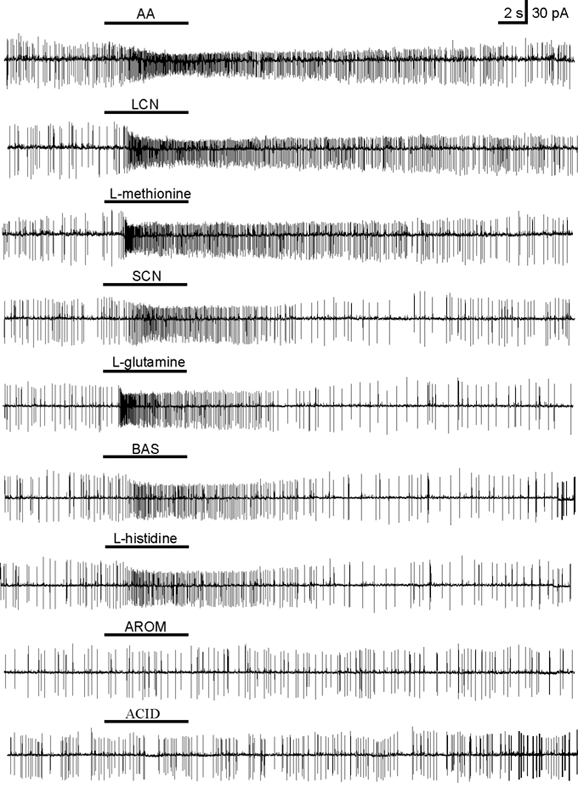
The current traces from top to bottom show responses to: the mixture of amino acids (AA), the mixture of long chain neutral amino acids (LCN), l-methionine, the mixture of short chain neutral amino acids (SCN), l-glutamine, the mixture of alkaline amino acids (BAS) and to l-histidine. There was no response to the mixtures of aromatic (AROM) and acidic (ACID) amino acids. All amino acids were applied at a concentration of 200 μm. The traces are arranged according to the intensities of the responses to the different stimuli.
Lack of correlation between responses to amino acids and to activators of the cAMP-mediated transduction pathway
Ninety ORNs were tested with forskolin (10-100 μm) and amino acids (200 μm) using the patch-clamp technique, 51 in the on-cell configuration and 39 in the whole-cell configuration. Twenty-one out of these ORNs exhibited a response. Nine of these 21 ORNs responded to forskolin, but not to amino acids (Fig. 5B and D). The remaining 12 ORNs responded to amino acids but, interestingly, only 5 of these 12 ORNs also responded to forskolin (Fig. 5A and D), while 7 responded to amino acids only (Fig. 5C and D). This result, though based on small numbers, clearly indicates that some amino acids are transduced in a cAMP-independent way.
Figure 5. Correlation of odorant and forskolin responses.
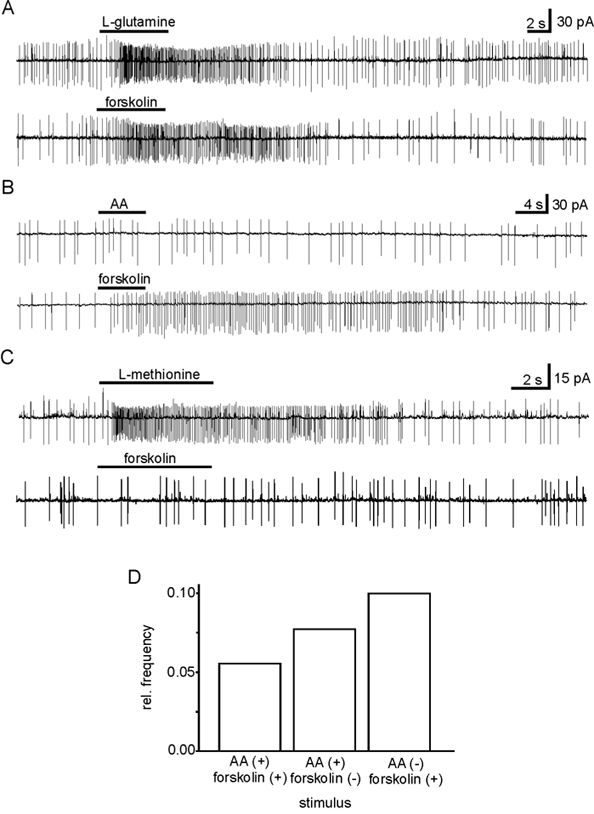
A, ORN (stage 53) excited by both l-glutamine (200 μm) and forskolin (50 μm). B, ORN (stage 51) excited by forskolin (50 μm) but not by the mixture of amino acids (AA, 200 μm). C, ORN (stage 54) excited by an amino acid (l-methionine, 200 μm) but not by forskolin (50 μm). D, occurrences of correlated and uncorrelated responses to forskolin and amino acids. Sixty-nine out of the 90 ORNs tested responded neither to amino acids nor to forskolin.
Considering the general view that different odorant-receptor specificities are mapped onto different areas of the olfactory bulb (Ressler et al. 1994; Mombaerts et al. 1996; Fuss & Korsching, 2001; Nikonov & Caprio, 2001), it should be expected that the projection area of amino acid-sensitive ORNs is not congruent with the projection area of forskolin-sensitive ORNs. We tested this hypothesis using calcium-imaging of the postsynaptic population of olfactory bulb neurons, while applying forskolin (100 μm) or amino acids (100 μm) to the olfactory mucosa. Using this method we were able to monitor changes in the somatic [Ca2+]i in olfactory bulb neurons. We used a mix of 15 amino acids (see Methods). Figure 6A-F shows representative examples of calcium responses in mitral and granule cells in response to stimulation with amino acids (shown in red) and forskolin (shown in green). The spatial distributions of olfactory bulb neurons that responded to amino acids and forskolin were clearly different and showed very little overlap (Fig. 6C-E). The majority of olfactory bulb neurons responding to stimulation of the olfactory mucosa with the mixture of amino acids were always located in the lateral half of the olfactory bulb (n = 33 slices), whereas the population of neurons responding to forskolin was located in the medial half of the olfactory bulb (n = 8 slices). In cases where both stimuli were used in the same preparation, less than 5 % of the neurons responded to both stimuli (n = 8 slices). These neurons were located at an intermediate position (Fig. 6F). The time courses of calcium responses to amino acids and forskolin were very similar with a steep increase in intracellular calcium after stimulus onset followed by a plateau and a slow decrease outlasting the stimulus application. Figure 6G and H shows three representative time courses of [Ca2+]i in neurons within the mitral cell layer upon stimulation with amino acids and forskolin.
Figure 6. Comparison of changes of [Ca2+]i in olfactory bulb neurons in response to stimulation of the olfactory mucosa with amino acids and forskolin.
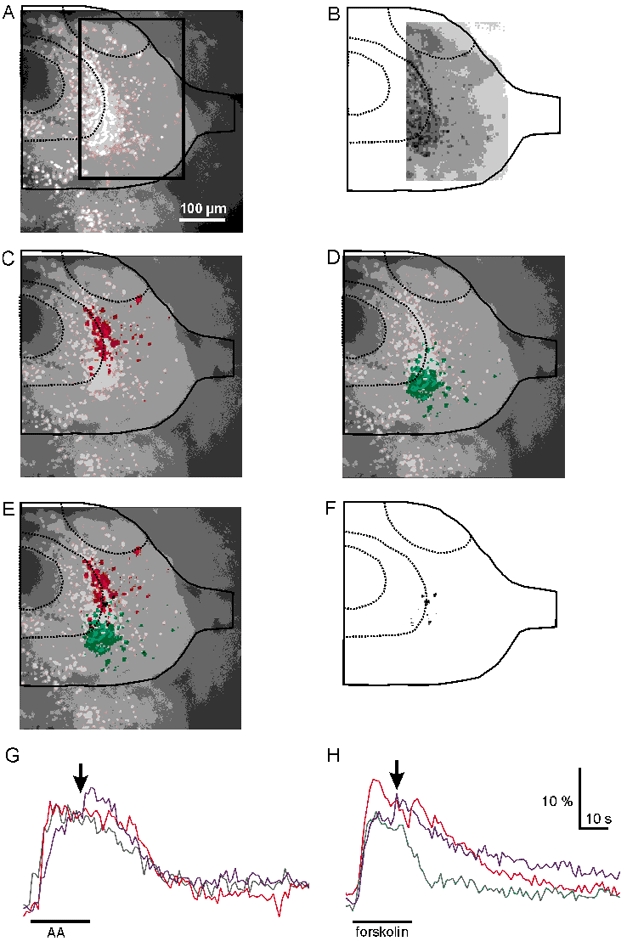
A, fluorescence image (excitation at 380 nm) of the olfactory bulb of a tadpole (stage 51) with outlines indicating the borders of the olfactory bulb, olfactory nerve, ventricle and the approximate borderlines between the mitral and granule cell layers and of the accessory olfactory bulb. Cell bodies of mitral and granule cells exhibit bright fluorescence. The box indicates the region of interest used for calcium imaging. B, ratio image at the time t + 0 s. C and D, spatial response patterns to stimulation with amino acids (100 μm, C, in red) and forskolin (100 μm, D, in green) expressed as stimulus-induced ratio changes. For identification of the location of olfactory bulb neurons, the ratio changes were superimposed on the fluorescence image shown in A. E, superimposed images of the responses to amino acids and forskolin. F, areas of overlap between the responses to stimulation with amino acids and forskolin. Note that only a small subset of neurons responded to both stimuli. G and H, time courses of calcium responses (expressed as ratio changes) in olfactory bulb neurons in the mitral cell layer to stimulation with amino acids (G) and forskolin (H). Three representative examples are shown in each case. The arrows indicate the time chosen for the spatial response patterns shown in the images in panels C -F.
Though it was clear at this point of our study that the map of amino acid-sensitive ORNs upon the olfactory bulb differed from that of forskolin-sensitive ORNs, there was still an uncertainity as to whether forskolin, particularly at the high concentrations used, acted by activating adenylate cyclase. In addition to or instead of its effect upon adenylate cyclase, forskolin might have acted as an odorant. To remove this ambiguity we tested, in addition to forskolin (50 or 100 μm), the effects of IBMX (500 μm), and pCPT-cAMP (2.5 mm). The neurons activated by forskolin were also activated by IBMX and pCPT-cAMP (Fig. 7). The overlap with the neuron ensemble activated by amino acids was as small as that described above, though slightly higher for pCPT-cAMP. In the 12 slices tested the overlap was less than 5 % for forskolin or IBMX and less than 9 % for pCPT-cAMP.
Figure 7. Comparison of [Ca2+]i responses in olfactory bulb neurons upon stimulation of the olfactory mucosa with amino acids, forskolin, IBMX and pCPT-cAMP.
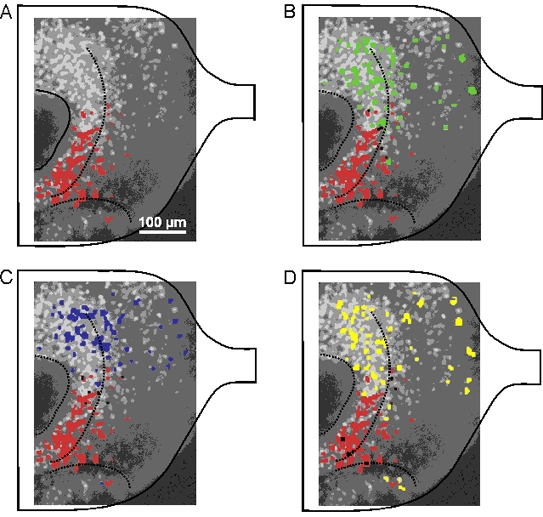
Background in A-D is as in the preceding figure. A, [Ca2+]i activation pattern in response to the mixture of amino acids (100 μm, shown in red) superimposed on the background image. B-D, [Ca2+]i activation patterns in response to forskolin (50 μm, B, green), IBMX (500 μm, C, blue) and pCPT-cAMP (2.5 mm, D, yellow) were superimposed on the image shown in A. The areas of overlap are shown in black.
Discussion
Amino acid responses
Amino acids are known to be olfactory stimuli in Xenopus laevis (Vogler & Schild, 1999; Iida & Kashiwayanagi, 2000). Regarding the responses to single amino acids, Table 2 shows that some ORNs (5 out of 11) responded to one amino acid, while others responded to amino acids of one or more groups. This nicely confirms the classification of ORNs in fish by Caprio & Byrd (1984), which was set up by cross-adaptation experiments. In their study, responses to l-histidine were correlated with responses to the LCN group of amino acids, a correlation also seen in Table 2 (cell No. 3).
It was not the aim of this study to analyse specificity profiles of tadpole ORNs in more detail, though extending Table 2 to a complete set of response patterns is a tempting idea. However, using the patch-clamp technique this would presumably require thousands of experiments given the huge number of parameters (i.e. number of possible stimuli, different concentrations, number of receptors proteins, possibility of more than one receptor per cell…). Other methods, in particular optical imaging techniques, allowing the recording of many cells simultaneously, are more promising in this respect.
Lack of correlation between responses to amino acids and to pharmacological agents activating the cAMP transduction pathway
The cAMP-mediated olfactory pathway can be activated in various odorant-independent ways, e.g. by dialysis of cAMP through a patch pipette into the cytosol (e.g. Iida & Kashiwayanagi, 2000), or by application of forskolin (e.g. Frings & Lindemann, 1991), IBMX (e.g. Kashiwayanagi & Kurihara, 1995; Zufall et al. 2000) or pCPT-cAMP (e.g. Kashiwayanagi & Kurihara, 1995; Reisert & Matthews, 2001) to the bath solution.
In our patch-clamp experiments about 40 % of the ORNs that responded to amino acids were also excited by forskolin, which is consistent with cAMP-mediated olfactory transduction. Further, it was not unexpected that forskolin excited some ORNs that were not excited by amino acids. In these cases amino acids were not the appropriate stimuli. Interestingly, however, 7 out of 12 ORNs (about 60 %) that responded to amino acids were not sensitive to forskolin (Fig. 5C). In these cases, the odorants activated a cAMP-independent olfactory pathway. Thus, amino acid transduction is probably not a subset of cAMP-dependent transduction.
To support this evidence we investigated the projection of olfactory stimuli to the olfactory bulb and analysed the [Ca2+]i response patterns in mitral and granule cells upon stimulation with amino acids, on the one hand, and with forskolin, IBMX or pCPT-cAMP, on the other. Olfactory bulb neurons responding to amino acids preferentially were located in the lateral half of the olfactory bulb, indicating that glomeruli in the lateral olfactory bulb process information about amino acids. Interestingly, a projection of amino acid-sensitive ORNs to a cluster of glomeruli in the lateral olfactory bulb has also been observed in imaging studies in the zebra fish olfactory bulb (Friedrich & Korsching, 1997).
Few olfactory bulb neurons in Xenopus laevis showed a response to stimulation with both amino acids and pharmacological agents that activate the cAMP-mediated transduction pathway. On the other hand, the relatively large number of neurons responding to stimulation with forskolin, IBMX or pCPT-cAMP suggests that there is a significant number of ORNs responding to as yet unknown odorants mediated by the cAMP transduction pathway. Forskolin activated virtually the same ensemble of olfactory bulb neurons as IBMX and pCPT-cAMP did. Forskolin, therefore, did not appear to act as an odorant. We can instead conclude that axons of ORNs responsive to cAMP-mediated stimuli project to glomeruli in the medial region of the olfactory bulb.
The pCPT-cAMP-sensitive neuron ensemble and the amino acid-sensitive ensemble showed a larger overlap than the forskolin- or IBMX-sensitive ensemble with the amino acid-sensitive ensemble. This is possibly due to pCPT-cAMP acting, in addition to the effect upon the adenylate cyclase, as an odorant in Xenopus laevis tadpoles. Nucleotides are known to be important olfactory stimuli in fish (Kang & Caprio, 1995). We did not analyse this possibility here.
In summary, forskolin, IBMX and pCPT-cAMP, on the one hand, and amino acids, on the other, induce very distinct and almost exclusive spatial patterns of neuronal activity in the olfactory bulb. This clearly shows that cAMP-mediated responses and responses to amino acids are transduced, processed and mapped differentially.
Acknowledgments
We thank Arne Gennerich for assembling the fluorescence excitatory pathway and the monochromator.
References
- Boekhoff I, Michel WC, Breer H, Ache BW. Single odors differentially stimulate dual second messenger pathways in lobster olfactory receptor cells. Journal of Neuroscience. 1994;14:3304–3309. doi: 10.1523/JNEUROSCI.14-05-03304.1994. [DOI] [PMC free article] [PubMed] [Google Scholar]
- Boekhoff I, Tareilus E, Strotmann J, Breer H. Rapid activation of alternative second messenger pathways in olfactory cilia from rats by different odorants. EMBO Journal. 1990;9:2453–2458. doi: 10.1002/j.1460-2075.1990.tb07422.x. [DOI] [PMC free article] [PubMed] [Google Scholar]
- Buck L, Axel R. A novel multigene family may encode odorant receptors: a molecular basis for odor recognition. Cell. 1991;65:175–187. doi: 10.1016/0092-8674(91)90418-x. [DOI] [PubMed] [Google Scholar]
- Caprio J, Byrd RP. Electrophysiological evidence for acidic, basic, and neutral amino acid olfactory sites in the catfish. Journal of Geneneral Physiology. 1984;84:403–422. doi: 10.1085/jgp.84.3.403. [DOI] [PMC free article] [PubMed] [Google Scholar]
- Edwards FA, Konnerth A, Sakmann B, Takahashi T. A thin slice preparation for patch-clamp recordings from neurones of the mammalian central nervous system. Pflügers Archiv. 1989;414:600–612. doi: 10.1007/BF00580998. [DOI] [PubMed] [Google Scholar]
- Freitag J, Krieger J, Strotmann J, Breer H. Two classes of olfactory receptors in Xenopus laevis. Neuron. 1995;15:1383–1392. doi: 10.1016/0896-6273(95)90016-0. [DOI] [PubMed] [Google Scholar]
- Friedrich RW, Korsching SI. Combinatorial and chemotopic odorant coding in the zebrafish olfactory bulb visualized by optical imaging. Neuron. 1997;18:737–752. doi: 10.1016/s0896-6273(00)80314-1. [DOI] [PubMed] [Google Scholar]
- Frings S, Lindemann B. Current recording from sensory cilia of olfactory receptor cells in situ. I. The neuronal response to cyclic nucleotides. Journal of General Physiology. 1991;97:1–16. doi: 10.1085/jgp.97.1.1. [DOI] [PMC free article] [PubMed] [Google Scholar]
- Fuss SH, Korsching SI. Odorant feature detection: activity mapping of structure response relationships in the zebrafish olfactory bulb. Journal of Neuroscience. 2001;21:8396–8407. doi: 10.1523/JNEUROSCI.21-21-08396.2001. [DOI] [PMC free article] [PubMed] [Google Scholar]
- Gold GH. Controversial issues in vertebrate olfactory transduction. Annual Review of Physiology. 1999;61:857–871. doi: 10.1146/annurev.physiol.61.1.857. [DOI] [PubMed] [Google Scholar]
- Iida A, Kashiwayanagi M. Responses of Xenopus laevis water nose to water-soluble and volatile odorants. Journal of General Physiology. 1999;114:85–92. doi: 10.1085/jgp.114.1.85. [DOI] [PMC free article] [PubMed] [Google Scholar]
- Iida A, Kashiwayanagi M. Responses to putative second messengers and odorants in water nose olfactory neurons of Xenopus laevis. Chemical Senses. 2000;25:55–59. doi: 10.1093/chemse/25.1.55. [DOI] [PubMed] [Google Scholar]
- Kandel ER, Schwartz JH, Jessell TM. Principles of Neural Sciences. 4. New York: McGraw-Hill; 2000. chap. 15. [Google Scholar]
- Kang J, Caprio J. In vivo responses of single olfactory receptor neurons in the channel catfish, Ictalurus punctatus. Journal of Neurophysiology. 1995;73:172–177. doi: 10.1152/jn.1995.73.1.172. [DOI] [PubMed] [Google Scholar]
- Kang J, Caprio J. In vivo responses of single olfactory receptor neurons of channel catfish to binary mixtures of amino acids. Journal of Neurophysiology. 1997;77:1–8. doi: 10.1152/jn.1997.77.1.1a. [DOI] [PubMed] [Google Scholar]
- Kashiwayanagi M, Kurihara K. Odor responses after complete desensitation of the cAMP-dependent pathway in turtle olfactory cells. Neuroscience Letters. 1995;193:61–64. doi: 10.1016/0304-3940(95)11667-l. [DOI] [PubMed] [Google Scholar]
- Michel WC, Ache BW. Odor-evoked inhibition in primary olfactory receptor neurons. Chemical Senses. 1994;19:11–24. doi: 10.1093/chemse/19.1.11. [DOI] [PubMed] [Google Scholar]
- Mombaerts P, Wang F, Dulac C, Chao SK, Nemes A, Mendelsohn M, Edmondson J, Axel R. Visualizing an olfactory sensory map. Cell. 1996;87:675–686. doi: 10.1016/s0092-8674(00)81387-2. [DOI] [PubMed] [Google Scholar]
- Nezlin LP, Schild D. Structure of the olfactory bulb in tadpoles of Xenopus laevis. Cell and Tissue Research. 2000;302:21–29. doi: 10.1007/s004410000208. [DOI] [PubMed] [Google Scholar]
- Nieuwkoop PD, Faber J. Normal Table of Xenopus laevis. Amsterdam: North Holland Company; 1956. Daudin. [Google Scholar]
- Nikonov AA, Caprio J. Electrophysiological evidence for a chemotopy of biologically relevant odors in the olfactory bulb of the channel catfish. Journal of Neurophysiology. 2001;86:1869–1876. doi: 10.1152/jn.2001.86.4.1869. [DOI] [PubMed] [Google Scholar]
- Reisert J, Matthews HR. Responses to prolonged odour stimulation in frog olfactory receptor cells. Journal of Physiology. 2001;534:179–191. doi: 10.1111/j.1469-7793.2001.t01-1-00179.x. [DOI] [PMC free article] [PubMed] [Google Scholar]
- Ressler KJ, Sullivan SL, Buck LB. Information coding in the olfactory system: evidence for a sterotyped and highly organized epitope map in the olfactory bulb. Cell. 1994;79:1245–1255. doi: 10.1016/0092-8674(94)90015-9. [DOI] [PubMed] [Google Scholar]
- Restrepo D, Miyamoto T, Bryant BP, Teeter JH. Odor stimuli trigger influx of calcium into olfactory neurons of the channel catfish. Science. 1990;249:1166–1168. doi: 10.1126/science.2168580. [DOI] [PubMed] [Google Scholar]
- Schild D. A computer-controlled device for the application of odours to aquatic animals. Journal of Electrophysiological Techniques. 1985;12:71–79. [Google Scholar]
- Schild D, Gennerich A, Schultens HA. Microcontrollers as inexpensive pulse generators and parallel processors in electrophysiological experiments. Medical and Biological Engineering and Computing. 1996;34:305–307. doi: 10.1007/BF02511243. [DOI] [PubMed] [Google Scholar]
- Schild D, Restrepo D. Transduction mechanisms in vertebrate olfactory receptor cells. Physiological Reviews. 1998;78:429–466. doi: 10.1152/physrev.1998.78.2.429. [DOI] [PubMed] [Google Scholar]
- Sklar PB, Anholt RR, Snyder SH. The odorant-sensitive adenylate cyclase of olfactory receptor cells. Differential stimulation by distinct classes of odorants. Journal of Biological Chemistry. 1986;261:15538–15543. [PubMed] [Google Scholar]
- Vogler C, Schild D. Inhibitory and excitatory responses of olfactory receptor neurons of Xenopus laevis tadpoles to stimulation with amino acids. Journal of Experimental Biology. 1999;202:997–1003. doi: 10.1242/jeb.202.8.997. [DOI] [PubMed] [Google Scholar]
- Zufall F, Leidners-Zufall T, Greer CA. Amplification of odor-induced Ca2+ transients by store-operated Ca2+ release and its role in olfactory signal transduction. Journal of Neurophysiology. 2000;83:501–512. doi: 10.1152/jn.2000.83.1.501. [DOI] [PubMed] [Google Scholar]
- Zufall F, Munger SD. From odor and pheromone transduction to the organization of the sense of smell. Trends in Neurosciences. 2001;24:191–193. doi: 10.1016/s0166-2236(00)01765-3. [DOI] [PubMed] [Google Scholar]


