

Abstract
Restitution of single-cell defects, a frequent event in epithelia with high turnover, is poorly understood. Morphological and functional changes were recorded, using intravital time-lapse video microscopy, confocal fluorescence microscopy, and conductance scanning techniques. After artificial single-cell loss from an HT-29/B6 colonic cell monolayer, the basal ends of adjacent cells extended. Concurrently, the local conductive leak associated with the defect sealed with an exponential time course (from 0.48 ± 0.05 μS 2 min post lesion to 0.17 ± 0.02 μS 8 min post lesion, n = 17). Between 3 and 10 min post lesion, a band of actin arose around the gap, which colocalized with a ring of ZO-1 and occludin. Hence, tight junction proteins bound to the actin band facing the gap, and competent tight junctions assembled in the adjoining cell membranes. Closure and sealing were inhibited when actin polymerization was blocked by cytochalasin D, delayed following decrease of myosin-ATPase activity by butanedione monoxime, and blocked after myosin light chain kinase inhibition by ML-7. The Rho-associated protein kinase inhibitor Y-27632 did not affect restitution. After loosening of intercellular contacts in low Ca2+ Ringer solution, the time course of restitution was not significantly altered. Albeit epithelial conductivity was 12-fold higher in low Ca2+ Ringer solution than in controls, under both conditions the repaired epithelium assumed the same conductivity as distant intact epithelium. In conclusion, epithelial restitution of single-cell defects comprises rapid closure by an actinomyosin ‘purse-string’ mechanism and simultaneous formation of a functional barrier from tight junction proteins also associated with the purse string.
Under normal as well as under pathophysiological conditions there are manifold challenges to the barrier function of epithelia. The gastrointestinal tract is exposed to toxic or traumatizing ingredients of foods, drugs and the bacterial flora. If impaired, epithelial integrity must be restored (Dignass, 2001) or inflammations may arise (Gitter et al. 2001). Repair of extensive and deep mucosal wounds (healing) requires regeneration of epithelial and other cells by mitotic proliferation. This process takes several days and is accompanied by an inflammatory response. Superficial defects are mainly covered by the flattening and migration of viable epithelial cells from areas adjacent to the injury, a process called restitution (Silen & Ito, 1985).
Restitution after macroscopic damage, as inflicted by cutting an epithelium with a razor blade, and modulation of its repair by cytokines has been investigated predominantly in cell lines (Dignass & Podolsky, 1993). Viable epithelial cells move into the defect from areas near the injured surface as shown by morphometry. In addition, the re-establishment of barrier function can be monitored by measurement of the overall electrical conductivity in conventional Ussing chamber systems. Owing to a large defect area, this process of restitution takes many hours. Using the colonic cell line Caco-2, Bement et al. (1993) investigated the restitution of irregular stab wounds of ≈100 μm or less (one to eight cell diameters). They show that morphological closure of very small defects is driven by a band of actin and myosin-II in a process called purse string contraction, first described by Martin & Lewis (1992). These defects were caused by the loss of several cells, and restitution took hours.
Little is known about epithelial restitution after the loss of a single cell, although it may be a frequent event in the intestine. Because it is rarely found in tissue sections, it must be assumed to be quickly accomplished. Moreover, if single-cell lesions are studied, it is not sufficient to observe the morphological closure of the gap; rather the functional sealing of the conductive leak must be considered. Owing to the difficulties in determining the local leak, which does not show in recordings of the overall epithelial permeability by means of conventional Ussing chamber systems, there is, apart from the present, but one investigation on the functional restitution following single-cell lesion. In Necturus gallbladder, Hudspeth assessed the leak and its tightening (Hudspeth, 1975, 1982) using a single microelectrode, which detected potential changes related to electrical current flowing through the lesion (Frömter & Diamond, 1972).
Herein we characterized, for the first time, mechanisms of restitution in induced single-cell defects. The process was investigated with HT-29/B6 cell monolayers, an established model of colonic epithelium (Kreusel et al. 1991). Time lapse intravital video microscopy and confocal fluorescence microscopy demonstrated that the defect was rapidly patched by flattening of the neighbouring intact cells, without migration of distant cells. Actin formed a purse string suture around the gap that, with myosin, pulled taut the edges and served as a base for new tight junction proteins, which also assembled between the extensions of the neighbouring cells closing the gap. Using a variant of the conductance scanning technique described previously (Gitter et al. 1997, 2000a), we were able to quantify the leak associated with a single-cell lesion and the time course of its sealing. Interestingly, restitution was not significantly impaired when the cellular junctions had been loosened by lowering the extracellular concentration of free Ca2+.
Methods
Cell culture
The Cl− and mucus secreting colonic cell line HT-29/B6 (28th-33rd passage) was cultured on Millicell-PCF support filters (PITP 01250, Millipore, Bedford, MA, USA) as described previously (Gitter et al. 2000b). In brief, the apical compartment of each support was filled with 0.5 ml culture medium; the basolateral compartment contained 10 ml. The medium (RPMI 1640, Biochrom KG, Berlin, Germany) contained 2 % stabilized l-glutamine and was supplemented with 10 % fetal bovine serum. Culture was performed at 37 °C in a 95 % air-5 % CO2 atmosphere. After 7 days, confluent monolayers were placed horizontally in a miniaturized Ussing chamber that was mounted on an upright light microscope. The exposed tissue area in the chamber was 0.28 cm2. Both half-chambers were continuously perfused with Ringer solution at a rate of 1.6 ml min−1 (at 37 °C and oxygenated with 95 % O2-5 % CO2). The composition of the solution was (mmol l−1): Na+ 140, Cl− 123.8, K+5.4, Ca2+ 1.2, Mg2+ 1.2, HPO42- 2.4, H2PO4− 0.6, HCO3− 21, d(+)-glucose 10, d(+)-mannose 10, glutamine 2.5, β-OH-butyrate 0.5; pH 7.4.
Treatments
Cytochalasin D and 2,3-butanedione monoxime were purchased from Sigma Chemical Co. (St Louis, MO, USA) and stock solutions were made with 2 × 10⁻³ mol l−1 cytochalasin in dimethyl sulphoxide and 0.5 mol l−1 butanedione monoxime in water (vigorously vortexed). The final concentrations used were 2 × 10⁶ mol l−1 (serosal) and 2 × 10⁻² mol l−1 (both sides of the epithelium), respectively. Control experiments showed that 0.1 % dimethyl sulphoxide did not affect epithelial resistance and the repair of single-cell lesions. ML-7 (1-(5-iodonaphthalen-1-sulphonyl)-1H-hexahydro-1,4-diazepine; Sigma Chemical Co., St Louis, MO, USA) was directly dissolved in cell culture medium containing 0.1 % bovine serum albumin at a concentration of 10−4 mol l−1. With this solution, cells were incubated for 4 h before the experiments in the conductance scanning set-up. The Rho-associated protein kinase inhibitor Y-27632 was purchased from Tocris Cookson Ltd, Bristol, UK, and a stock solution was prepared with 10−2 mol l−1 of Y-27632 in cell culture medium containing 0.1 % bovine serum albumin. Measurements were performed at a concentration of 10−5 mol l−1 on both sides of the epithelium. To produce low free extracellular calcium ([Ca2+]o) Ringer solution, a stock solution of 0.1 mol EGTA (pH 7.4 adjusted with NaOH) in water was added to regular Ringer solution, yielding 1.55 mmol l−1 of EGTA and 0.25 μmol l−1 of free Ca2+.
Time lapse video microscopy
The monolayer was viewed using an upright microscope with a water immersion objective lens (× 40, numerical aperture 0.75, working distance 1.9 mm; Zeiss, Oberkochen, Germany). Video images were taken during the electrophysiological recordings and were subsequently analysed on a personal computer (analySIS 3.0, Soft Imaging System, Münster, Germany). The time course of the morphological alterations was monitored during epithelial restitution, and was compared to the electrophysiological recordings.
Conductance scanning
Sinusoidal electric current (100 μA cm−2, 24 Hz) was clamped across the epithelium. Control experiments, as described previously (Gitter et al. 1997), excluded the possibility that the data were affected by amplitude or frequency of the alternating current applied.
The electric field (ΔV/Δz) generated in the mucosal bath solution was measured with a mobile probe positioned at a constant distance z0 above the mucosal surface (Fig. 1). This distance was readjusted, at every position of measurement, by lowering the probe until it barely touched the surface and then elevating it exactly 25 μm by means of a micromanipulator. The probe consisted of a pair of glass microelectrodes with tips set apart vertically by a distance Δz of 20-40 μm, and the current induced a voltage drop ΔV across Δz. For each probe, Δz was determined by measuring the resistance between both microelectrodes in a cylindrical bath chamber filled with saline of known resistivity ρ.
Figure 1. Illustration of the conductance scanning technique (not drawn to scale).
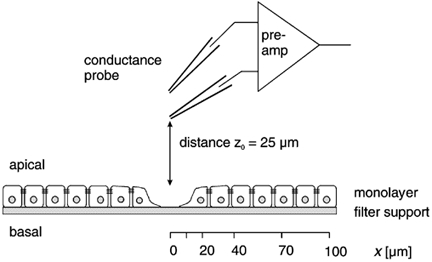
gleak, the conductance of the focal leak associated with a single-cell lesion, was determined as follows. Electric current (AC, 24 Hz) was imposed across the epithelium of HT-29/B6 cells. A probe, consisting of a mechanically coupled pair of microelectrodes, was moved (at a distance z0 to the surface) along the x axis (parallel to the surface), starting directly above the lesion. The potential difference at the probe (amplified with synchronous demodulation) is a measure of the local current density. Spatial integration and division by the transepithelial voltage yielded the conductance of the leak (gleak).
The apparent conductivity (GA) was calculated from the scanning signal (ΔV/Δz) applying the equation:
| (1) |
where ρ is the specific resistivity of the Ringer solution (53.7 Ω cm); and U is the transepithelial voltage, induced by the transepithelial electric current, which was measured by additional voltage electrodes in the serosal and the mucosal bath.
By scanning parallel to the epithelial surface, an area of at least 100 × 100 μm was chosen, where the spatial distribution of GA was even. This value represented the conductivity of the intact epithelium, Gintact. Then the probe was moved, parallel to the epithelial surface, along a line (x axis) from directly above the lesion (x + 0) to points at x + 10, 20, 40, 70 and 100 μm. Thus, assuming rotational symmetry of the leak current around the lesion, the spatial distribution of GA was measured. The assumption of rotational symmetry was validated by test measurements at other points. Moreover, the direction of the x axis was random, and any asymmetries would be averaged in the experiments.
Leak after single-cell lesion
To destroy a single cell, another glass microelectrode, filled with either 0.1 mol l−1 CaCl2 or 150 mmol l−1 KCl was used. The cell touched by the microelectrode flattened, and a current pulse (1.5 μA, 0.5 s) caused its lesion. Lesion and restitution were independent of the pipette solution. Purely mechanical destruction of a single cell was more difficult, but if successful, it delivered the same result. Thereafter, the glass microelectrode was retracted and the probe was advanced to the site of the lesion.
Single-cell lesion created a local leak, with an increased GA in close proximity. To record the time course of the leak current, the scan of GA along the x axis was repeated in intervals of 1-1.5 min. With these data, the conductance associated with a single leak was calculated by numerical integration of (GA - Gintact):
| (2) |
Between effecting the lesion and measurement of the associated leak, 2 min passed. Hence, the leak was determined between t + 2 min and t + 16 min. Under control conditions, the time course followed a simple exponential function and the magnitude of the fresh leak, gleak(t + 0), was estimated by extrapolation.
Immunofluorescence confocal microscopy
For fluorescence imaging of single-cell lesions, monolayers were stained according to two protocols. If not stated otherwise, the preparations were performed at room temperature.
Triple staining of ZO-1, occludin and nuclear DNA
Three, 6, 10, and 15 min after setting the lesion, cells were washed twice with phosphate-buffered saline (PBS) and fixed with methanol at −20 °C for 10 min. Cells were washed again in PBS and permeabilized with 0.5 % Triton X-100 in PBS for 5 min. To block non-specific binding sites, cells were then bathed in PBS containing 0.5 % (v/v) goat serum (blocking solution) for 30 min. All following washing procedures were performed with this blocking solution. Then the cells were incubated with a primary monoclonal antibody against ZO-1 (isotype: mouse IgG1, Transduction Laboratories, USA), diluted 1 : 50 in blocking solution, for 30 min. After two washes, cells were incubated with the primary polyclonal antibody against occludin (rabbit anti-occludin, Zymed Laboratories, Inc., San Francisco, CA, USA, diluted 1 : 50 in blocking solution) for 30 min. After two additional washes, cells were incubated with Alexa Fluor 488 goat anti-mouse IgG (Molecular Probes, Inc., USA, diluted 1 : 500 in blocking solution) for another 30 min and washed twice before incubating with Alexa Fluor 594 goat anti-rabbit IgG (Molecular Probes, Inc., USA, diluted 1 : 500 in blocking solution) for another 30 min. After two washes the nuclei were stained with the DNA-specific fluorochrome 4′,6′-diamidino-2′-phenylindoladihydrochloride (DAPI; Boehringer Mannheim, Germany), diluted according to the manufacturer's instructions, for 10 min, and washed again before mounting in ProTags MountsFluor (quartett Immundiagnostika und Biotechnologie GmbH, Berlin, Germany).
Double staining of ZO-1 and F-actin
Three and 10 min after setting the lesion, cells were washed twice with prewarmed PBS (37 °C), fixed with 1 % paraformaldehyde for 15 min, and incubated with PBS containing 25 mm glycine for 5 min, to inactivate the residual paraformaldehyde. After two additional washes with PBS, cells were permeabilized with 0.3 % Triton X-100 in PBS for 15 min. Non-specific binding sites were then blocked with 0.5 % (v/v) goat serum in PBS for 30 min. ZO-1 staining was carried out as described above, and subsequently phalloidin staining was performed with Alexa Fluor 594 phalloidin according to the manufacturer's instructions. Fluorescence images were taken with the Zeiss confocal microscope LSM510 (× 63 magnification, excitation wavelengths: 364, 488 and 543 nm).
Statistics
All conductivities are in reference to the gross tissue area. The values are given as means ± s.e.m. The significance of differences between corresponding control and test groups was evaluated using the Wilcoxon-Mann-Whitney U test (P > 0.05) with Bonferroni's correction for multiple testing.
Results
Morphology of single-cell restitution
Intravital time lapse video microscopy showed a confluent monolayer of approximately hexagonally arranged cells. A glass microelectrode was advanced towards a single cell in order to destroy it (e.g. Fig. 2A). The cell touched by the microelectrode flattened, and a current pulse caused its lesion. After the cell's destruction, a gap was visible containing membranous debris. The break in the continuity of the monolayer was closed by the enlargement of the adjacent cells, thus forming a rosette-like pattern with a diminishing centrepiece (Fig. 2B). This rosette pattern of epithelial cells is also seen with cells surrounding single apoptotic epithelial cells (Peralta Soler et al. 1996; Gitter et al. 2000a). In the intact epithelium the nuclei were not always at the basal end of the cells but are found at different levels. Loss of the nucleus from the defect of the destroyed cell was documented by staining with DAPI. As early as 3-6 min post lesion, the nucleus was observed at the surface of the monolayer (Fig. 3A6) or above (Fig. 3A5) the monolayer's surface.
Figure 2. Time-lapse video microscopy of the closure of a single-cell defect.
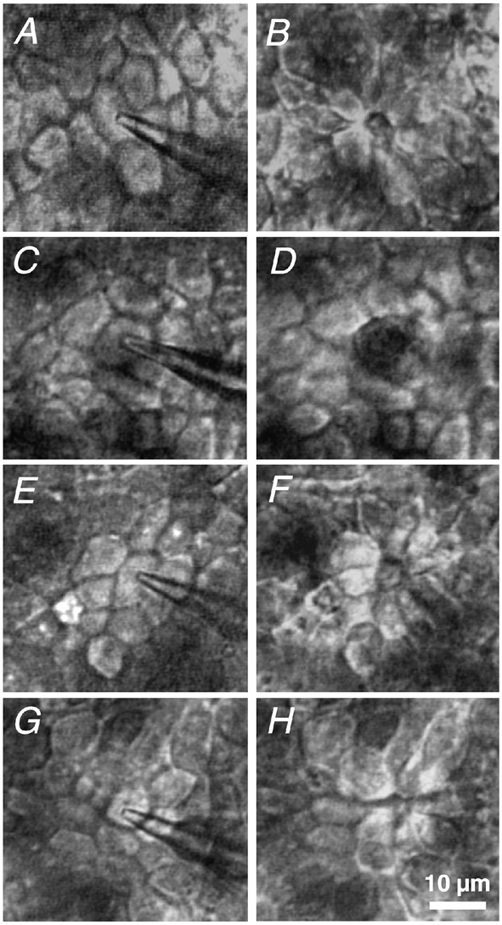
The intact HT-29/B6 monolayer immediately before setting the lesion (A, C, E and G) and about 10 min after it (B, D, F and H), as seen in the conductance scanning set-up. A and B, under control conditions; C and D, after incubation with cytochalasin D; E and F, with 2,3-butanedione monoxime; and G and H, in low free [Ca2+]o Ringer solution. Closure of the defect started below the surface (defined by the apical cell membranes). The difficulty in focusing the level of minimal defect area using conventional light microscopy was overcome by applying confocal fluorescence microscopy.
Figure 3. Confocal immunofluorescence microscopy of single-cell defects in HT-29/B6. Staining of tight junction elements (ZO-1 and occludin).
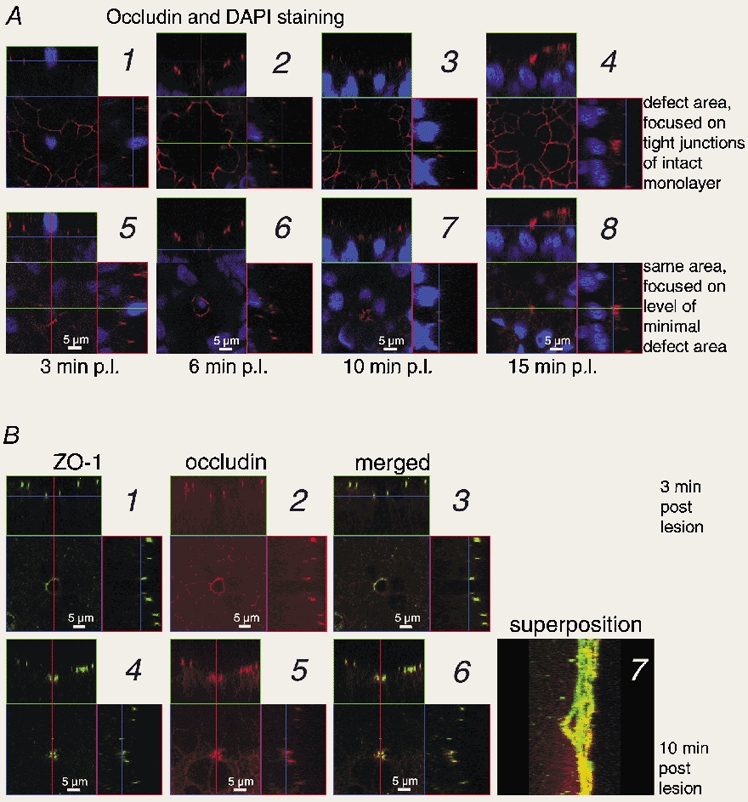
A, staining with occludin antibody (red) and DAPI (blue) at different times: images 1 and 5, 3 min post lesion (p.l.); 2 and 6, 6 min p.l.; 3 and 7, 10 min p.l.; 4 and 8, 15 min p.l. The quadratic images show x-y scans parallel to the epithelium. At the positions indicated by the green and red lines, x-z and y-z projections were computed (rectangular images on top and to the right of the quadratic image). In x-z and y-z planes, the blue lines indicate the level of the x-y plane. Images are focused on either the plane of tight junctions in the intact epithelium (1-4) or a parallel plane below, where the defect appeared minimal (5-8). In images 1 and 5, the confocal scanning range of the z axis was slightly smaller than in the others. See Movie 1 in Supplementary material. B, staining with ZO-1 and occludin antibodies, 3 (1-3) or 10 min (4-7) post lesion. In pictures 1-6, the arrangement of x-y, x-z and y-z planes is the same as above. 1 and 4 show ZO-1 (green), 2 and 5 show occludin (red), 3 and 6 show the merged images (yellow indicates colocalization). Images are focused on the plane where the defect appeared minimal. Image 7 shows a superposition of x scans in the y-z plane (with ZO-1 and occludin merged) for the defect 10 min p.l. The tight junction proteins delineate the funnel-like shape of the defect. For 3D-reconstruction see Movies 2-4 in Supplementary material.
Focusing at different planes in parallel to the surface, it was observed that during restitution first the basal ends of neighbouring cells extended into the defect, and they progressively adjoined with time. Intravital video microscopy depicted a 2-dimensional section through the defect, and the diameter of the gap seen in Fig. 2A-H depended not only on time but also on the plane of focus. A 3-dimensional image of the defect was achieved by staining of tight junction proteins that allowed their visualization by confocal laser scanning fluorescence microscopy. Thus cell borders were marked only in the presence of ZO-1 or occludin.
Figure 3A shows four samples (1: Fig. 3A1 and 3A5; 2: Fig. 3A2 and 3A6; 3: Fig. 3A3 and 3A5; 4: Fig. 3A4 and 3A8) fixed at different times post lesion and analysed by confocal fluorescence microscopy. We performed x-y scans parallel to the epithelium (quadratic image), and computed x-z projections at the indicated green line (rectangular image on top of the quadratic image), and y-z projections at the indicated red line (rectangular image to the right of the quadratic image). For clarity, in each sample the x-y scans were focused on (a) the plane of tight junctions in the intact epithelium surrounding the defect (Fig. 3A1-4), and (b) a parallel plane below, where the defect appeared minimal (Fig. 3A5-8). Tight junctions were stained with occludin antibody and, in addition, nuclei were stained with DAPI.
The x-y scans focused on the plane of tight junctions in the intact epithelium surrounding the defect (Fig. 3A1-4) delineate a network of tight junctions with a gap at the site of the lesion (see Movie 1 in Supplementary material at the end of this paper). This area without tight junctions appeared larger 6 min post lesion than 3 min post lesion (Fig. 3A1 and 3A2). Additional scans in different planes, as shown in the movies (see Supplementary material); these movies demonstrate that the effect was caused by the lower apical surface of the flattening cells around the defect. With proceeding restitution, this hollow levelled off (Fig. 3A3 and 3A4).
In the second series of x-y scans (Fig. 3A5-8) we tried to focus on a plane, where the defect appeared minimal. The choice was not arbitrary, because only part of the cell membranes facing the defect contained the tight junction proteins with a fluorescent mark. Three minutes post lesion, most samples exhibited few, if any, fragments of occludin (Fig. 3A5). Later, occludin was regularly found, but more or less limited to a band in the membranes facing the defect, several micrometres below the epithelial surface (Fig. 3A6-8). Hence, the visible outline of the defect was close to, but not exactly at, the plane with a minimal defect area.
Focusing on different x-y planes allowed reconstruction of the 3-dimensional shape of the defect as a hollow cone-shaped lacuna or funnel-like gap. The profile was outlined in x-z and y-z planes, which were performed at the indicated lines (Fig. 3A). The profile of the defect was least complete early, i.e. 3 min post lesion (Fig. 3A1 and 3A5), because then the defect exhibited only few tight junction proteins. At this time, the diameter of the gap at the basal end was about 4-5 μm, and only the direct neighbouring cells of the defect were visibly flattened. A more complete profile of the cone-shaped lacuna became obvious 6 min post lesion (Fig. 3A2 and 3A6, and Movie 2 in Supplementary material) and was evident during the whole time of recording. More cells around the defect (up to 4 cell diameters distant) flattened between 3 and 15 min post lesion, although the effect decreased with distance from the defect. The diameter of the gap was 3-4 μm at 6 min post lesion. After 10 min the defect was almost closed at its basal end (gap diameter ≈1 μm), and only a small aperture remained in the centre of condensed occludin staining of adjacent cells (Fig. 3A7 and Movie 3 in Supplementary material). Finally, the single-cell defect appeared to be closed 15 min post lesion (Fig. 3A8 and Movie 4 in Supplementary material). Defect closure was led by the basal ends of adjoining cells and the apical ends followed (Fig. 3A1-8 and Movies 3 and 4).
Colocalization of ZO-1 and occludin
Using confocal fluorescence microscopy, the distribution of peripheral and integral tight junction proteins, ZO-1 and occludin, was investigated in the same samples with a fresh defect (3 min post lesion, Fig. 3B1-3) or after advanced restitution (10 min post lesion, Fig. 3B4-7). In the x-y scans shown in Fig. 3B1-3 and 3B4-6, we again tried to focus on a plane, where the defect appeared minimal (cf. Fig. 3A5-8). As described above (for Fig. 3A), we computed x-z projections at the indicated green line, and y-z projections at the indicated red line (Fig. 3B1-3 and 3B4-6). To demonstrate colocalization of ZO-1 (Fig. 3B1 and 3B4) and occludin (Fig. 3B2 and 3B5), the images were merged (Fig. 3B3 and 3B6, respectively).
In the fresh defect (3 min post lesion), the neighbouring cell membranes facing the defect contained usually only few or no fragments of tight junction proteins (Fig. 3A5 and Fig. 4, image 1). For clear demonstration of the defect, we show in Fig. 3B1-3 a sample with most tight junction proteins around the gap. With advanced restitution (10 min post lesion), a ring of tight junction proteins was usually observed and a typical example is shown in Fig. 3B4-6. In all samples (3 or 10 min post lesion) the overlay of ZO-1 and occludin demonstrates colocalization of peripheral and integral tight junction proteins (Fig. 3B3 and 3B6).
Figure 4. Immunofluorescence staining of ZO-1 and F-actin.

Cells were analysed with ZO-1 antibody (green) and Alexa Fluor 594-phalloidin (red) for F-actin at 3 min (1-3) and 10 min (4-6) p.l. Images 1 and 4, ZO-1; 2 and 5, F-actin; 3 and 6 merged images of ZO-1 and F-actin staining. The arrangement of images (x-y, x-z, y-z planes) is the same as in Fig. 3. The scale bar (10 μm) applies to all images. (m: damage caused by marks indicating the position of the defect investigated. The mark consisted of lines in a right-angled pattern that were scratched into the monolayer with a microelectrode.)
To visualize the defect in space, we produced a 3-dimensional reconstruction by superposition of optical sections showing the tight junction proteins. The picture was generated by rotating an x-y plane around a y axis through the defect. This 3-D reconstruction (with ZO-1 and occludin merged) is shown for the defect 6 min post lesion (Movie 2), 10 min post lesion (Fig. 3B8 and Movie 3) and 15 min post lesion (Movie 4). In the fresh defect (3 min post lesion) the defect could not be shown, because the ring of tight junction proteins was absent, and 6 min post lesion the ring of tight junction proteins was hardly visible at the bottom of the defect (Movie 2). With advanced restitution, 10 or 15 min min post lesion (Movies 3 and 4), the ring of tight junction proteins around the defect became obvious. Ten minutes post lesion the ring encloses a visible gap (Movie 3), but 15 min post lesion it seemed to be closed (Movie 4). In addition to the ring around the defect, the images comprise the tight proteins between intact cells.
Distribution of ZO-1 and actin
The distribution of actin, as compared to ZO-1, was also investigated in samples with a fresh defect (3 min post lesion, Fig. 4, images 1-3) or after advanced restitution (10 min post lesion, Fig. 4, images 4-6). The x-y, x-z and y-z planes shown in Fig. 4, images 1-3 and images 4-6 were produced in the same way as those in Fig. 3B1-3 and 3B4-6, respectively (vide supra). In intact epithelium surrounding the defect, ZO-1 and actin were found where vertical sections meet the tight junctions (x-z and y-z planes of Fig. 4, images 2 and 5). Although the intracellular distribution of actin was somewhat diffuse, at the tight junctions it colocalized with ZO-1 (x-z and y-z planes of Fig. 4, images 3 and 6).
As was the case for tight junction proteins (Fig. 3A5 and Fig. 4, image 1), only fragments of actin, if any, were found in the cell membranes facing the fresh defect, 3 min post lesion (Fig. 4, image 2). In contrast to the fresh defect, a ring of ZO-1 and a broad band of actin were observed around the defect 10 min post lesion (Fig. 4, image 5, note the x-z and y-z planes). The tight junction proteins colocalized with the actin band, but the latter exceeded the smaller ring of tight junction proteins (Fig. 4, image 5, note the x-z and y-z planes). The actin ring facing the defect appeared more dense at its basal than its apical end (Fig. 4, image 5, x-z plane).
This cytoskeletal structure and the absence of lamellipodial extensions provided morphological evidence of an actin-based ‘purse string’ with associated tight junction proteins, as described in the restitution of stab wounds in Caco-2 intestinal epithelial cells (Bement et al. 1993). Functional evidence is conveyed below. In contrast to (Bement et al. 1993), we observed that the basal, rather than the apical, end of the adjacent cells led into the defect.
Morphology after impairment of the cytoskeleton and under low free [Ca2+]o
To address the mechanisms involved in the restitution, analysis of single-cell restitution by time lapse video microscopy was performed not only under control conditions (Fig. 2A and B), but also under cytochalasin D, butanedione monoxime and low free [Ca2+]o conditions (Fig. 2C-H). The process is shown in Fig. 2 before (A, C, E and G) and 10 min post lesion (B, D, F and H).
The putative role of the actinomyosin system was studied with specific blockers. After inhibition of actin polymerization, using 2 × 10⁻⁶ mol l−1 of cytochalasin D on the serosal side (Fig. 2C and D), the gap was still open 10 min post lesion, as seen by the dark area in the centre of Fig. 2D. After impairment of myosin ATPase activity, using 2 × 10⁻² mol l−1 of butanedione monoxime on both sides of the epithelium (Fig. 2E and F), only a part of the defect is closed 10 min post lesion (Fig. 2F). The morphological data correlate with the functional analysis described below (Fig. 7B and C). Taken together, the data indicate that the actin-myosin interaction is an essential part of the closing process.
Figure 7. Conductance of the leak, gleak, as a function of time associated with single-cell defects.
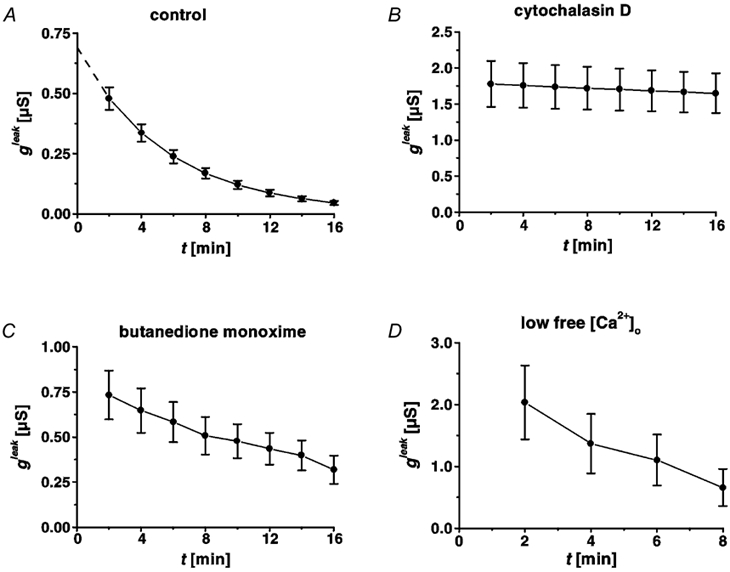
Time course of restitution in HT-29/B6 cells (28th-31st passage), under control conditions (A), after incubation with cytochalasin D (B), with 2,3-butanedione monoxime (C), and in low free [Ca2+]o Ringer solution (D). Under control conditions (A), repair resulted in exponential decline of gleak, which allowed extrapolation (dashed line) of the initial (t + 0) leak at 0.69 ± 0.06 μS. Sealing of the leak (described by gleak) was blocked after inhibition of actin polymerization (B), and was slower after impairment of myosin ATPases (C), but proceeded at the same speed in low Ca2+ Ringer solution (D).
In order to investigate the role of epithelial tightness, we opened the tight junctions with an established tool, low extracellular free calcium concentration, [Ca2+]o (Fig. 2G and H). Apart from the defect, epithelial integrity was intact, albeit less tight than under control conditions because of leaky cellular junctions (Gitter et al. 2000b). In low free [Ca2+]o Ringer solution, the typical rosette pattern of intact restitution was seen 10 min post lesion. Single-cell restitutions proceeded with the same morphology as under control conditions (Fig. 2H).
Functional characterization of regular restitution
When measured in conventional Ussing chambers, the epithelial monolayers had, under control conditions, an overall conductivity (GUssing) of 1.69 ± 0.02 mS cm−2 (n = 19), which remained constant over 12 h (Fig. 5A). Measurement of Gintact in non-apoptotic and undamaged epithelial areas, using the conductance scanning technique, yielded 1.29 ± 0.10 mS cm−2 (n = 17). This lower conductivity may reflect the absence of apoptotic leaks and edge damage encountered in conventional Ussing measurements.
Figure 5. Conductivity of HT-29/B6 monolayers measured in a conventional Ussing chamber as a function of time.
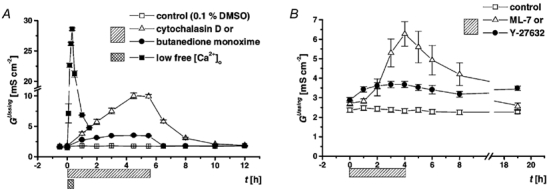
A, the time course was recorded under control conditions (n = 19) and the effects of cytoskeleton modulators, cytochalasin D (n = 10) or butanedione monoxime (n = 10), and low free extracellular calcium (250 nmol l−1, n = 8) were studied. With both inhibitors and under low free calcium, the increase of GUssing was reversible upon washout with regular Ringer solution. B, cells from a different passage (32nd-33rd) were analysed under control conditions (n = 14) and the effects of the myosin light chain kinase inhibitor ML-7 (n = 7), and the Rho-associated kinase inhibitor Y-27632 (n = 6) were studied. With the inhibitor ML-7, the increase of GUssing was reversible upon washout with regular Ringer solution, but the effect of Y-27632 was not.
The spatial distribution of epithelial conductivity was monitored with a microelectrode probe positioned 25 μm above the mucosal surface of epithelial areas without apoptotic rosettes or damage. At this distance to the surface, trans- and paracellular currents merged (Gitter et al. 1997). Accordingly, by moving the probe parallel to the surface, it was found that the spatial distribution of conductivity was even.
To quantify the repair of the functional leak associated with a single-cell lesion, the distribution of conductivity was repeatedly recorded after setting a single-cell lesion. The probe moved parallel to the epithelial surface, along a line (x axis) from directly above the lesion (x + 0) to points at x + 10, 20, 40, 70 and 100 μm, and the apparent conductivity, GA, was determined from the probe signal by means of eqn (1). In order to record the time course of the leak current, the scan along the x axis was repeated in intervals of 1.0-1.5 min. A typical recording is shown in Fig. 6. With these data, the conductance as a function of time, gleak(t), of the leak associated with the lesion was calculated by means of eqn (2). With this procedure, the first measurement of the leak was achieved about 2 min post lesion.
Figure 6. Distribution of the recorded signal, expressed as apparent conductivity GA, as a function of space (horizontal distance from lesion) and time (post lesion).
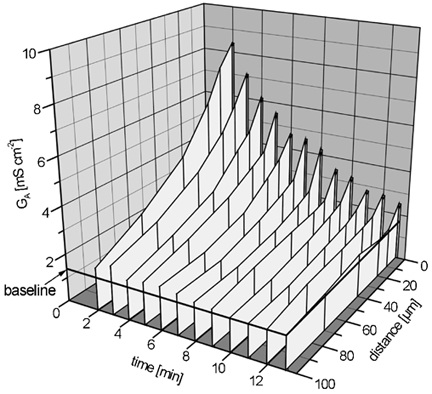
A typical experiment under control conditions is shown. The apparent conductivity (GA) is a normalized measure of the local current density. After positioning the probe above the lesion (produced at t + 0), the probe was repeatedly moved along the x axis, and measurements were taken at certain points of the x axis, with a constant distance z0 to the surface. By spatial integration of GA(x, t), the conductance of the leak, gleak, was determined as a function of time.
The magnitude of the leak, gleak, decreased exponentially with time, t (Fig. 7A). From 2 min post lesion (first measurement), to 8 min post lesion, the leak decreased by 66 % (from 0.48 ± 0.05 to 0.17 ± 0.02 μS, n = 17) in the first set of experiments (cells of passages 28-31). A single exponential fit revealed a time constant (τ) of 5.73 ± 0.35 min (n = 17). Extrapolation of the fit to t + 0 allowed an estimation of the initial leak (dashed line in Fig. 7A) at 0.69 ± 0.06 μS. In the second series of experiments (cells of passages 32-33), the leak decreased by 50 ± 6 % (n = 7) from 2 min post lesion (first measurement), to 8 min post lesion. The pooled results of the two series of experiments are shown in Table 1.
Table 1.
Conductivity of the intact epithelium and decrease of gleakbetween 2 and 8 min post lesion
| Control | Cytochalasin D | Butanedione monoxime | Low free[Ca2 +]o | ML-7 | Y-27632 | |
|---|---|---|---|---|---|---|
| Gintact (mS cm−2) | 1.38 ± 0.07 | 15.92 ± 4.55 *** | 3.02 ± 0.39*** | 15.27 ± 2.74 *** | 1.66 ± 0.14n.s. | 1.40 ± 0.09 n.s. |
| (gleak,2min −gleak,8min)/gleak,2min | 61 ± 3% | 3 ± 2%*** | 31 ± 3%*** | 74 ± 5%n.s. | 14 ± 3%*** | 66 ± 4%n.s. |
| n (m) | 24(23) | 7(5) | 10(6) | 7(5) | 8(8) | 8(7) |
Conductivity of intact epithelium, Gintac, apart from apoptosis or edge damage, was measured in the conductance scanning set-up before inflicting a lesion. The decrease in gleak, associated with a single-cell lesion, between 2 and 8 min post lesion was determined. n, number of leaks; m, number of monolayers. Wilcoxon-Mann-Whitney U test with Bonferroni's correction for multiple testing
P > 0.05
P < 0.002.
With time of repair, g decreased towards zero (Fig. 7A and Fig. 8A) and the repaired epithelium assumed a tightness similar to that of undisturbed epithelium. Thus, a control system of the junctional barrier must exist, working at least as rapidly as the morphological closure. Perfect sealing of the leak indicated the formation of new tight junctions with the same barrier property as those in the undisturbed epithelium.
Figure 8. Conductance of the leak, gleak, as a function of time associated with single-cell defects.
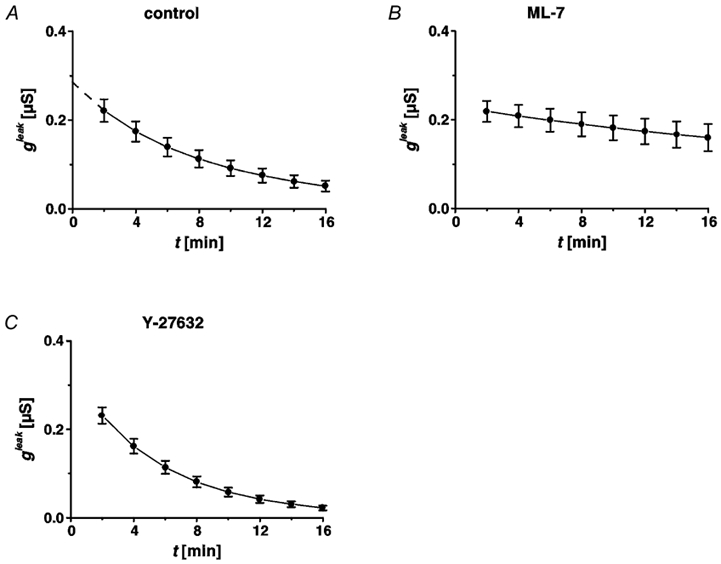
Time course of restitution in HT-29/B6 cells (32nd-33rd passage), under control conditions (A), after incubation with ML-7 (B) and with Y-27632 treatment (C). Under control conditions (A), repair resulted in exponential decline of gleak (n = 7). Sealing of the leak (described by gleak) was dramatically delayed after inhibition of myosin light chain kinase activity (n = 8), but proceeded at the same speed as controls after Y-27632 treatment (n = 8).
It is suggestive that the elongated cells covering the defect may have a smaller sum of circumferences than the original, hexagonal pattern of cells. Geometrical analysis shows, however, that the total length of cellular junctions does not differ between the area at a repaired defect and intact epithelial area (Fig. 9). Hence, comparison of the local conductivity of intact epithelium before and 16 min after single-cell lesion suggests formation of a similar type of tight junction.
Figure 9. Geometrical model of tight junction distribution during the repair of a single-cell lesion.
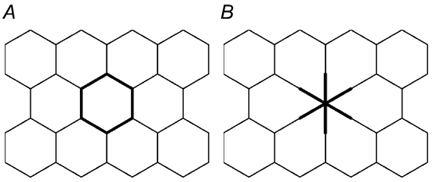
The sum of cell circumferences per epithelial area in an epithelium of hexagonal symmetry (A) does not change when a single cell is removed (B), because the loss of cellular junctions is compensated for by the extensions of the adjoining cells closing the defect, adding an equal length of cellular junctions.
Restitution after inhibition of cytoskeleton dynamics
Functional evidence of the mechanism of restitution by actin-dependent purse string contraction was achieved by inhibition of cytoskeleton dynamics and measurement of the leak conductance as a function of time.
Assembly of filamentous actin from globular actin monomers is blocked by cytochalasin D (Stevenson & Begg, 1994). With 2 × 10⁻⁶ mol l−1 in the serosal bath, the conductivity measured in conventional Ussing chambers increased from 1.80 ± 0.02 to 10.02 ± 0.50 mS cm−2 (n = 10) and reached a plateau within 4.5 h. After wash-out of the compound, using regular Ringer solution, the conductivity returned to control values (Fig. 5A). By conductance scanning, restitution of single-cell defects was investigated after 4-4.5 h of exposure to the drug. Both morphological closure (observed by intravital microscopy Fig. 2D) and sealing of the leak, were inhibited by cytochalasin D (Fig. 7B). The conductive leak (g) measured at t + 2 min post lesion was much larger than in controls and it did not decrease significantly within 16 min post lesion (Fig. 7B, Table 1).
The oxime derivative 2,3-butanedione 2-monoxime is a general inhibitor of myosin ATPases in muscle and non-muscle cells (Herrmann et al. 1992; McKillop et al. 1994). With 2 × 10⁻² mol l−1 on both sides, the conductivity measured in conventional Ussing chambers increased from 1.80 ± 0.03 to 3.52 ± 0.10 mS cm−2 (n = 10) and reached a plateau within 4.5 h. The effect was smaller if only 10−2 mol l−1 of the compound were applied (GUssing increased from 1.92 ± 0.02 to 2.20 ± 0.05 mS cm−2, n = 10), suggesting that it binds with low affinity. Upon wash-out with regular Ringer solution, the conductivity returned to control values (Fig. 5A). In the same procedure as with cytochalasin D, the effect of 2,3-butanedione 2-monoxime on the restitution of single-cell leaks was investigated after 4-41/2 h exposure to the drug. Conductance scanning showed that 4-16 min post lesion the leak was larger than in controls (Fig. 7C). Thus, closure of the morphological gap and sealing of the conductive leak were not inhibited, but slower than in controls (Fig. 7C, Table 1).
Additionally, we investigated the effect of a more specific inhibitor of actinomyosin interaction by blocking the myosin light chain kinase activity with ML-7. After a preincubation period of 4 h with 10−4 mol l−1 on both sides, the conductivity measured in conventional Ussing chambers increased from 2.71 ± 0.13 to 6.27 ± 0.63 mS cm−2 (n = 7) (Fig. 5B). The increase of GUssing was reversible upon washout with regular Ringer solution (Fig. 5B). Conductance scanning showed that 8-16 min post lesion the leak was larger than in controls. Sealing of the conductive leak was delayed (Fig. 8B, Table 1).
The Rho-associated kinase inhibitor Y-27632 (10−5 mol l−1 on both sides of the epithelium) caused an increase of epithelial conductivity measured in conventional Ussing chambers from 2.89 ± 0.13 to 3.68 ± 0.16 mS cm−2 (n = 6) after an incubation period of 4 h (Fig. 5B). The increase of GUssing was not reversible upon washout with regular Ringer solution in a time course of 19 h (Fig. 5B). Sealing of the conductive leak, measured with conductance scanning, was not delayed after Rho-associated kinase inhibition (Fig. 8C, Table 1).
Effect of leaky cellular junctions
Attachment of neighbouring epithelial cells and the sealing of the paracellular pathway require extracellular calcium, which binds to cadherins in the adherens junction (Collares-Buzato et al. 1994). When the extracellular free Ca2+ concentration in the serosal Ringer solution decreased from 1.2 mmol l−1 to 0.25 μmol l−1, the conductivity measured in conventional Ussing chambers increased from 1.50 ± 0.01 to 28.60 ± 0.20 mS cm−2 (n = 8) within 30 min. The increase in conductivity reversed towards control values, when the solution was exchanged with regular Ringer solution(Fig. 5A).
Restitution of single-cell defects was recorded by conductance scanning 10-30 min after perfusion with low Ca2+ Ringer solution. The value of conductivity of the intact epithelium (15.27 ± 2.74 mS cm−2, n = 7) showed a functional barrier of tight junctions in the paracellular pathway, albeit less tight than under control conditions. The conductance of the leak 2 min post lesion was significantly larger than in controls (Fig. 7D), possibly because cellular debris from the lesion was less adherent after the impairment of Ca2+-dependent cell-cell attachment. However, the time course of functional restitution was not significantly different from control conditions (Fig. 7D, Table 1).
Discussion
Epithelia constitute a barrier that is repaired after injury. Albeit inconspicuous, rapid repair of minor defects is a process considered essential for the maintenance of barrier function, e.g. in the colon (Wilson & Gibson, 1997). Any lesion in the mucosal surface opens a leak that permits the admission of potentially dangerous agents. Consequently, bacterial infection may arise via small defects, or inflammation may be elicited by the entry of small amounts of antigens. Hence, rapid resealing is also necessary for small leaks. Little is known, however, about the time course and mechanism of tightening a leak arising from the sudden loss of a single cell. Nor has it hitherto been possible to quantify the leak.
Rapid closure and sealing of the leak…
Although the transformed cell line, HT-29/B6, differs from native colonic crypt epithelium, it allowed the study of epithelial repair of single cell lesions without interference from non-epithelial cells. Furthermore, it is a well-established model and its functional characteristics have been analysed, e.g. secretion of mucus and chloride (Kreusel et al. 1991). Owing to its tight junctions (Schmitz et al. 1999), the conductivity of the paracellular pathway is only a fifth of the transcellular conductivity (Gitter et al. 2000b). This indicates an effective seal of the paracellular space by tight junctions.
We showed that restitution of single-cell defects in an intestinal epithelium occurs within minutes, much faster than the restitution of larger defects. Moreover, recovery of morphological integrity and functional resealing of the epithelial barrier occurred concomitantly. This correlation is controversially discussed in early studies on the repair of relatively extensive superficial injury. In human and rabbit colonic mucosa, cell flattening and lamellipodial formation is observed 15 and 30 min after injury in the rabbit and human colon, respectively. However, morphological repair is much faster than the return of the transmural potential difference, which does not recover within 5 h (Feil et al. 1989). On the other hand, during the ‘rapid’ (60 min) restitution of ileal mucosa, denuded by exposure to Triton X-100, structural restoration is paralleled by the recovery of epithelial barrier function (Moore et al. 1989).
…with a purse-string suture…
In undisturbed, intact epithelium, we observed an apical peripheral band of actin in all cells (Fig. 10A), but there was no evidence of larger actin bundles at the basal end of the cells (Stevenson & Begg, 1994). Restitution followed a certain pattern: after removal of a single cell from the epithelium, the neighbouring cells flatten at their basal ends and, after 3 min, actin appears near the cell membranes facing the defect (Fig. 10A). Up to this time, the spreading may be driven by the loss of a counterforce at the free margins of the cells advancing into the gap, because it is not inhibited by pharmacological perturbation of actinomyosin (with cytochalasin D or 2,3-butanedione 2-monoxime). Then, however, a continuous, circumferential band of actin forms around the defect (Fig. 10B). Visible closure of the gap as well as functional sealing (assayed by conductance scanning) are sensitive to inhibitors of cytoskeleton dynamics.
Figure 10. Restitution of single-cell defects in an epithelial monolayer.

In undisturbed intestinal epithelium, an intracellular perijunctional actin band is located adjacent to the apical junctional complex, which includes the tight junction. This actin, together with myosin II, is assumed to control the tight junction and thus paracellular conductivity (Turner, 2000). After the loss of a single cell, the cell membranes facing the gap lack these structures (A). However, the neighbouring cells flatten and their basal ends extend into the gap. A circumferential actinomyosin band forms that pulls taut the suture and serves as a base for new tight junction proteins (B). In addition, new tight junctions assemble rapidly, like a zipper being closed, between the extensions of the neighbouring cells closing in (cf. Fig. 9).
Cytochalasin D is a fungal drug which permeates cell membranes and binds with high affinity to the barbed end of actin filaments. Thus it inhibits association of subunits at that end and disrupts the organization of actin (Cooper, 1987). Cytochalasin reversibly inhibits epithelial cell migration (Gipson et al. 1982) and, therefore, it blocks restitution of larger defects in native intestinal epithelium (Albers et al. 1996). In our experiments, cells did not migrate. Nevertheless the drug, at a concentration of 2 × 10⁻⁶m in the serosal bath, blocked completely the restitution of single-cell epithelial lesions, because it inhibited morphological closure of the defect.
Restitution was decelerated by butanedione monoxime, a non-competitive inhibitor of myosin ATPases that is thought to stabilize a pre-powerstroke actin-myosin- ADP-Pi state (Zhao et al. 1995). The retardation in the extension of neighbouring cells filling the gap after single cell-lesion is comparable with the effect of butanedione monoxime on the spreading of postmitotic PtK2 cells (Cramer & Mitchison, 1995) and the formation of lamellipodia in elongating axons (Ruchhoeft & Harris, 1997). The incomplete inhibition of restitution may be due to low affinity binding. Although the compound also reduces the current through voltage-activated L-type Ca2+ channels (Ferreira et al. 1997), blockage of Ca2+ entry cannot explain the effect observed here, because in low free Ca2+ Ringer solution restitution is not significantly delayed. Furthermore, the compound does not interfere with actin polymerization (Cramer & Mitchison, 1995). We also examined the effects of the inhibitor of myosin light chain kinase, ML-7. Myosin light chain phosphorylation regulates contraction, secretion and cell motility in smooth muscle and non-muscle cells (Matsumura et al. 1999; Kaneko et al. 2002). In a concentration of 10−4 mol l−1, ML-7 blocked the restitution of the single-cell lesion (Fig. 8B). These results suggest that the force generated with myosin II, which drives healing in the border of larger epithelial wounds (Bement et al. 1993; Danjo & Gipson, 1998; Matsumura et al. 1998), is also required in rapid single-cell restitution.
While in our experiments ML-7 increased epithelial conductivity, other papers have shown that ML-7 reduces epithelial conductivity in intestinal epithelial cell lines (Turner et al. 1997; Ma et al. 2000). This is potentially explained by the high concentration of ML-7 used (100 μmol l−1). At this concentration, other kinases are probably also inhibited, since ML-7 inhibits myosin light chain kinase with a Ki of 300 nmol l−1 and also inhibits protein kinase A at a Ki of 21 μmol l−1 and protein kinase C with a Ki of 42 μmol l−1. It is possible that protein kinases A and C are responsible for the inhibition of wound sealing.
The small GTPase Rho is a regulator of cell motility, the perijunctional actin skeleton and the tight junctions (Hall, 1998; Jou et al. 1998; Wittmann & Waterman-Storer, 2001). Commercially available reagents that block its function are not membrane permeant, and therefore we did not investigate upstream Rho function. In experiments with temporarily leaky cells, however, Rho inhibition by C3 exotransferase impairs purse-string healing of multicellular skin wounds (Brock et al. 1996; Bement et al. 1999). It has also been shown that Rho associated kinase (p160 ROCK: Rho-associated coiled coil protein kinase), a downstream target of RhoA, stimulates myosin phoshorylation and thus also contractile force generation (Somlyo & Somlyo, 2000). To examine the effects of Rho-associated kinase on the purse string mechanism of single-cell restitution, we used a membrane-permeant selective inhibitor, Y-27632. In non-muscle cells, colonic myofibroblasts, Y-27632 inhibits endothelin-1-stimulated myosin phosphorylation and contractile force generation (Kernochan et al. 2002). By contrast, single-cell restitution was not impaired, and thus we conclude that Rho-associated kinase is not involved in purse-string contraction.
Hence, rapid closure of single-cell epithelial lesions is driven by a contractile ‘purse string’ (Martin & Lewis, 1992) that runs continuously around the defect and comprises a common actinomyosin motor. A similar mechanism has been described recently for the extrusion of apoptotic cells in UV-radiated MDCK monolayers (Rosenblatt et al. 2001).
… and, simultaneously, with functionally adequate tight junctions
With closure and sealing, the repaired epithelium assumed the same conductivity as distant intact epithelium. Hence, the tightness of the junctions returned to its original value. This indicates a control system for the construction of functionally adequate tight junctions. After loosening of intercellular contacts, by lowering the extracellular Ca2+ concentration, the paracellular conductivity increased and thus the epithelium changed from a tight to a leaky type. Nevertheless, during restitution the repaired epithelium again assumed the same conductivity as distant intact epithelium. The control system for the construction of tight junctions must, therefore, include a (direct or indirect) sensor of the paracellular conductivity. The cadherins of the adherens junction may play a crucial role (Danjo & Gipson, 1998).
Although low Ca2+ concentration and cytochalasin D had profound effects on epithelial conductivity, these agents did not irreversibly damage the epithelium (Fig. 5). Moreover, the epithelial conductivity in the presence of these agents was still higher (28.60 mS cm−2) than in some leaky epithelia under control conditions (e.g. in renal proximal tubule). Furthermore, epithelia grow in medium with a low Ca2+ concentration and seal upon transferral to normal Ca2+ medium (Contreras et al. 1992). In addition, our results demonstrate that the time course of restitution is not significantly different in cells exposed to low Ca2+ Ringer solution from cells under control condition. Hence, it is reasonable to assume that the extracellular Ca2+ concentration, probably via cadherins, affects the structure of tight junctions (Balda et al. 1993), but does not affect the speed of their assembly. The latter may depend on the Ca2+-independent cell adhesion activity of the integral membrane proteins of tight junctions (Kubota et al. 1999). It may be noted, however, that the restitution of epithelial single-cell lesions in low-calcium Ringer solutions contrasts with a block of healing in oocytes with membrane puncture wounds after removal of extracellular calcium (Bement et al. 1999).
In accordance with previous studies (Turner, 2000), we found that in undisturbed intestinal epithelium the tight junctions encircling the enterocytes colocalize with an apical actin band. After removal of a single cell, however, the cell membranes facing the defect are devoid of actin cables and tight junctions (Fig. 10A). During restitution, ZO-1, a peripheral membrane protein (Stevenson et al. 1986), and occludin, an integral membrane protein (Furuse et al. 1993), appear around the defect, and colocalize with the actin of the basal purse string (Fig. 10B). Thus de novo tight junction proteins form a complete circle around the defect, although - facing the gap - they lack a counterpart and cannot form a seal. What is the use of these proteins? As demonstrated by Bement et al. (1993), these unilateral tight junctions maintain apical/basolateral polarity in cells which border the wound.
Because recovery of barrier function goes in parallel with the morphological closure, functional sealing of the paracellular pathways must be rapid. Formation of the barrier requires construction of tight junctions at the new interfaces of cells elongating into the defect (Fig. 9). Thus during the closure of the gap, cell membranes and tight junction proteins are removed from the diminishing circle around the defect, and simultaneously cell membrane and tight junction are formed between the adjoining cells invading the gap. This sequence of events suggests a mechanism by which the seal is established zipper-like by merging the preformed tight junction proteins associated with the purse string.
In conclusion, epithelial restitution of single-cell defects comprises rapid closure by an actinomyosin purse string and simultaneous assembly of competent tight junctions between the cells extending into the defect, possibly from preformed proteins associated with the purse string. Thus, a functional barrier is formed within minutes.
Acknowledgments
We thank Dr Jörg Weiske for advice in immunohistochemistry techniques, U. Lempart, S. Lüderitz, and A. Fromm for expert technical assistance, and D. Sorgenfrei for engineering wizardry. The work was supported by the Deutsche Forschungsgemeinschaft and by Freie Universität Medical Faculty funds. P. Florian is a fellow of the Graduiertenkolleg ‘Signal Recognition and Transduction’ (DFG-GRK 276) working at his PhD/MD thesis at the faculty of veterinary medicine, Freie Universität Berlin.
Supplementary material
The online version of this paper can be found at:
http://www.jphysiol.org/cgi/content/full/545/2/485
and contains the following:
Movie 1 (3.4 MB)
To delineate the defect 10 min post lesion, a network of the tight junction protein occludin (red) as well as the cells’ nuclei (stained by DAPI, blue) are shown in three dimensions using confocal fluorescence microscopy. The movie shows x-y scans parallel to the epithelium (quadratic image), x-z scans at the indicated green line (rectangular image on top of the quadratic image), and y-z scans at the indicated red line (rectangular image to the right of the quadratic image). The blue line in the x-z and y-z scans indicates the x-y plane shown.
Movies 2-4 (3.9 MB, 3.9 MB and 4.8 MB)
To visualize the funnel-like defect in space, we generated a three-dimensional reconstruction by superposition of optical sections showing the tight junction proteins. The movies show the 3-D reconstruction with ZO-1 (green) and occludin (red) merged (yellow). Six minutes post lesion (Movie 2), the ring of tight junction proteins was hardly visible at the bottom of the defect. Ten minutes post lesion (Movie 3) the ring encloses a visible gap, which 15 min post lesion (Movie 4) appears to be closed. Note also the tight junctions between intact cells.
References
- Albers TM, Lomakina I, Moore RP. Structural and functional roles of cytoskeletal proteins during repair of native guinea pig intestinal epithelium. Cell Biology International. 1996;20:821–830. doi: 10.1006/cbir.1996.0105. [DOI] [PubMed] [Google Scholar]
- Balda MS, Gonzalez-Mariscal L, Matter K, Cereijido M, Anderson JM. Assembly of the tight junction: the role of diacylglycerol. Journal of Cell Biology. 1993;123:293–302. doi: 10.1083/jcb.123.2.293. [DOI] [PMC free article] [PubMed] [Google Scholar]
- Bement WM, Forscher P, Mooseker MS. A novel cytoskeletal structure involved in purse string wound closure and cell polarity maintenance. Journal of Cell Biology. 1993;121:565–578. doi: 10.1083/jcb.121.3.565. [DOI] [PMC free article] [PubMed] [Google Scholar]
- Bement WM, Mandato CA, Kirsch MN. Wound-induced assembly and closure of an actomyosin purse string in Xenopus oocytes. Current Biology. 1999;9:579–587. doi: 10.1016/s0960-9822(99)80261-9. [DOI] [PubMed] [Google Scholar]
- Brock J, Midwinter K, Lewis J, Martin P. Healing of incisional wounds in the embryonic chick wing bud: characterization of the actin purse-string and demonstration of a requirement for Rho activation. Journal of Cell Biology. 1996;135:1097–1107. doi: 10.1083/jcb.135.4.1097. [DOI] [PMC free article] [PubMed] [Google Scholar]
- Collares-Buzato CB, McEwan GT, Jepson MA, Simmons NL, Hirst BH. Paracellular barrier and junctional protein distribution depend on basolateral extracellular Ca2+ in cultured epithelia. Biochimica et Biophysica Acta. 1994;1222:147–158. doi: 10.1016/0167-4889(94)90163-5. [DOI] [PubMed] [Google Scholar]
- Contreras RG, Miller JH, Zamora M, Gonzalez-Mariscal L, Cereijido M. Interaction of calcium with plasma membrane of epithelial (MDCK) cells during junction formation. American Journal of Physiology. 1992;263:C313–318. doi: 10.1152/ajpcell.1992.263.2.C313. [DOI] [PubMed] [Google Scholar]
- Cooper JA. Effect of cytochalasin and phalloidin on actin. Journal of Cell Biology. 1987;105:1473–1478. doi: 10.1083/jcb.105.4.1473. [DOI] [PMC free article] [PubMed] [Google Scholar]
- Cramer LP, Mitchison TJ. Myosin is involved in postmitotic cell spreading. Journal of Cell Biology. 1995;131:179–189. doi: 10.1083/jcb.131.1.179. [DOI] [PMC free article] [PubMed] [Google Scholar]
- Danjo Y, Gipson IK. Actin ‘purse string’ filaments are anchored by E-cadherin-mediated adherens junctions at the leading edge of the epithelial wound, providing coordinated cell movement. Journal of Cell Science. 1998;111:3323–3332. doi: 10.1242/jcs.111.22.3323. [DOI] [PubMed] [Google Scholar]
- Dignass AU. Mechanisms and modulation of intestinal epithelial repair. Inflammatory Bowel Diseases. 2001;7:68–77. doi: 10.1097/00054725-200102000-00014. [DOI] [PubMed] [Google Scholar]
- Dignass AU, Podolsky DK. Cytokine modulation of intestinal epithelial cell restitution: central role of transforming growth factor beta. Gastroenterology. 1993;105:1323–1332. doi: 10.1016/0016-5085(93)90136-z. [DOI] [PubMed] [Google Scholar]
- Feil W, Lacy ER, Wong YM, Burger D, Wenzl E, Starlinger M, Schiessel R. Rapid epithelial restitution of human and rabbit colonic mucosa. Gastroenterology. 1989;97:685–701. doi: 10.1016/0016-5085(89)90640-9. [DOI] [PubMed] [Google Scholar]
- Ferreira G, Artigas P, Pizarro G, Brum G. Butanedione monoxime promotes voltage-dependent inactivation of L-type calcium channels in heart. Effects on gating currents. Journal of Molecular and Cellular Cardiology. 1997;29:777–787. doi: 10.1006/jmcc.1996.0321. [DOI] [PubMed] [Google Scholar]
- Frömter E, Diamond J. Route of passive ion permeation in epithelia. Nature. 1972;235:9–13. doi: 10.1038/newbio235009a0. [DOI] [PubMed] [Google Scholar]
- Furuse M, Hirase T, Itoh M, Nagafuchi A, Yonemura S, Tsukita S. Occludin: a novel integral membrane protein at tight junctions. Journal of Cell Biology. 1993;123:1777–1788. doi: 10.1083/jcb.123.6.1777. [DOI] [PMC free article] [PubMed] [Google Scholar]
- Gipson IK, Westcott MJ, Brooksby NG. Effects of cytochalasins B and D and colchicine on migration of the corneal epithelium. Investigative Ophthalmology and Visual Science. 1982;22:633–642. [PubMed] [Google Scholar]
- Gitter AH, Bendfeldt K, Schulzke JD, Fromm M. Leaks in the epithelial barrier caused by spontaneous and TNF α-induced single-cell apoptosis. FASEB Journal. 2000a;14:1749–1753. doi: 10.1096/fj.99-0898com. [DOI] [PubMed] [Google Scholar]
- Gitter AH, Bendfeldt K, Schulzke JD, Fromm M. Trans/paracellular, surface/crypt, and epithelial/subepithelial resistances of mammalian colonic epithelia. Pflügers Archiv. 2000b;439:477–482. doi: 10.1007/s004249900202. [DOI] [PubMed] [Google Scholar]
- Gitter AH, Bertog M, Schulzke JD, Fromm M. Measurement of paracellular epithelial conductivity by conductance scanning. Pflügers Archiv. 1997;434:830–840. doi: 10.1007/s004240050472. [DOI] [PubMed] [Google Scholar]
- Gitter AH, Wullstein F, Fromm M, Schulzke JD. Epithelial barrier defects in ulcerative colitis: characterization and quantification by electrophysiological imaging. Gastroenterology. 2001;121:1320–1328. doi: 10.1053/gast.2001.29694. [DOI] [PubMed] [Google Scholar]
- Hall A. Rho GTPases and the actin cytoskeleton. Science. 1998;279:509–514. doi: 10.1126/science.279.5350.509. [DOI] [PubMed] [Google Scholar]
- Herrmann C, Wray J, Travers F, Barman T. Effect of 2,3-butanedione monoxime on myosin and myofibrillar ATPases. An example of an uncompetitive inhibitor. Biochemistry. 1992;31:12227–12232. doi: 10.1021/bi00163a036. [DOI] [PubMed] [Google Scholar]
- Hudspeth AJ. Establishment of tight junctions between epithelial cells. Proceedings of the National Academy of Sciences of the USA. 1975;72:2711–2713. doi: 10.1073/pnas.72.7.2711. [DOI] [PMC free article] [PubMed] [Google Scholar]
- Hudspeth AJ. The recovery of local transepithelial resistance following single-cell lesions. Experimental Cell Research. 1982;138:331–342. doi: 10.1016/0014-4827(82)90182-3. [DOI] [PubMed] [Google Scholar]
- Jou TS, Schneeberger EE, Nelson WJ. Structural and functional regulation of tight junctions by RhoA and Rac1 small GTPases. Journal of Cell Biology. 1998;142:101–115. doi: 10.1083/jcb.142.1.101. [DOI] [PMC free article] [PubMed] [Google Scholar]
- Kaneko K, Satoh K, Masamune A, Satoh A, Shimosegawa T. Myosin light chain kinase inhibitors can block invasion and adhesion of human pancreatic cancer cell lines. Pancreas. 2002;24:34–41. doi: 10.1097/00006676-200201000-00005. [DOI] [PubMed] [Google Scholar]
- Kernochan LE, Tran BN, Tangkijvanich P, Melton AC, Tam SP, Yee HF., Jr Endothelin-1 stimulates human colonic myofibroblast contraction and migration. Gut. 2002;50:65–70. doi: 10.1136/gut.50.1.65. [DOI] [PMC free article] [PubMed] [Google Scholar]
- Kreusel KM, Fromm M, Schulzke JD, Hegel U. Cl− secretion in epithelial monolayers of mucus-forming human colon cell (HT-29/B6) American Journal of Physiology. 1991;261:C574–582. doi: 10.1152/ajpcell.1991.261.4.C574. [DOI] [PubMed] [Google Scholar]
- Kubota K, Furuse M, Sasaki H, Sonoda N, Fujita K, Nagafuchi A, Tsukita S. Ca2+-independent cell-adhesion activity of claudins, a family of integral membrane proteins localized at tight junctions. Current Biology. 1999;9:1035–1038. doi: 10.1016/s0960-9822(99)80452-7. [DOI] [PubMed] [Google Scholar]
- Ma TY, Tran D, Hoa N, Nguyen D, Merryfield M, Tarnawski A. Mechanism of extracellular calcium regulation of intestinal epithelial tight junction permeability: role of cytoskeletal involvement. Microscopy Research and Technique. 2000;51:156–168. doi: 10.1002/1097-0029(20001015)51:2<156::AID-JEMT7>3.0.CO;2-J. [DOI] [PubMed] [Google Scholar]
- McKillop DF, Fortune NS, Ranatunga KW, Geeves MA. The influence of 2,3-butanedione 2-monoxime (BDM) on the interaction between actin and myosin in solution and in skinned muscle fibres. Journal of Muscle Research and Cell Motility. 1994;15:309–318. doi: 10.1007/BF00123483. [DOI] [PubMed] [Google Scholar]
- Martin P, Lewis J. Actin cables and epidermal movement in embryonic wound healing. Nature. 1992;360:179–183. doi: 10.1038/360179a0. [DOI] [PubMed] [Google Scholar]
- Matsumura C, Kuwashima H, Kimura T. Myosin light chain kinase inhibitors and calmodulin antagonist inhibit Ca2+- and ATP-dependent catecholamine secretion from bovine adrenal chromaffin cells. Journal of Autonomic Pharmacology. 1999;19:115–121. doi: 10.1046/j.1365-2680.1999.00125.x. [DOI] [PubMed] [Google Scholar]
- Matsumura F, Ono S, Yamakita Y, Totsukawa G, Yamashiro S. Specific localization of serine 19 phosphorylated myosin II during cell locomotion and mitosis of cultured cells. Journal of Cell Biology. 1998;140:119–129. doi: 10.1083/jcb.140.1.119. [DOI] [PMC free article] [PubMed] [Google Scholar]
- Moore R, Carlson S, Madara JL. Rapid barrier restitution in an in vitro model of intestinal epithelial injury. Laboratory Investigation. 1989;60:237–244. [PubMed] [Google Scholar]
- Peralta Soler A, Mullin JM, Knudsen KA, Marano CW. Tissue remodeling during tumor necrosis factor-induced apoptosis in LLC-PK1 renal epithelial cells. American Journal of Physiology. 1996;270:F869–879. doi: 10.1152/ajprenal.1996.270.5.F869. [DOI] [PubMed] [Google Scholar]
- Rosenblatt J, Raff MC, Cramer LP. An epithelial cell destined for apoptosis signals its neighbors to extrude it by an actin- and myosin-dependent mechanism. Current Biology. 2001;11:1847–1857. doi: 10.1016/s0960-9822(01)00587-5. [DOI] [PubMed] [Google Scholar]
- Ruchhoeft ML, Harris WA. Myosin functions in Xenopus retinal ganglion cell growth cone motility in vivo. Journal of Neurobiology. 1997;32:567–578. [PubMed] [Google Scholar]
- Schmitz H, Fromm M, Bentzel CJ, Scholz P, Detjen K, Mankertz J, Bode H, Epple HJ, Riecken EO, Schulzke JD. Tumor necrosis-factor-alpha (TNF-α) regulates the epithelial barrier in the human intestinal cell line HT-29/B6. Journal of Cell Science. 1999;112:137–146. doi: 10.1242/jcs.112.1.137. [DOI] [PubMed] [Google Scholar]
- Silen W, Ito S. Mechanisms for rapid re-epithelialization of the gastric mucosal surface. Annual Review of Physiology. 1985;47:217–229. doi: 10.1146/annurev.ph.47.030185.001245. [DOI] [PubMed] [Google Scholar]
- Somlyo AP, Somlyo AV. Signal transduction by G-proteins, rho-kinase and protein phosphatase to smooth muscle and non-muscle myosin II. Journal of Physiology. 2000;522:177–185. doi: 10.1111/j.1469-7793.2000.t01-2-00177.x. [DOI] [PMC free article] [PubMed] [Google Scholar]
- Stevenson BR, Begg DA. Concentration-dependent effects of cytochalasin D on tight junctions and actin filaments in MDCK epithelial cells. Journal of Cell Science. 1994;107:367–375. doi: 10.1242/jcs.107.3.367. [DOI] [PubMed] [Google Scholar]
- Stevenson BR, Siliciano JD, Mooseker MS, Goodenough DA. Identification of ZO-1: a high molecular weight polypeptide associated with the tight junction (zonula occludens) in a variety of epithelia. Journal of Cell Biology. 1986;103:755–766. doi: 10.1083/jcb.103.3.755. [DOI] [PMC free article] [PubMed] [Google Scholar]
- Turner JR. ‘Putting the squeeze’ on the tight junction: understanding cytoskeletal regulation. Seminars in Cell and Developmental Biology. 2000;11:301–308. doi: 10.1006/scdb.2000.0180. [DOI] [PubMed] [Google Scholar]
- Turner JR, Rill BK, Carlson SL, Carnes D, Kerner R, Mrsny RJ, Madara JL. Physiological regulation of epithelial tight junctions is associated with myosin light-chain phosphorylation. American Journal of Physiology. 1997;273:C1378–1385. doi: 10.1152/ajpcell.1997.273.4.C1378. [DOI] [PubMed] [Google Scholar]
- Wilson AJ, Gibson PR. Epithelial migration in the colon: filling in the gaps. Clinical Science. 1997;93:97–108. doi: 10.1042/cs0930097. [DOI] [PubMed] [Google Scholar]
- Wittmann T, Waterman-Storer CM. Cell motility: can Rho GTPases and microtubules point the way. Journal of Cellular Science. 2001;114:3795–3803. doi: 10.1242/jcs.114.21.3795. [DOI] [PubMed] [Google Scholar]
Associated Data
This section collects any data citations, data availability statements, or supplementary materials included in this article.