

Abstract
It has been suggested that a decrease in the total concentration of tricarboxylic acid cycle intermediates (TCAIs) - secondary to a reduction in glycogen availability - compromises oxidative energy provision in skeletal muscle during prolonged exercise. However, no study has directly tested this hypothesis. We therefore studied six men (28 ± 2 years) during 90 min of leg kicking exercise at an intensity equivalent to 70 % of maximum. Biopsies (vastus lateralis) were obtained at rest and after 5, 10, 15, 30, 60 and 90 min of exercise, and thigh oxygen uptake (VO2,thigh) was calculated according to the Fick principle. The sum of six measured TCAIs (≈95 % of total pool size) was 1.30 ± 0.15 mmol (kg dry wt)−1 at rest and increased (P ≤ 0.05) rapidly during exercise to a peak value of 3.15 ± 0.23 mmol (kg dry wt)−1 after 10 min. Thereafter, the [TCAI] declined to 2.14 ± 0.23, 1.73 ± 0.32 and 1.62 ± 0.10 mmol (kg dry wt)−1 after 30, 60 and 90 min, respectively (P ≤ 0.05vs.10 min). Despite the 50 % decrease in [TCAI], aerobic energy provision was not compromised, as evidenced by stable VO2,thigh values throughout the entire exercise bout and little change in muscle [phosphocreatine] after 10 min. The largest decrease in [TCAI] (Δ + 1.00 ± 0.24 mmol (kg dry wt)−1) occurred from 10 to 30 min of exercise despite the fact that muscle [glycogen] remained relatively high at this point in exercise (≈274 ± 24 mmol (kg dry wt)−1 after 30 min; ≈65 % of rest value). Conversely, there was little change in [TCAI] during the final 30 min of exercise (Δ + 0.11 ± 0.29 mmol (kg dry wt)−1) despite a decrease in [glycogen] to ≈72 ± 3 mmol (kg dry wt)−1 after 90 min (≈13 % of rest value). We conclude that there is a progressive decrease in muscle [TCAI] during prolonged exercise in humans; however this decrease does not compromise aerobic energy provision and is not attributable to the depletion of muscle [glycogen].
It is well established that during the initial minutes of moderate to intense exercise, there is a rapid increase in the total content of tricarboxylic acid (TCA) cycle intermediates (TCAIs) within skeletal muscle (Sahlin et al. 1990; Gibala et al. 1997a). Expansion of the pool of TCAIs is attributable to a net increase in carbon flux into the TCA cycle through reactions other than citrate synthase, a phenomenon called ‘anaplerosis’ (Kornberg, 1966). The key anaplerotic pathway at the onset of exercise appears to be a rightward shift of the alanine aminotransferase reaction (pyruvate + glutamate → alanine + 2-oxoglutarate), which is driven by an increase in pyruvate availability when the rate of glycolytic flux transiently exceeds flux through the pyruvate dehydrogenase (PDH) reaction. This leads to an increased production of 2-oxoglutarate which augments the pool of TCAIs, as the amino group from glutamate is transferred onto pyruvate, forming alanine (Bergström et al. 1985; Gibala et al. 1997a). While the mechanistic explanation for the net increase in muscle TCAIs is generally accepted, the physiological significance of this phenomenon remains controversial.
In 1990, two groups of investigators independently proposed that an increase in [TCAI] is necessary in order to attain high rates of aerobic energy provision, presumably by activating various near-equilibrium reactions in the TCA cycle (Sahlin et al. 1990; Wagenmakers et al. 1990). It was further suggested that a decrease in muscle [TCAI] during prolonged exercise - secondary to a reduction in muscle glycogen availability - compromises TCA cycle flux and hastens the onset of local muscle fatigue (Sahlin et al. 1990; Wagenmakers et al. 1990). These claims remain prevalent in the literature (e.g. Wagenmakers, 1998, 1999), although we are aware of no direct evidence to support them. Indeed, two recent studies demonstrated that altering the extent of TCAI expansion during the rest-work transition does not affect aerobic energy provision (Bruce et al. 2001; Gibala et al. 2002). These findings are consistent with an alternative explanation for anaplerosis; namely, that changes in [TCAI] during exercise reflect alterations in carbon flux into and out of the TCA cycle but are not causally related to TCA cycle turnover (Gibala et al. 1998; Constantin-Teodosiu et al. 1999). Nonetheless, these recent studies (Bruce et al. 2001; Gibala et al. 2002) only addressed the initial phase of exercise, when several factors other than [TCAI] may be rate-limiting for the increase in mitochondrial respiration (for review, see Tchakovksy & Hughson, 1999).
With respect to prolonged steady-state exercise, the main evidence in support of the theory that links changes in [TCAI] with glycogen availability and the capacity for TCA cycle flux is the fact that the total content of TCAIs at exhaustion (i.e. after ≈75-90 min) is lower than during the initial minutes of exercise (Sahlin et al. 1990: Gibala et al. 1997b). However there is a paucity of data regarding the time course for changes in [TCAI] during a prolonged bout of exercise. Almost all studies have quantified changes in [TCAI] during the first 15 min of exercise at a given work intensity (Sahlin et al. 1995; Spencer & Katz, 1991; Gibala et al. 1997a, 1998; Gibala & Saltin, 1999; Bruce et al. 2001), or made comparisons between rest and the end of exercise (Spencer et al. 1991, 1992; Gibala et al. 1999). The results of one study showed that the [TCAI] after 40 min of exercise was low compared to 5 min of excercise and not different at exhaustion (Sahlin et al. 1990), but the authors primarily focused on fatigue and did not consider the possibility that decreases in [TCAI] might occur relatively early during exercise following an initial expansion of the pool of TCAIs. Sufficient time course data during an acute bout of exercise are warranted in order to properly evaluate the theory that links a decline in [TCAI] with glycogen availability and the capacity for oxidative energy provision.
Thus, the primary purpose of the present study was to repeatedly sample human skeletal muscle during a prolonged bout of exercise in order to quantify the time course for changes in [TCAI]. We also sought to determine whether a decrease in [TCAI] during prolonged exercise was related to muscle glycogen availability or affected aerobic energy provision. This was accomplished by simultaneously measuring changes in various energy metabolites in the vastus lateralis muscle, as well as quantifying thigh oxygen uptake using a method based on the Fick principle.
Methods
Subjects
Six healthy men, with a mean (± s.e.m.) age, height and body mass of 28 ± 2 years, 184 ± 4 cm and 75 ± 4 kg, respectively, volunteered for the investigation. All subjects were recreationally active, but none were engaged in any form of regular physical training. Subjects were fully advised of the purposes and potential risks of the study, which was approved by the Ethical Committee for Copenhagen and Frederiksberg Communities, and all provided written informed consent. All experiments were conducted in accordance with the Declaration of Helsinki.
Pre-experimental procedures
Subjects were familiarized with the Krogh ergometer modified for one-legged knee extensor exercise as previously described (Andersen & Saltin, 1985). With this exercise model, electromyographic activity is absent in the hamstrings and glutei muscles and the majority of work done for knee extension is performed by the quadriceps femoris muscle. At least 3 days prior to the experiment subjects performed an incremental exercise test with each leg (kicking frequency, 60 min−1) in order to determine the maximal power output of the knee extensors. This was defined as the highest workload that could be sustained while maintaining the desired kicking frequency. The mean peak workload achieved was not different between the dominant (68 ± 6 W) and non-dominant legs (67 ± 8 W). Subjects were instructed to consume their habitual diet and refrain from exercise or strenuous physical activity for 48 h prior to the experiment.
Experimental protocol
On the day of the experiment, subjects reported to the laboratory in the morning, approximately 2 h after the consumption of a light breakfast. Upon arrival at the laboratory, Teflon catheters for blood sampling were inserted into the femoral artery and femoral vein of one leg following application of a local anaesthetic (2 % lignocaine (lidocaine)). The catheters were advanced such that the arterial catheter was ≈2 cm proximal, and the venous catheter ≈2 cm distal to the inguinal ligament, respectively. The area over the lateral aspect of both thighs was anaesthetized and prepared for the extraction of needle biopsy samples from the vastus lateralis muscle. Subjects were moved to the exercise apparatus, where they rested supine for ≈15 min. During this time, arterial and venous blood samples were drawn simultaneously, and a resting muscle biopsy was obtained. Subjects then performed leg kicking exercise at ≈70 % of the one-legged maximal knee extension capacity for 90 min. During the exercise bout, femoral arterial and venous blood samples were drawn after 2, 5, 15, 30, 45, 60 and 90 min, and needle biopsy samples were obtained from the exercising leg after 15, 30, 60 and 90 min. Measurements of leg blood flow using the thermodilution technique (Anderson & Saltin, 1985) were made 4-6 times at rest, and immediately prior to and following each blood sample during exercise. Immediately prior to blood flow measurements, an occlusion cuff positioned just below the knee was inflated to ≥ 220 mmHg, and then quickly deflated. Heart rate (PE3000 Sport Tester, Polar Electro, Finland) and expired gas measurements (MedGraphics Model CPX/D, St Paul, MN, USA) were made at rest and periodically during exercise. Following the exercise bout, subjects rested for ≈90 min and then performed a 10 min bout of leg kicking exercise using the contralateral leg at the same absolute work intensity. Needle biopsy samples were obtained after 5 and 10 min of exercise. This second bout of exercise was performed for ethical reasons in order to reduce the number of biopsy samples obtained from the first leg, and also to permit uninterrupted blood sampling and blood flow measurements during the initial 15 min of the main exercise bout. Leg order was randomized and counterbalanced between subjects for dominance, such that three subjects performed the first exercise bout with their dominant leg, and three with their non-dominant leg.
Blood analyses
O2 saturation, haemoglobin concentration, PO2 and PCO2 were immediately determined using AVL Co-Oxylite and Blood Gas Analyzers (AVL Medical Instruments, Graz, Austria). The remainder of the blood samples were centrifuged and the supernatant collected and stored at −80 °C. Plasma samples were subsequently analysed spectrophotometrically for glucose, lactate, pyruvate and alanine concentrations using a COBAS FARA autoanalyzer (Hoffman-LaRoche Ltd, Basel, Switzerland).
Muscle analyses
Biopsy samples were immediately frozen (< 5 s) in liquid nitrogen, removed from the needle while still frozen and stored at −80 °C. The samples were subsequently freeze-dried, powdered, dissected free of non-muscle elements and stored at −80 °C. A portion of freeze-dried muscle (≈10-15 mg) was extracted with 0.5 m perchloric acid (containing 1 mm EDTA), neutralized with 2.2 m KHCO3 and assayed for pyruvate, lactate, phosphocreatine, creatine, citrate, isocitrate, 2-oxoglutarate, succinate, fumarate, malate, alanine, glutamate and glycogen concentrations using enzymatic methods (Bergmeyer, 1974; Harris et al. 1974; Passoneau & Lowry, 1993) adapted for fluorometry (Hitachi F-2000 fluorescence spectrophotometer, Hitachi Instruments, Japan). In order to correct for differences in blood or connective tissue between samples, muscle metabolite levels were corrected to the highest total creatine concentration obtained in all biopsy samples for a given subject.
Calculations
Thigh volume was calculated by using the thigh length, three circumferences and three skinfold measurements (Jones & Pearson, 1969) and muscle mass was estimated from a regression equation (Anderson & Saltin, 1985). The active muscle mass of the leg used during the main 90 min exercise bout, during which all blood samples and blood flow measures were obtained, was 2.76 ± 0.13 kg. The uptake and/or release of O2 and metabolites was calculated by multiplying blood flow by the arteriovenous difference in concentration and expressed per kilogram wet weight of active muscle. O2 content was calculated using the formula: (1.39 × haemoglobin concentration × O2 saturation) + (0.003 × PO2).
Statistics
All cardiorespiratory, blood and muscle data were analysed using a one-factor (time) repeated measures analysis of variance. Linear regression analysis was used to examine the relationship between muscle [TCAI] and thigh oxygen uptake. Statistical significance for all analyses was accepted as P ≤ 0.05, and significant interactions and main effects were further analysed using Tukey's honestly significant difference post hoc test. All data are expressed as means ± s.e.m.
Results
Cardiorespiratory, thigh oxygen uptake and blood metabolite data
Changes in pulmonary VO2, leg blood flow, the arterial-venous difference in O2 content and haemoglobin concentration are summarized in Table 1. VO2,thigh increased (P ≤ 0.05) by ≈40-fold above rest within the first 2 min of exercise and remained stable thereafter for the rest of the exercise period (Fig. 1). Changes in arterial glucose, lactate, pyruvate, and alanine concentrations and the net exchange of these metabolites are summarized in Table 2.
Table 1.
Cardiorespiratory and blood flow data at rest and during exercise
| Rest | 5 min | 10 min | 15 min | 30 min | 60 min | 90 min | |
|---|---|---|---|---|---|---|---|
| Pulmonary VO2 | 0.33 ± 0.02 | 0.91 ± 0.03* | 0.99 ± 0.02* | 0.94 ± 0.04* | 0.95 ± 0.02* | 0.94 ± 0.02* | 0.98 ± 0.03* |
| Thigh blood flow | 0.24 ± 0.03 | 4.34 ± 0.20* | 4.48 ± 0.21* | 4.38 ± 0.22* | 4.40 ± 0.22* | 4.39 ± 0.18* | 4.50 ± 0.23* |
| A—V O2 difference | 7.4 ± 0.7 | 12.9 ± 0.4* | 13.5 ± 0.5* | 13.2 ± 0.8* | 13.1 ± 0.6* | 12.8 ± 0.8* | 12.6 ± 0.7* |
| [Haemoglobin] | 15.1 ± 0.5 | 15.8 ± 0.5 | 15.7 ± 0.5 | 15.6 ± 0.5 | 15.6 ± 0.6 | 15.3 ± 0.5 | 15.3 ± 0.5 |
Values are means ±s.e.m.(n = 6). Pulmonary VO2 and leg blood flow are expressed in 1 min−1. Arterial-venous difference (A—V) in O2 content is expressed in ml(100 ml blood)−1. Haemoglobin concentration is expressed in g(100 ml arterial blood)−1.
P ≤ 0.05 vs. Rest.
Figure 1. Thigh oxygen uptake at rest and during exercise.
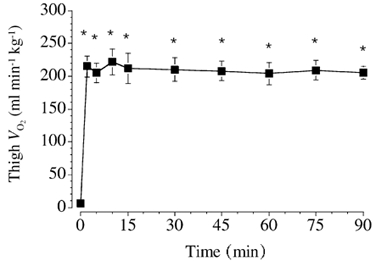
Values are means ± s.e.m. (n = 6). * P ≤ 0.05 vs. rest.
Table 2.
Arterial blood metabolites and thigh exchange at rest and during exercise
| Rest | 5 min | 10 min | 15 min | 30 min | 60 min | 90 min | |
|---|---|---|---|---|---|---|---|
| Arterial concentration (mmol l−1) | |||||||
| Glucose | 5.8 ± 0.2 | 5.0 ± 0.3 | 4.9 ± 0.3 | 4.8 ± 0.3 | 4.8 ± 0.2 | 4.9 ± 0.2 | 4.9 ± 0.2 |
| Lactate | 1.2 ± 0.1 | 2.2 ± 0.4 | 2.1 ± 0.4 | 1.9 ± 0.4 | 1.8 ± 0.4 | 1.1 ± 0.3 | 0.9 ± 0.1 |
| Pyruvate | 0.08 ± 0.02 | 0.07 ± 0.09 | 0.08 ± 0.10 | 0.06 ± 0.09 | 0.06 ± 0.09 | 0.05 ± 0.07 | 0.04 ± 0.08 |
| Alanine | 0.40 ± 0.06 | 0.42 ± 0.05 | 0.42 ± 0.04 | 0.41 ± 0.04 | 0.40 ± 0.04 | 0.35 ± 0.04 | 0.31 ± 0.04 |
| Net uptake/release (mmol min−1) | |||||||
| Glucose | 0.3 ± 0.1 | 0.7 ± 0.4 | 0.9 ± 0.3 | 0.8 ± 0.3 | 1.3 ± 0.3* | 2.0 ± 0.5* | 2.3 ± 0.5* |
| Lactate | 0.0 ± 0.0 | −3.6 ± 0.9* | −2.5 ± 0.7* | −2.2 ± 0.6* | −1.4 ± 0.46* | −0.5 ± 0.2* | −0.4 ± 0.2 |
| Pyruvate | 0.00 ± 0.00 | −0.03 ± 0.02 | −0.04 ± 0.02 | −0.05 ± 0.02 | −0.03 ± 0.01 | −0.01 ± 0.01 | −0.01 ± 0.01 |
| Alanine | 0.00 ± 0.00 | −0.19 ± 0.04* | −0.15 ± 0.03* | −0.11 ± 0.02* | −0.12 ± 0.02* | −0.08 ± 0.02 | −0.03 ± 0.02 |
Values are means ±s.e.m.(n = 6).
P ≤ 0.05 vs. Rest.
Muscle TCAIs
The sum concentration of the six measured TCAIs ([ΣTCAIs]) increased (P ≤ 0.05) during exercise and was higher after 5, 10 and 15 min than at rest (Fig. 2). The [ΣTCAIs] declined thereafter such that the value after 30, 60 and 90 min of exercise was lower (P ≤ 0.05) than the peak value after 10 min of exercise. It is noteworthy that the [ΣTCAIs] after 60 and 90 min of exercise was not different to the value at rest. The muscle content of each individual TCAI at rest and during exercise is summarized in Table 3.
Figure 2. Total muscle content of the six measured TCAIs at rest and during exercise.
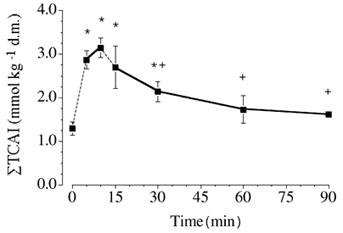
The discontinuous line between rest and 5 min, and 10 and 15 min denotes the fact that the 5 and 10 min biopsies were obtained from a different leg than for the other sampling points. Baseline testing established that the peak workload was not different between legs, and both legs performed exercise at the same absolute workload. Values are means ± s.e.m. (n = 6). * P ≤ 0.05vs. rest. +P ≤ 0.05 vs.10 min of exercise. d.m., dry muscle.
Table 3.
Individual TCAIs and other muscle metabolites at rest and during exercise
| Rest | 5 min | 10 min | 15 min | 30 min | 60 min | 90 min | |
|---|---|---|---|---|---|---|---|
| Citrate | 0.46 ± 0.06 | 0.67 ± 0.04* | 0.81 ± 0.06* | 0.74 ± 0.08* | 0.66 ± 0.12* | 0.57 ± 0.13 | 0.49 ± 0.03 |
| Isocitrate | 0.06 ± 0.01 | 0.09 ±0.02* | 0.11 ± 0.03* | 0.09 ± 0.01* | 0.09 ± 0.01* | 0.07 ± 0.01 | 0.07 ± 0.01 |
| 2-Oxoglutarate | 0.06 ± 0.01 | 0.05 ± 0.01 | 0.06 ± 0.01 | 0.04 ± 0.01 | 0.05 ± 0.01 | 0.03 ± 0.01 | 0.03 ± 0.01 |
| Succinate | 0.25 ± 0.02 | 0.46 ±0.04* | 0.49 ± 0.05* | 0.49 ± 0.09* | 0.44 ± 0.09* | 0.36 ± 0.05 | 0.38 ± 0.03 |
| Fumarate | 0.06 ± 0.01 | 0.22 ±0.04* | 0.21 ± 0.04* | 0.17 ±0.06* | 0.10 ± 0.02† | 0.09 ± 0.02† | 0.08 ± 0.02† |
| Malate | 0.42 ± 0.05 | 1.39 ± 0.14* | 1.47 ± 0.12* | 1.16 ± 0.27* | 0.80 ± 0.11*† | 0.62 ± 0.13† | 0.57 ± 0.07† |
| Pyruvate | 0.24 ± 0.03 | 0.37 ± 0.05* | 0.39 ± 0.07* | 0.36 ± 0.07* | 0.36 ± 0.06* | 0.25 ± 0.06 | 0.26 ± 0.06 |
| Lactate | 7.1 ± 0.8 | 22.7 ± 3.2* | 25.2 ± 4.0* | 23.9 ± 4.2* | 20.6 ± 4.3* | 13.6 ± 4.9 | 10.6 ± 1.8 |
| Creatine | 58.8 ± 8.0 | 79.8 ±10.5* | 86.0 ± 10.2* | 84.5 ± 10.8* | 76.2 ± 5.4* | 73.6 ± 4.4 | 70.2 ± 5.7 |
| Glycogen | 422 ± 30 | 369 ± 28* | 341 ± 26* | 313 ± 28* | 274 ± 24* | 158 ± 25* | 72 ± 23* |
Values are means ±s.e.m. (n) + 6 expressed in mmol (kg dry muscle)−1.
P ≤ 0.05 vs. Rest
P ≤ 0.05 vs. 10 min.
Muscle glutamate and alanine
[Glutamate] decreased during exercise and was lower (P ≤ 0.05) at all time points compared to at rest (Fig. 3). [Alanine] displayed a reciprocal change during the initial phase of exercise, such that the value after 5, 10, 15 and 30 min was higher (P ≤ 0.05) than at rest (Fig. 4). [Alanine] declined thereafter and was not different from at rest after 60 and 90 min of exercise.
Figure 3. Muscle [glutamate] at rest and during exercise.
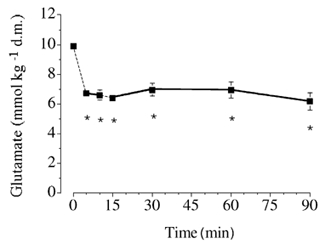
Values are means ± s.e.m. (n = 6). * P ≤ 0.05vs.rest. See the legend of Fig. 2 for additional details.
Figure 4. Muscle [alanine] at rest and during exercise.
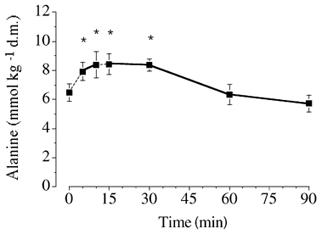
Values are means ± s.e.m. (n = 6). * P ≤ 0.05vs. rest. See the legend of Fig. 2 for additional details.
Muscle glycogen and other metabolites
[Glycogen] decreased progressively during exercise and was lower (P ≤ 0.05) at all time points than at rest (Table 3). [Lactate] and [pyruvate] increased transiently during exercise and were higher (P ≤ 0.05) after 5, 10, 15 and 30 min than at rest, but not different after 60 and 90 min (Table 3). Phosphocreatine concentration decreased during the initial phase of exercise and was lower (P ≤ 0.05) after 5, 10, 15 and 30 min than at rest (Fig. 5).
Figure 5. Muscle [phosphocreatine] at rest and during exercise.
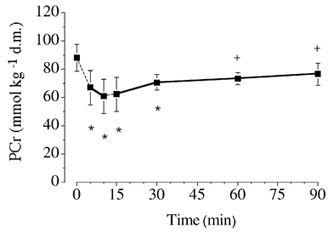
Values are means ± s.e.m. (n = 6). * P ≤ 0.05vs. rest. +P ≤ 0.05vs.10 min of exercise. PCr, phosphocreatine. See the legend of Fig. 2 for additional details.
Discussion
The major novel finding from the present study was that, following an initial expansion, which peaked after 10 min of exercise, there was a pronounced decrease in the total content of [TCAI] in human skeletal muscle. However, despite the decrease in [TCAI], mitochondrial respiration was not compromised, as evidenced by stable thigh oxygen uptake throughout the entire period of exercise and little change in muscle [phosphocreatine] after 10 min. Moreover, contrary to the suggestions of some authors (e.g. Wagenmakers, 1998), there was no obvious relationship between muscle glycogen availability and the decrease in [TCAI]. These data therefore demonstrate that a marked (≥50 %) decrease in muscle [TCAI] during prolonged exercise in humans does not compromise aerobic energy provision.
Significance of expansion of muscle [TCAI] during the initial phase of exercise
It has previously been suggested that ‘the increase in concentration of TCA-cycle intermediates probably is needed to increase the flux of the TCA-cycle and meet the increased energy demand of exercise’ (Wagenmakers, 1998). However, we are aware of no direct evidence to support this hypothesis, and only recently have attempts been made to manipulate the concentrations of TCAIs during exercise and determine the effect on skeletal muscle metabolism (Bruce et al. 2001; Gibala et al. 2002). The results from these recent studies have failed to support the notion that an increase in [TCAI] during the rest-work transition is rate limiting for the increase in aerobic energy provision. For example, Bruce et al. (2001) showed that augmenting the rate of expansion of muscle TCAIs by glutamine ingestion did not attenuate phosphocreatine utilization after 10 min of moderate cycle exercise, as might be expected if the increase in [TCAI] was causally related to mitochondrial respiration. Similarly, Gibala and colleagues (2002) showed a dissociation between changes in [TCAI] and phosphocreatine degradation during exercise when subjects began exercise with a lower than normal resting muscle glycogen content. It might be argued that a more appropriate manipulation would be to reduce the expansion of the TCAIs pool during exercise and determine the effect on energy metabolism. There are no published studies on this topic; however, recent work from our laboratory which has appeared in abstract form (Dawson et al. 2001; Howarth et al. 2002) showed that the acute exercise-induced expansion of the muscle TCAIs pool was attenuated following aerobic exercise training, but this did not compromise energy provision.
While recent studies have advanced our understanding of the metabolism of TCAIs during the initial phase of exercise (Bruce et al. 2001; Gibala et al. 2002), few data are available regarding changes in [TCAI] after 10-15 min of exercise or the potential significance of these changes. Some authors have measured [TCAI] at exhaustion following prolonged exercise and made comparisons to the situation at rest (Spencer & Katz, 1991; Spencer et al. 1991) or during the initial minutes of exercise (Sahlin et al. 1990; Gibala et al. 1997a); however there is a paucity of data regarding the time course for changes in [TCAI] during prolonged exercise. The present study was designed to remedy this, and specifically addressed the theory proposed by others that ‘the establishment and maintenance of a high-concentration of tricarboxylic acid-cycle intermediates … allows for the maintenance of a high TCA-cycle flux and aerobic oxidation rate during prolonged exercise’ (Wagenmakers, 1998). Contrary to this hypothesis, our data clearly demonstrate that a significant decrease in [TCAI] does not compromise aerobic energy provision in human skeletal muscle. We observed a marked and rapid decrease in [TCAI] following the initial expansion at the start of exercise, such that the value after 30, 60 and 90 min was lower than the value after 10 min of exercise (Fig. 2). However, in spite of the decrease in [TCAI], aerobic energy provision was not compromised, as evidenced by stable thigh oxygen uptake over the entire period of exercise (Fig. 1). The dissociation between [TCAI] and aerobic energy provision is further illustrated in Fig. 6, in which individual values for [TCAI] are plotted against the corresponding VO2,thigh value measured at each time point for all six subjects during exercise (open circles). If the capacity for aerobic energy provision was causally related to [TCAI], one would expect to observe a strong, positive linear relation between these variables. However, no such relationship was apparent (r2 + 0.001, P + 0.82), and the mean data (filled circles) illustrate that the average thigh oxygen uptake remained constant at ≈210 ml −1 kg−1 throughout exercise across a wide range of [TCAI] (i.e. peak value of 3.15 ± 0.22 mmol (kg dry muscle)−1 after 10 min of exercise versus nadir of 1.62 ± 0.09 after 90 min). The dissociation between [TCAI] and mitochondrial respiration is further supported by the observation that muscle [phosphocreatine] remained relatively stable from 10-90 min of exercise despite ≈50 % decrease in [TCAI].
Figure 6. Relationship between the total muscle content of TCAIs and thigh oxygen uptake during exercise.
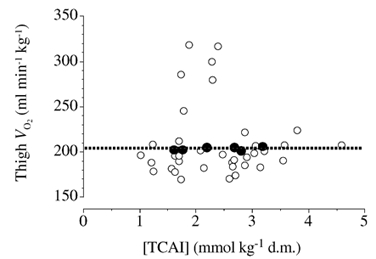
Individual data points for all six subjects (○) at all time points during exercise when the two variables were simultaneously assessed (i.e. 5, 10, 15, 30, 60 and 90 min). Mean values (•) for the six subjects at each time point.
Muscle glycogen availability and [TCAI] during prolonged exercise
In 1990 two groups of investigators independently proposed that a decline in muscle [glycogen] during the latter stages of prolonged exercise leads to a reduction in [TCAI] and compromises oxidative energy provision (Sahlin et al. 1990; Wagenmakers et al. 1990). This theory remains prevalent in the literature (e.g. Wagenmakers, 1998, 1999) although we are aware of no direct evidence to support it. For example, a recent comprehensive review by Wagenmakers (1998) concluded that ‘the failure to maintain high concentrations of TCA-cycle intermediates during prolonged exercise…plays a role in the development of fatigue in glycogen depleted muscles’ and undergraduate textbooks include statements to the effect that ‘as muscle glycogen levels become low… the decreasing TCA cycle intermediates must be replaced if mitochondrial respiration is to be maintained at a relatively high rate’ (Robergs & Roberts, 1997). The main evidence often cited to support this theory appears to be the observation that the [TCAI] following prolonged exercise to exhaustion is low compared to the concentration during the initial 5-15 min of exercise (Sahlin et al. 1990; Gibala et al. 1997b), and fatigue is associated with low glycogen availability. However, prior to the present work no study had systematically investigated the time course for changes in muscle [TCAI], [glycogen] and markers of aerobic energy provision during a prolonged bout of exercise in humans. Our results clearly suggest that the decline in muscle [TCAI] is not temporally related to a decrease in muscle glycogen availability. In the present study the largest decline in [TCAI] occurred between 10 and 30 min of exercise despite modest glycogen contents (≈275 mmol (kg dry wt)−1 after 30 min). Conversely, there was little change in [TCAI] during the final 30 min of exercise, when muscle [glycogen] declined to the lowest levels (i.e. < 100 mmol (kg dry wt)−1 after 90 min). Thus, the notion that the pool of TCAIs is maintained at a ‘high’ concentration during exercise and declines to precipitously ‘low’ levels only when glycogen levels become depleted (Wagenmakers, 1998) is questionable. Moreover, regardless of the relationship to glycogen availability, the marked decrease in [TCAI] observed in the present study did not appear to compromise mitochondrial respiration, since there was no change in thigh oxygen uptake during exercise and little change in muscle [phosphocreatine] after 10 min.
Why does the pool of TCAIs decline during prolonged exercise?
It is difficult to identify the precise mechanism responsible for the decline in muscle [TCAI] during prolonged exercise, given the complex interaction between the TCA cycle and other intermediary pathways in metabolism (Rennie, 1996). Indeed, as noted by Taegtmeyer (1983), steady-state concentrations of TCAIs depend on numerous factors, including the concentrations of reactants in equilibrium reactions, enzyme activities (in non-equilibrium reactions), branch points and compartmentalization. It is plausible that the decrease in [TCAI] could be related to a net efflux of carbon (cataplerosis) through some of the same reactions that serve an anaplerotic function at the onset of exercise. Many of these reactions are near equilibrium and thus the net direction of flux will depend on the relative concentrations of substrates and products. For example, the observed decreases in [TCAI] and [alanine] following the initial increase at the onset of exercise could potentially be mediated by ‘reversal’ of flux through the alanine aminotransferase reaction (Snell, 1980). Changes in the rate and/or direction of flux through alanine aminotransferase could be influenced by a decline in glycolytic flux during exercise, and thus a better matching between glycolytic and PDH flux after the initial imbalance at the onset of exercise. This interpretation is supported by the fact that the rate of glycogen breakdown in the present study declined by 50 % between 15 and 30 min of exercise, which is the period when the fall in [TCAI] was greatest. The muscle content of pyruvate remained unchanged during this period of time; however, static concentrations provide little insight into the fate of this metabolite during exercise. Net removal of TCAIs could also occur via carbon flux through the reactions catalysed by glutamate dehydrogenase and subsequently glutamine synthetase, leading to the production of glutamine which is known to be released in large quantities during prolonged exercise (Sahlin et al. 1990).
It has also been suggested that an increased rate of leucine oxidation during prolonged exercise may place a ‘drain’ on the TCA cycle and lead to the observed decrease in the concentration of TCAIs (for review, see Wagenmakers, 1998). This is due to the fact that branched-chain oxo acid dehydrogenase (BCOAD), the rate-limiting enzyme for branched-chain amino acid (BCAA) oxidation in muscle, is increasingly activated during prolonged exercise (Wagenmakers et al. 1989; Rush et al. 1995). The initial transamination reaction in which the BCAA (either leucine, isoleucine or valine) is converted to its respective branched-chain oxo acid consumes the TCAI 2-oxoglutarate. While complete oxidation of valine and isoleucine eventually yields the TCAI succinyl CoA (i.e. such that no net drain occurs), leucine oxidation will place a drain on the TCA cycle since its carbon skeleton is converted to acetyl CoA. However, due to the relatively low maximal activity of BCOAD in human skeletal muscle and based on the normal exercise induced activation of BCOAD (Wagenmakers et al. 1989; Rush et al. 1995; van Hall et al. 1996; Jackman et al. 1997), it is unlikely that this process places a significant drain on the TCA cycle. Moreover, this theory was directly tested using subjects who ingested BCAAs in order to increase BCOAD activity and presumably accelerate the carbon drain during exercise, and no measurable effect on [2-oxoglutarate] or other [TCAI] was observed (Gibala et al. 1999).
Methodological considerations
As with any study involving repeated biopsy sampling of human skeletal muscle and the subsequent analyses of metabolites in whole tissue homogenates, there are several methodological issues that limit the findings of the present work. There is obviously an inherent error with respect to the biopsy technique in that tissue sampled at different time points may vary in fibre type and the extent of fibre recruitment; however, this unavoidable problem may have been exacerbated in the present study since not all biopsies were obtained from the same leg and work load was established based on the maximal power of the dominant leg. For ethical reasons, the number of biopsies precluded the possibility of obtaining all samples from a single leg, and concern regarding potential differences in workload was alleviated by the fact that the peak knee-extensor workload established during baseline testing was virtually identical between legs (see Methods). Nonetheless, there may have been slight differences in the magnitude of TCAI expansion between legs, although we feel this possibility does not impact upon the main findings of the study. Indeed, even if we discount the 5 and 10 min sampling points (which were obtained from a different leg) and assume that peak TCAI expansion occurred after 15 min of exercise, our fundamental message regarding the ‘early’ decline in [TCAI] and the lack of apparent relationship to muscle glycogen availability remains unchanged.
Another important limitation inherent to most human exercise studies relates to the general lack of information regarding metabolite concentrations in different cellular compartments. Several TCAIs, as well as numerous enzymes, which catalyse reactions involving TCAIs, are believed to be present in both the cytosolic and mitochondrial compartments (Newsholme & Leech, 1983). If changes in the concentration of TCAIs influence aerobic energy metabolism, one would presume that such changes would have to occur within the mitochondrial matrix. It is unfortunate that the analytical techniques that have been employed in the human investigations of this topic conducted to date, including the present study, do not permit resolution of the subcellular compartmentalization of metabolites. This is an important area of future research that could significantly advance our understanding of metabolic control in human muscle.
Conclusion
In summary, the results from the present study showed that following an initial rapid expansion during the initial minutes of exercise, there was a pronounced decrease in muscle [TCAI], which reached a plateau towards the end of the bout. However, despite the decrease in [TCAI], mitochondrial respiration was not compromised, as evidenced by stable thigh oxygen uptake throughout the entire period of exercise and little change in muscle [phosphocreatine] after 10 min. Moreover, contrary to what has been suggested by some authors (Sahlin et al. 1990; Wagenmakers et al. 1991), there was no obvious relationship between muscle glycogen availability and the decrease in [TCAI]. These data therefore demonstrate that a decrease in muscle [TCAI] during prolonged exercise in humans does not compromise aerobic energy provision.
Acknowledgments
We thank Carsten Nielsen for technical assistance, and our subjects for their time and effort. This work was supported by the Danish National Research Foundation and the Natural Sciences and Engineering Research Council of Canada (NSERC). M.J.G. was supported by a NSERC Postdoctoral Fellowship Award during his tenure at the Copenhagen Muscle Research Centre.
References
- Andersen P, Saltin B. Maximal perfusion of skeletal muscle in man. Journal of Physiology. 1985;366:233–249. doi: 10.1113/jphysiol.1985.sp015794. [DOI] [PMC free article] [PubMed] [Google Scholar]
- Bergmeyer HU. Methods of Enzymatic Analysis. 2. New York: Academic Press; 1974. [Google Scholar]
- Bergström J, Fürst P, Hultman E. Free amino acids in muscle tissue and plasma during exercise in man. Clinical Physiology. 1985;5:155–160. doi: 10.1111/j.1475-097x.1985.tb00591.x. [DOI] [PubMed] [Google Scholar]
- Bruce M, Constantin-Teodosiu D, Greenhaff PL, Boobis LH, Williams C, Bowtell JL. Glutamine supplementation promotes anaplerosis but not oxidative energy delivery in human skeletal muscle. American Journal of Physiology -Endocrinology and Metabolism. 2001;280:E669–675. doi: 10.1152/ajpendo.2001.280.4.E669. [DOI] [PubMed] [Google Scholar]
- Constantin-Teodosiu D, Simpson EJ, Greenhaff PL. The importance of pyruvate availability to PDC activation and anaplerosis in human skeletal muscle. American Journal of Physiology. 1999;276:E472–478. doi: 10.1152/ajpendo.1999.276.3.E472. [DOI] [PubMed] [Google Scholar]
- Dawson KD, Howarth KR, Tarnopolsky MA, Gibala MJ. The effect of short-term training on muscle TCA cycle intermediates (TCAI) and amino acid metabolism during exercise in humans. Canadian Journal of Applied Physiology. 2001;26:473. [Google Scholar]
- Gibala MJ, Lozej M, Tarnopolsky MA, McLean C, Graham TE. Low glycogen and branched-chain amino acid ingestion do not impair anaplerosis during exercise in humans. Journal of Applied Physiology. 1999;87:1662–1667. doi: 10.1152/jappl.1999.87.5.1662. [DOI] [PubMed] [Google Scholar]
- Gibala MJ, MacLean DA, Graham TE, Saltin B. Anaplerotic processes in human skeletal muscle during brief dynamic exercise. Journal of Physiology. 1997a;502:703–713. doi: 10.1111/j.1469-7793.1997.703bj.x. [DOI] [PMC free article] [PubMed] [Google Scholar]
- Gibala MJ, MacLean DA, Graham TE, Saltin B. Tricarboxylic acid cycle pool size and estimated cycle flux in human muscle during exercise. American Journal of Physiology. 1998;275:E235–242. doi: 10.1152/ajpendo.1998.275.2.E235. [DOI] [PubMed] [Google Scholar]
- Gibala MJ, Peirce N, Constantin-Teodosiu D, Greenhaff PL. Exercise with low muscle glycogen augments TCA cycle anaplerosis but impairs oxidative energy provision in humans. Journal of Physiology. 2002;540:1079–1086. doi: 10.1113/jphysiol.2001.012983. [DOI] [PMC free article] [PubMed] [Google Scholar]
- Gibala MJ, Tarnopolsky MA, Graham TE. Tricarboxylic acid cycle intermediates in human muscle at rest and during prolonged cycling. American Journal of Physiology. 1997b;272:E239–244. doi: 10.1152/ajpendo.1997.272.2.E239. [DOI] [PubMed] [Google Scholar]
- Gibala MJ, Saltin B. PDH activation by dichloroacetate reduces TCA cycle intermediates at rest but not during exercise in humans. American Journal of Physiology. 1999;277:E33–38. doi: 10.1152/ajpendo.1999.277.1.E33. [DOI] [PubMed] [Google Scholar]
- Harris RC, Hultman E, Nordesjo LO. Glycogen, glycolytic intermediates and high-energy phosphates determined in biopsy samples of musculus quadriceps femoris of man at rest. Scandinavian Journal of Clinical and Laboratory Investigation. 1974;33:109–120. [PubMed] [Google Scholar]
- Howarth KR, LeBlanc PJ, Heigenhauser GJF, Gibala MJ. Aerobic training (TR) attenuates skeletal muscle anaplerosis during exercise in humans. FASEB Journal. 2002;16:A31. [Google Scholar]
- Jackman ML, Gibala MJ, Hultman E, Graham TE. Nutritional status affects branched-chain oxo-acid dehydrogenase activity during exercise in humans. American Journal of Physiology. 1997;272:E233–238. doi: 10.1152/ajpendo.1997.272.2.E233. [DOI] [PubMed] [Google Scholar]
- Jones PRM, Pearson J. Anthropometric determination of leg fat and muscle plus bone volumes in young male and female adults. Journal of Physiology. 1969;204:36P. [PubMed] [Google Scholar]
- Kornberg HL. Anaplerotic sequences and their role in metabolism. In: Campbell PN, Marshall RD, editors. Essays in Biochemistry. London: Academic Press; 1966. pp. 1–31. [Google Scholar]
- Newsholme EA, Leech AR. Biochemistry for the Medical Sciences. New York: John Wiley and Sons; 1983. [Google Scholar]
- Passoneau JV, Lowry OH. Enzymatic Analysis: a Practical Guide. Totowa, NJ: Humana Press; 1993. [Google Scholar]
- Rennie MJ. Influence of exercise on protein and amino acid metabolism. In: Terjung R, editor. Handbook of Physiology, section 12, Exercise: Regulation and Integration of Multiple Systems. New York: Oxford University Press; 1996. pp. 995–1035. [Google Scholar]
- Robergs RA, Roberts SO. Exercise Physiology: Exercise, Performance and Clinical Applications. Boston, MA: McGraw-Hill; 1997. p. 242. [Google Scholar]
- Rush JWE, MacLean D, Hultman E, Graham TE. Exercise causes branched-chain oxoacid dehydrogenase dephosphorylation but not AMP deaminase binding. Journal of Applied Physiology. 1995;78:2193–2200. doi: 10.1152/jappl.1995.78.6.2193. [DOI] [PubMed] [Google Scholar]
- Sahlin K, Jorfeldt L, Henriksson K-G, Lewis SR, Haller RG. Tricarboxylic acid cycle intermediates during incremental exercise in healthy subjects and in patients with McArdle's disease. Clinical Science. 1995;88:687–693. doi: 10.1042/cs0880687. [DOI] [PubMed] [Google Scholar]
- Sahlin K, Katz A, Broberg S. Tricarboxylic acid cycle intermediates in human muscle during prolonged exercise. American Journal of Physiology. 1990;259:E834–841. doi: 10.1152/ajpcell.1990.259.5.C834. [DOI] [PubMed] [Google Scholar]
- Snell K. Muscle alanine synthesis and hepatic gluconeogenesis. Biochemical Society Transactions. 1980;8:205–213. doi: 10.1042/bst0080205. [DOI] [PubMed] [Google Scholar]
- Spencer MK, Katz A. Role of glycogen in control of glycolysis and IMP formation in human muscle during exercise. American Journal of Physiology. 1991;260:E859–864. doi: 10.1152/ajpendo.1991.260.6.E859. [DOI] [PubMed] [Google Scholar]
- Spencer MK, Zhen Y, Katz A. Carbohydrate supplementation attenuates IMP accumulation in human muscle during prolonged exercise. American Journal of Physiology. 1991;261:C71–76. doi: 10.1152/ajpcell.1991.261.1.C71. [DOI] [PubMed] [Google Scholar]
- Spencer MK, Zhen Y, Katz A. Effect of low glycogen on carbohydrate and energy metabolism in human muscle during exercise. American Journal of Physiology. 1992;262:E975–979. doi: 10.1152/ajpcell.1992.262.4.C975. [DOI] [PubMed] [Google Scholar]
- Taegtmeyer H. On the inability of ketone bodies to serve as the only energy providing substrate for rat heart at physiological work load. Basic Research in Cardiology. 1983;78:435–450. doi: 10.1007/BF02070167. [DOI] [PubMed] [Google Scholar]
- Tchakovksy ME, Hughson RL. Interaction of factors determining oxygen uptake at the onset of exercise. Journal of Applied Physiology. 1999;86:1101–1113. doi: 10.1152/jappl.1999.86.4.1101. [DOI] [PubMed] [Google Scholar]
- van Hall G, MacLean DA, Saltin B, Wagenmakers AJM. Mechanisms of activation of muscle branched-chain keto acid dehydrogenase during exercise in man. Journal of Physiology. 1996;494:899–905. doi: 10.1113/jphysiol.1996.sp021542. [DOI] [PMC free article] [PubMed] [Google Scholar]
- Wagenmakers AJM. Muscle amino acid metabolism at rest and during exercise: role in human physiology and metabolism. In: Holloszy JO, editor. Exercise and Sports Science Reviews. Vol. 26. Baltimore: Williams and Wilkins; 1998. pp. 287–314. [PubMed] [Google Scholar]
- Wagenmakers AJM. Skeletal muscle amino acid transport and metabolism. In: Hargreaves M, Thompson M, editors. Biochemistry of Exercise. X. Champaign, IL: Human Kinetics; 1999. pp. 217–232. [Google Scholar]
- Wagenmakers AJM, Brookes JH, Coakley JH, Reilly T, Edwards RHT. Exercise-induced activation of the branched-chain 2-oxo acid dehydrogenase in human muscle. European Journal of Applied Physiology. 1989;59:159–167. doi: 10.1007/BF02386181. [DOI] [PubMed] [Google Scholar]
- Wagenmakers AJM, Coakley JH, Edwards RHT. Metabolism of branched-chain amino acids and ammonia during exercise: clues from McArdle's disease. International Journal of Sports Medicine. 1990;11:S101–S113. doi: 10.1055/s-2007-1024861. [DOI] [PubMed] [Google Scholar]