

Abstract
Nociceptive spinothalamic tract (STT) neurones in lamina I of the lumbosacral spinal cord of anaesthetized cats were characterized by recording their responses to graded mechanical stimulation with controlled forces of 10-120 g and probes of 5.0, 0.5 and 0.1 mm2 contact area. Neurones were identified by antidromic activation from the contralateral thalamus, and cells that responded to noxious stimulation were categorized as either nociceptive specific (NS, n = 20) or as polymodal nociceptive (HPC, responsive to heat, pinch and cold, n = 19) based on their responses to quantitative thermal stimuli. The mean responses of the 39 units increased linearly as stimulus intensity increased, and the population stimulus-response curves evoked by each of the three probes were all significantly different from each other. Thresholds were 45 g for the 5.0 mm2 probe, 30 g for the 0.5 mm2 probe and 20 g for the 0.1 mm2 probe. Further analysis showed that the NS neurones encoded both stimulus intensity and area (probe size) significantly better than HPC neurones in terms of their thresholds to individual probes, their peak discharge rates, their suprathreshold responsiveness and their ability to discriminate the three different probe sizes. These differences are consistent with the known differences between the mechanical encoding properties of A-fibre nociceptors, which provide the dominant inputs to NS neurones, and C-fibre nociceptors, which are the dominant inputs to HPC cells. Comparison of the stimulus-response curves of NS and HPC neurones indicated that the discharge of NS neurones better match the psychophysics of mechanical pain sensations in humans than the discharge of the HPC neurones do. Our findings support the view that NS neurones have a prominent role in mechanical pain and sharpness, and they corroborate the concept that the lamina I STT projection comprises several discrete channels that are integrated in the forebrain to generate qualitatively distinct sensations.
Much of our knowledge on the central processing of cutaneous nociceptive information has been gained from studies that used graded heat stimuli to characterize nociceptive neurones (Willis et al. 1974; Price et al. 1978; Bushnell et al. 1984; Ferrington et al. 1987; Maixner et al. 1989; although see Bester et al. 2000 and Craig et al. 2001). While this approach has provided valuable information, it is not clear whether the neural circuits that are involved in the transmission of noxious heat stimuli are also involved in the transmission of noxious stimuli of other modalities. Many neurones that respond to noxious heat stimulation also respond to other stimulus forms such as innocuous and noxious mechanical stimuli and algogenic chemicals (e.g. Willis et al. 1974; Price et al. 1978; Carstens, 1997; Bester et al. 2000). However, very little is known about how these neurones encode non-thermal stimulus modalities, and from the available evidence it is not clear what the necessary features of their responses are that allow the brain to extract modality-related information.
Several lines of evidence suggest that independent populations of neurones may transmit heat nociception and mechanical nociception. Firstly, noxious mechanical stimuli and noxious heat stimuli produce pain sensations that have very different sensory qualities - pain evoked by a mechanical stimulus is sharp and pricking, whereas heat-evoked pain is burning (heat can also evoke a pricking sensation, see Discussion). These two sensations are qualitatively similar to ‘first’ and ‘second’ pain, which are conducted by Aδ- and C-fibre primary afferents, respectively (Lewis & Pochin, 1937; Boring, 1942; Collins et al. 1960; Campbell & LaMotte, 1983) Secondly, modality-specific spinal neurones, including spinothalamic tract (STT) cells, that are excited by just a single stimulus modality such as pinching (Christensen & Perl, 1970), noxious heat (Craig & Kniffki, 1985) or the algogenic chemical mustard oil (Andrew & Craig, 2001a) have been identified in lamina I of the dorsal horn. Other spinal neurones respond to several different modalities of noxious stimulation (mechanical, thermal, chemical), or they respond to both innocuous and noxious stimuli in a graded manner. Thirdly, our recent characterization of different classes of spinothalamic lamina I neurones with refined, psychophysically validated stimuli suggested that each category of neurones acts as a selective sensory channel or ‘labelled line’. Thus one type of nociceptive neurone (nociceptive-specific, or NS) seems to have a distinguishable role in first (sharp) pain, whereas another type of nociceptive neurone (polymodal-nociceptive, or HPC) seems to have a distinguishable role in second (burning) pain (Andrew & Craig, 2002; Craig & Andrew, 2002). These two cell classes are differentiated by both anatomical and physiological criteria (Han et al. 1998; Craig et al. 2001), and NS neurones have lower mechanical thresholds than HPC neurones, but their mechanical stimulus- response functions were not statistically distinguishable with graded pinch stimuli using a 3 mm2 probe (Craig et al. 2001). Nonetheless, differences are seen in the mechanical stimulus-response functions of Aδ- and C-fibre nociceptors if force-controlled stimuli are used with a series of different sized probes (Garell et al. 1996; Andrew & Greenspan, 1999; Slugg et al. 2000).
To extend our functional analyses of lamina I STT neurones, and to investigate the central encoding of noxious mechanical stimuli, we have characterized different classes of nociceptive lamina I STT neurones using brief, graded mechanical stimulation applied with constant forces using a series of different sized probes. Brief mechanical stimuli evoke sharp, pricking pain sensations (Andrew & Greenspan, 1999). Other methods of mechanical stimulation that evoke qualitatively different sensations, e.g. impact stimuli (Koltzenburg & Handwerker, 1994) or tonic pressure stimuli (Adriansen et al. 1984; Andrew & Craig, 2002) may be mediated by different neural mechanisms. Brief stimuli also avoid the discharge adaptation observed using maintained stimuli (Andrew & Craig, 2002). Our results indicate that nociceptive-specific neurones encode mechanical stimulus intensity and stimulus area significantly better than polymodal-nociceptive neurones, and they are likely to be selectively important in mechanical pain sensations.
Methods
Anaesthesia and preparation of animals
All experimental protocols were approved by the local Institutional Animal Care and Use Committee, and they conformed to the guidelines of the National Institutes of Health and the American Physiological Society. Experiments were performed on 34 adult cats of either sex (2.7-4.4 kg) that were sedated with ketamine (25 mg kg−1i.m.), and anaesthetized either with a combination of α-chloralose and urethane (80 and 100 mg kg−1, respectively, n = 5) injected intravenously via a cannula in the right cephalic vein, or with α-chloralose and sodium pentobarbital (80 and 5 mg kg−1, respectively; n = 29). Anaesthesia was supplemented with further increments of α-chloralose (10-20 mg kg−1) as needed to maintain areflexia. Dexamethasone (10 mg) was given intravenously to prevent oedema. Cannulae were placed into the left carotid artery and into the trachea. Systemic blood pressure was measured with a pressure transducer connected to the arterial cannula. Core temperature was maintained at 37.5 °C with a heating blanket and an infra-red lamp that was controlled by feedback from a rectal thermistor. The animals were injected with the neuromuscular blocker pancuronium (400 μg i.v.), and artificially ventilated to maintain end-tidal CO2 levels of between 3.8 and 4.2 %. During neuromuscular blockade adequate anaesthetic depth was ensured by observing the following criteria: (1) the pupils were constricted; (2) the blood pressure was stable during noxious stimulation; and (3) when the paralytic agent wore off, as evidenced by muscle twitches during electrical stimulation of the thalamus (see following text), pinching a forepaw did not evoke a withdrawal reflex.
The animal was mounted in a stereotaxic device following topical anaesthesia of the ear canals with benzocaine spray (Cetacaine; Cetylite, Pennsauken, NJ, USA). Additional precautions to limit the nociceptive barrage during surgery included preventing the corneas from drying with eye salve, and injecting the long-acting local anaesthetic bupivacaine prophylactically into the sites of all incisions. A craniotomy was performed to enable vertical microelectrode penetrations into the right somatosensory thalamus, prior to the insertion of stimulating electrodes. The spinal lumbosacral enlargement was exposed by laminectomy and stabilized with clamps. A pool formed from the surrounding tissues was filled with warm Tyrode solution. Pool temperature was maintained at 38 °C with a heating coil. At the end of the experiment the animal was killed with an overdose of barbiturate.
Placement of stimulating electrodes and identification of lamina I STT cells
An array of six bipolar stimulating electrodes (NE-100; Rhodes Medical Instruments, Woodland Hills, CA, USA) was inserted into the right thalamus to activate lamina I STT neurones antidromically. The positioning of the array was determined by electrophysiologically mapping the boundaries of the somatosensory thalamus, and by locating the small group of cells in the dorsomedial aspect of the ventral posterior medial nucleus (dmVPM) that are responsive to cooling of the ipsilateral tongue (Landgren, 1960), as described previously (Craig et al. 2001; Andrew & Craig, 2002). The site of these cooling-responsive units allowed the intended position of the array to be extrapolated, based on prior anterograde tracing and antidromic mapping studies (Craig, 1991; Craig & Dostrovsky, 2001), and in selected cases the positions of the electrode tips were confirmed histologically. The electrodes were arranged linearly in the same antero-posterior plane and they were separated by 1 mm medio-laterally. The tips of the medial two electrodes targeted nucleus submedius (Sm), the third electrode targeted the ventral periphery of the basal part of the ventral medial nucleus (VMb), the fourth electrode was aimed at the cooling-responsive zone in dmVPM, the fifth electrode targeted the ventral posterior inferior nucleus (VPI), and the final electrode targeted the ventral periphery of the ventral posterior lateral nucleus (VPL; Craig, 1991; Craig & Dostrovsky, 2001). Single lamina I STT neurones were recorded in the L7 and S1 segments of the left side of the spinal cord using platinum-plated, glass-insulated tungsten microelectrodes (15 μm tips). Units were identified as spinothalamic neurones by their antidromic responses to electrical stimulation of the contralateral thalamus with the implanted electrode array using previously described criteria (Craig & Dostrovsky, 2001; Craig et al. 2001; Andrew & Craig, 2002). Thus, all neurones displayed a constant latency, all-or-none response to a suprathreshold antidromic stimulus, they all showed one-for-one following of a train of six antidromic stimuli at 250 Hz and all of them showed collision between antidromic and orthodromic impulses (Fig. 1).
Figure 1. Identification of lamina I STT neurones.
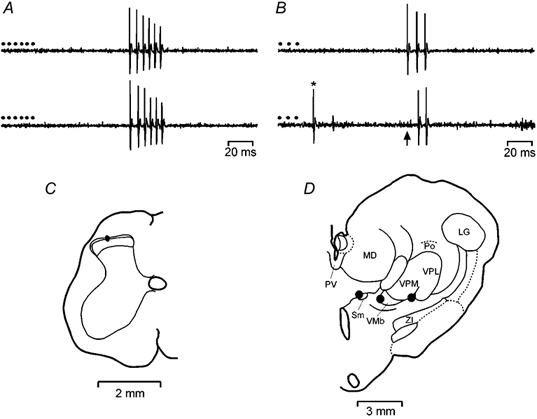
Representative responses from a single nociceptive-specific spinothalamic lamina I neurone. A, pair of records showing one-for-one following of a train of 6 antidromic shocks (•, 500 μA, 2 ms, 250 Hz) delivered from the stimulating electrode in the contralateral submedial nucleus. The conduction distance was 310 mm. Note the reduction in action potential amplitude that is characteristic of lamina I neurones at high discharge frequencies. B, collision of the first impulse in a train of 3 antidromic action potentials (150 Hz) due to an orthodromic impulse (*) occurring within the critical interval. The arrow indicates the point at which the first antidromic response would have occurred. C, location of the recording site of the neurone in lamina I of the L7 segment of the spinal cord. D, reconstruction of the contralateral thalamus showing the effective sites for antidromic activation (•). LG, lateral geniculate n.; MD, medial dorsal n.; Po, posterior n.; PV, paraventricular n.; Sm, submedial n.; VMb, basal part of the ventromedial n.; VPL, ventral posterior lateral n.; VPM, ventral posterior medial n.; ZI, zona incerta.
Classification of lamina I STT neurones
Each neurone isolated was classified using the following forms of cutaneous stimulation: cooling with a beaker of wet ice, innocuous brushing, blunt pressure, pinching with forceps, radiant warming and noxious heating, as in prior studies (e.g. Craig et al. 2001; Andrew & Craig, 2002). Neurones maximally responsive to innocuous cooling or warming and insensitive to other stimulus modalities were classified as cool or warm thermoreceptive cells, respectively (Andrew & Craig, 2001b). Units that responded to noxious mechanical and/or noxious heat stimuli, but not to innocuous or noxious cold stimulation, were classified as nociceptive-specific (NS). Cells that responded phasically to innocuous cooling stimuli and tonically to noxious cold stimuli, and that were also responsive to noxious mechanical and noxious heat stimuli were classified as polymodal-nociceptive, or HPC, cells (for heat, pinch and cold). There are a few ‘wide dynamic range’ neurones in lamina I of the cat's spinal cord, but these cells do not project as far as the thalamus (Light et al. 1993; Craig & Serrano, 1994; Wilson et al. 2002), and none were identified in the present experiments.
Unit characterization
Nociceptive neurones were further characterized using quantitative thermal (see Craig et al. 2001) and mechanical stimuli. Prior to quantitative study the background discharge rate of each cell was recorded for 2 min in the absence of stimulation. The extent of each neurone's receptive field was mapped after this period using either a beaker filled with wet ice, or a series of pinches applied manually with smooth tipped forceps. Intense heat and pinching with serrated forceps were avoided to prevent nociceptive sensitization. During quantitative evaluation, the unit's waveform was monitored intermittently using antidromic stimulation to ensure that recordings from the same cell were maintained throughout the characterization period. Controlled thermal stimuli (20 s duration) were applied with a thermoelectric Peltier element (area 9 cm2) under feedback control. Standard cooling and heating protocols were used, as in prior studies (Craig & Serrano, 1994; Craig et al. 2001; Craig & Dostrovsky, 2001). Thus the cooling protocol was a ‘descending staircase’ paradigm delivered from a baseline of 34 °C to a final skin-thermode interface temperature of 12.5 °C in 4 °C steps, and the heating protocol consisted of individual ‘ramp-and-hold’ temperature steps from a baseline of 34 °C to final interface temperatures of 42-57 °C in 4 °C steps (see Fig. 5).
Figure 5. Differentiation of NS and HPC lamina I STT neurones.
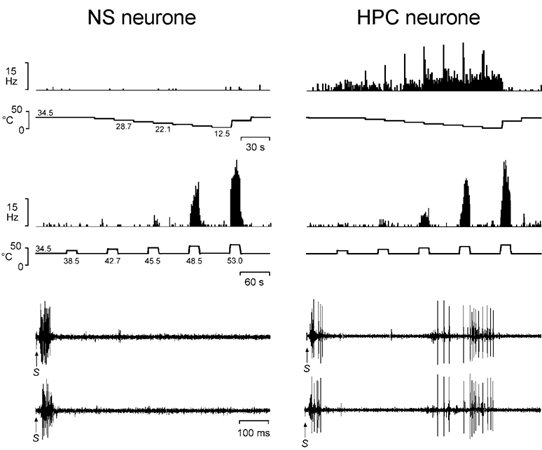
Representative histogrammed responses (1 s bins) from a single NS neurone and a single HPC neurone to stimulation of their receptive fields with graded cooling and graded heating stimuli. Also shown are the responses of the same cells to two bipolar intracutaneous electrical stimuli (1 mA, 1 ms) that were applied with a pair of needle electrodes inserted into the unit's innervation territory. Note the absence of C-fibre inputs to the NS neurone, and the robust, time-locked (monosynaptic) C-fibre inputs to the HPC neurone. S indicates the stimulus artefact. The peripheral conduction distances were 360 mm for both units.
A unit's receptive field was mapped with calibrated nylon (von Frey) monofilaments to determine the most sensitive region of its innervation territory. Mechanical thresholds were defined as the minimum stimulus intensity that evoked a response from the unit in 3 out of 5 monofilament applications. The controlled, quantitative mechanical stimuli were always applied to the zone of the receptive field that had the lowest von Frey threshold, and repeated stimuli were applied at the same spot. Usually, only one unit was characterized per experiment using a complete range of thermal and mechanical stimuli, due to the cumulative sensitizing effects of repeated noxious stimulation. In five cases, however, two cells were studied in the same experiment, with the two units studied having non-overlapping receptive fields.
Mechanical stimulation
For the present experiments, mechanical stimuli were applied with a custom designed, microprocessor-controlled servo-motor that was built by a local engineering company (Delta Technology, Tempe, AZ, USA). The motor was attached to a worm-gear mechanism that drove a probe against the skin of the animal's hind paw. The motor could obtain rapid skin displacement over a 20 mm range and it could apply stimulus intensities of up to 1000 g with an accuracy of 1 g. An in-line strain gauge (model GSO 1K; Transducer Technologies, Temecula, CA, USA) was used to obtain an analog record of the stimulus intensity, and a calibrated linear potentiometer provided records of probe displacement. The output of these sensors was also used for feedback control in either constant force or constant displacement modes, respectively. In the present experiments only force feedback control was used as compressive force is thought to be the adequate stimulus for activating cutaneous nociceptors (Garell et al. 1996; Khalsa et al. 2000). Examples of force and displacement records from a typical force-feedback controlled trial are shown in Fig. 2. The stimulator was attached to a three-axis micromanipulator on a universal arm that enabled precise positioning of the probe tip over the receptive field of the neurone under investigation.
Figure 2. Example of force and displacement during force-feedback controlled stimulation.
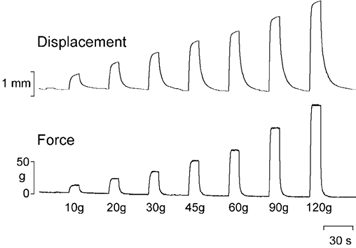
Simultaneous records of applied force and probe displacement during the application of a typical series of force-feedback controlled stimuli. Note that the force was maintained during the stimuli, whereas probe displacement continued to increase due to the compliance of the underlying tissues.
Each unit studied was characterized by recording its responses to a sequence of forces of 10, 20, 30, 45, 60, 90 and 120 g applied with different sized probes, to enable comparison of the results with prior primary afferent and psychophysical studies (Greenspan & McGillis, 1991, 1994; Garell et al. 1996; Andrew & Greenspan, 1999). The stainless steel probes were cylindrical with right-angled tips that were polished flat and they were applied perpendicular to the skin surface to prevent edge effects. The stimuli were applied as ‘ramp-and-hold’ forces (ramp rate 75 g s−1) from a resting intensity of 1-2 g, and they were 10 s in duration, with an interstimulus interval of 30 s. Stimulus blocks were separated by 15 min to mitigate the effects of sensitization and/or fatigue, and to allow the skin to fully recover from the indentations produced by the probe tips (Khalsa et al. 1997). To investigate the encoding of probe size, the stimulus series were repeated with interchangeable probes of different tip areas. In 12 initial experiments five probes were used, having contact areas of 5.0, 1.0, 0.5, 0.25 and 0.1 mm2, and each unit was tested twice, first using the probes in sequence largest to smallest (5.0 → 0.1 mm2) and then again in reverse order (Garell et al. 1996). However, this protocol resulted in a cumulative sensitization due to repeated testing with noxious stimuli, such that by the end of the second series of probes all of the units showed significantly greater responses to the large (5.0 and 1.0 mm2) probes and six of them had become responsive to innocuous brushing stimuli. Therefore in the subsequent 22 experiments only the 5.0, 0.5 and 0.1 mm2 probes were used, and they were applied just once each in order of descending contact area (cf. Cervero et al. 1988).
For six units, the effects of interstimulus interval were investigated using pairs of stimuli, a conditioning stimulus and a test stimulus, which were separated by a systematically varied interval of 15, 30, 60, 150 or 300 s (Slugg et al. 2000). Both of the stimuli were of identical intensity (60 g) and duration (10 s), they were applied with a probe of 0.1 mm2 contact area and trials were separated by 15 min. Stimulus trials were presented in ascending order of interstimulus interval (15 → 300 s). These experiments were performed on units that had previously been characterized with controlled thermal stimuli and the full series of mechanical stimuli applied with all three probes sizes.
Anaesthesia with a combination of α-chloralose and urethane produced bursting responses during the noxious heat characterization of 4/5 nociceptive lamina I STT neurones that were tested under this regimen. The cold- and mechanically evoked responses of these cells were similar to data obtained from three other units in other experiments in which urethane was omitted, and therefore they were included in the analyses performed. However, urethane was discontinued in the remaining experiments, and small doses of pentobarbital were used instead, which eliminated the bursting.
After mechanical characterization of a cell was completed the conduction velocities of the afferent fibres supplying it were determined by intracutaneous electrical stimulation. Graded bipolar stimuli (1 ms duration, 0.25 Hz) were applied via a pair of needle electrodes inserted into the unit's receptive field. The latencies of different components of the inputs to a neurone were recorded from oscilloscope traces and the conduction distance was estimated by adapting a suture thread to the approximate course of the peripheral nerve that contained the unit's afferent axons; this was always the tibial nerve. Recording sites of selected neurones were marked with electrolytic lesions (+20 μA, 10 s). Segments of spinal cord containing the lesions and thalamus blocks containing the tracks of the stimulating electrodes were fixed in 10 % buffered formalin, and the recording and stimulating sites were identified in 50 μm transverse sections that were stained with thionin.
Data capture and analysis
Electrophysiological data were displayed using conventional oscilloscopic and audio methods. The data were also digitized with a computer interface (Power1401; Cambridge Electronic Design, Cambridge, UK) for later off-line analysis. Neural records were sampled at 25 kHz, and stimulus records were sampled at 1 kHz. For data analysis, the average discharge rate during a stimulus was computed by dividing the total response, beginning at stimulus onset, by the stimulus duration. Discharge rates were not corrected by subtracting the background firing rate of a cell from its evoked response because there is evidence that the ongoing discharge is of biological significance (Andrew & Craig, 2002). Statistical analyses were performed with either parametric or non-parametric tests as appropriate. Trend analysis (a repeated measures ANOVA that included a specific test for a linear trend) was used to evaluate the effects of increasing stimulus intensity on neuronal discharge. Stimulus-response functions were compared using 2- or 3-factor analysis of variance (ANOVA) with repeated measures on 1 or 2 factors (stimulus intensity, probe size). A k-means cluster analysis was used to identify sub-classes of neurones, and factor analysis was used to isolate features that distinguished groups of neurones based on the Euclidian separations that result from linear combinations of their maximum mechanical, heat and cold responsiveness. All statistical analyses were performed with the program Statistica (Statsoft; Tulsa, OK, USA), and P values < 0.05 were considered significant.
Results
General properties of nociceptive lamina I STT neurones
Recordings were made from 125 lamina I STT neurones in the present experiments. Based on their responses to thermal and mechanical stimuli, 49 were classified as thermoreceptive-specific neurones (44 cool, 5 warm), 33 as nociceptive-specific (NS) neurones and 43 as polymodal-nociceptive (HPC) neurones. Complete quantitative data using controlled thermal and mechanical stimuli were obtained from 39 nociceptive neurones: 20 NS cells and 19 HPC cells; partial observations were made on six other units (4 NS, 2 HPC), which were nonetheless consistent with the results obtained from neurones that were fully characterized.
The receptive fields of all of the units studied quantitatively were on the ventral hind paw. Of the 20 NS neurones, 16 were responsive to both noxious mechanical and noxious heat stimuli, and the remaining four responded only to noxious mechanical stimulation. All of the HPC neurones responded to noxious heat, pinching and to noxious cold stimuli, albeit to varying degrees (Craig et al. 2001). The central conduction velocities and ongoing discharge rates of NS and HPC neurones were consistent with our earlier studies (Andrew & Craig, 2001a; Craig et al. 2001), thus the mean conduction velocity of the NS cells (3.1 m s−1, s.d. 1.3; range 1.8-4.1) was significantly slower (P < 10−4, unpaired t test) than the mean conduction velocity of the HPC neurones (5.7 m s−1, s.d. 2.0; range 2.5-10.3). Also, when first isolated the mean background (ongoing) activity level of the NS neurones (mean 0.30 impulses s−1, s.d. 0.60; range 0-1.0) was significantly lower (P < 0.02, unpaired t test) than that of the HPC neurones (mean 0.75 impulses s−1, s.d. 0.51; range 0-2.3).
Receptive fields of NS neurones were typically restricted to just one or two toes, and included both hairy and glabrous skin, whereas those of HPC neurones usually extended over all of the glabrous skin of the hind paw, and often covered half of the plantar foot. These observations are consistent with earlier reports (Craig & Kniffki, 1985; Craig & Serrano, 1994; Craig et al. 2001). All of the stimulating sites in the thalamus were effective at antidromically activating lamina I STT neurones. Thresholds for antidromic activation were generally in the range 200-500 μA, 2 ms when the stimulating array was well positioned, but in some experiments when the array was not so well positioned thresholds could be as high as 1 mA. Individual units were usually activated by several of the thalamic electrodes, typically those in VMb, VPI and/or Sm, but similar to prior reports (Craig et al. 2001; Craig & Dostrovsky, 2001; Andrew & Craig, 2002), there were no significant differences between the thalamic projection patterns of NS and HPC neurones (P > 0.2, chi squared test).
Effects of interstimulus interval and response reproducibility
The responses of nociceptive lamina I STT neurones to mechanical stimulus sequences were generally similar if the stimuli were applied sparingly and with a sufficiently long intertrial interval to mitigate the effects of fatigue. Six neurones (3 NS, 3 HPC) were tested to determine how their responses were influenced by a preceding mechanical stimulus by using paired stimuli that were separated by a systematically varied interstimulus interval (see Methods). Fatigue and sensitization are well known features of peripheral nociceptors (Campbell & Meyer, 1996; Slugg et al. 2000), but little is known of how they affect nociceptive processing by central neurones. The average responses of the six neurones tested with this stimulus interaction protocol are shown in Fig. 3A. Responses were computed as percentages by dividing the response to the test stimulus by the response to the immediately preceding conditioning stimulus. As can be seen from this plot, for stimuli separated by less than 150 s there was significant fatigue in the response to the second stimulus for these six nociceptive lamina I STT neurones (P < 0.05, Mann-Whitney U test). The maximum fatigue was observed with the shortest interstimulus interval (15 s), and the amount of fatigue became smaller as interstimulus interval increased. Although the precise interstimulus interval needed to avoid fatigue was not determined, it was between 60 and 150 s. A- and C-fibre nociceptors differ in their susceptibility to fatigue (Slugg et al. 2000), and NS and HPC neurones may show similar differences, but because of the small sample size the units were grouped together for analysis.
Figure 3. Fatigue and response reproducibility in lamina I STT neurones during mechanical stimulation.
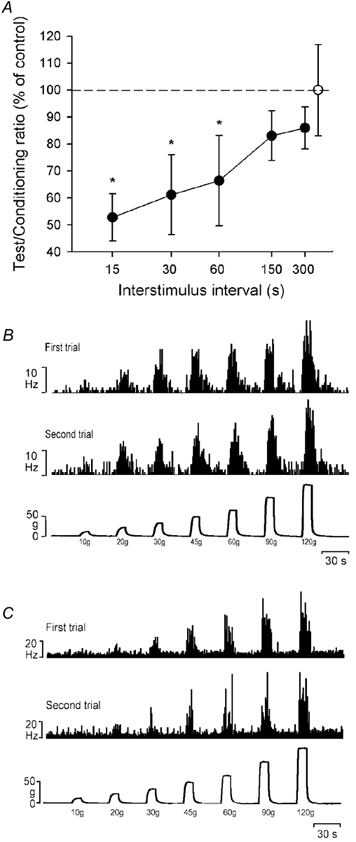
A, population response of 6 neurones (3 NS, 3 HPC) to pairs of stimuli (60 g, 10 s applied with 0.1 mm2 probe) that were varied systematically with respect to the interstimulus interval. The open symbol (mean ± 1 s.d.) shows the variation in the normalized response to the conditioning (first) stimulus. Filled symbols (means ± 1 s.d.) show the response to the test (second) stimulus expressed as a percentage of the response to the conditioning stimulus plotted against the log of the interstimulus interval. *P < 0.05 when compared to the conditioning stimulus (Mann-Whitney U test). The dotted line indicates the baseline. B, histogrammed responses (1 s bins) of a single HPC lamina I STT neurone to force-feedback controlled mechanical stimuli applied with a probe of 0.1 mm2 contact area. Two trials of the same stimulus series that were separated by 15 min are shown. C, response of a single NS lamina I STT neurone to the same stimuli, but in this case the stimulus trials were separated by only 5 min.
To investigate response reproducibility we characterized 12 neurones (3 NS, 9 HPC) using two series of five probes of contact areas of 5.0, 1.0, 0.5, 0.25 and 0.1 mm2, first in sequence largest to smallest, and then again in reverse (cf. Garell et al. 1996). For these trials, we first tested the effects of the intertrial interval. In Fig. 3B two records from a cell evaluated with the 0.1 mm2 probe are shown. The first record is the fifth in a sequence of 10 mechanical stimulus trials and the second record, obtained 15 min later, was the subsequent sixth trial in the sequence. For comparison, in Fig. 3C the responses of a different unit to the same series of stimuli are shown, but with the two stimulus series separated by 5 min instead of 15 min. As can be seen, the shorter intertrial interval of 5 min (Fig 3C) was associated with relatively poorer response reproducibility when compared to the longer 15 min intertrial interval (Fig. 3B).
To investigate the effects of repeated stimulation we compared the families of curves evoked by all five probes when they were applied in order of descending contact area (first series) to the curves that were obtained when the probes were re-tested in order of ascending contact area (second series). We used three-factor, repeated measures ANOVA to evaluate the effects of stimulus order (first or second series) as well as force and probe size. This analysis showed a significant effect of stimulus presentation order (i.e. responses to the second series were significantly greater than responses to the first series; P < 0.04) and also an interaction between series number, probe size and force (P < 0.005). Further analysis showed that the effect of series number could be attributed to an increased response to the second application of the 1.0 and 5.0 mm2 probes, i.e. the last two trials in the sequence (P < 0.02, two-factor ANOVA). Hence the sensitization was likely to be a cumulative effect.
Thus the need to obtain complete data was a compromise between the number of stimuli applied (and therefore stimulus intensity and the number and size of probes tested), the interval between successive stimuli and the intertrial interval between stimulus blocks as well as being constrained by the length of time that a unit could be cleanly isolated. Therefore, in most (22/34) of the experiments each unit was characterized with only three probes (5.0, 0.5 and 0.1 mm2) that were presented just once each with an interstimulus interval of 30 s and an intertrial interval of 15 min. For the 12 units tested with two series of five probes, we used the responses evoked by the first set of probes for quantitative analysis.
Population response to graded mechanical stimulation
An example of a single unit's response to controlled mechanical stimuli is shown in Fig. 4A, and the mean stimulus-response curves for all 39 spinothalamic lamina I units tested with all three probe sizes are shown in Fig. 4B. Nine units (8 NS, 1 HPC) were characterized by applying controlled mechanical stimuli to hairy skin sites, where their thresholds to von Frey monofilaments were lowest, and the remaining 30 cells (12 NS, 18 HPC) had the lowest threshold region of their receptive field on glabrous skin.
Figure 4. Encoding of mechanical stimulus intensity and probe size by lamina I STT neurones.
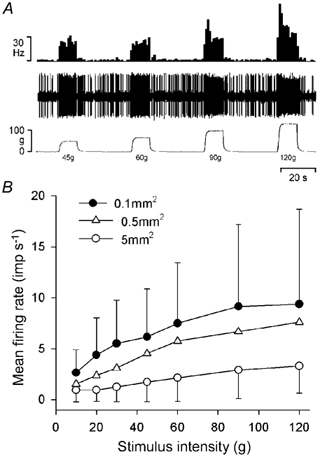
A, response of a single NS neurone to 4 constant-force mechanical stimuli applied with a 0.1 mm2 probe. The traces are, from the top downwards, the histogrammed discharge of the unit (1 s bins), the neural recording and the stimulus intensity. B, mean response of the population of lamina I STT neurones (n = 39) to graded mechanical stimulation (10-120 g) with probes of 5.0, 0.5 and 0.1 mm2 contact area. Symbols are means ± 1 s.d.
Trend analysis showed that the neuronal discharge of the entire population increased with increasing stimulus intensity (P < 10−5 for each probe size, ANOVA). Mean thresholds, identified with Tukey's test post hoc, were 45 g for the 5 mm2 probe, 30 g for the 0.5 mm2 probe and 20 g for the 0.1 mm2 probe (P < 0.03 or better for each probe size). The expected relationship between neuronal discharge and probe size was also found, as the stimulus-response functions for the 5, 0.5 and 0.1 mm2 probes were all significantly different from each other (P < 10−5, two-factor ANOVA; P < 0.02 or better Tukey's test post hoc). That is, the mean firing rate for a given stimulus applied with the 0.1 mm2 probe was greater than that evoked by the same force applied with either the 0.5 or the 5.0 mm2 probe, and the response to the same force applied with the 0.5 mm2 probe was greater than that evoked by the 5.0 mm2 probe. There was also an interaction between stimulus intensity and probe size (P < 10−5, 2-factor ANOVA), indicating that as stimulus intensity increased and probe size decreased the slope of the stimulus-response function increased. These data are consistent with encoding of both stimulus intensity and probe size by primary afferent nociceptors supplying hind paw skin in cats and rats (Garell et al. 1996; Andrew & Greenspan, 1999).
As can be seen from Fig. 4B, neuronal responses increased approximately linearly with increasing stimulus intensity over the range 10-120 g, although it appears that the stimulus-response curve plateaued at the highest intensity tested for the 0.1 mm2 probe. Linear regressions of the population stimulus-response curves using the y = ax + b model yielded slopes of 2.4 Hz (100 g)−1 for the 5.0 mm2 probe (r = 0.39), 5.6 Hz (100 g)−1 for the 0.5 mm2 probe (r = 0.49) and 6.0 Hz (100 g)−1 for the 0.1 mm2 probe (r = 0.35). The 95 % confidence limits of the regression span a width of 70 g for the 5.0 mm2 probe, 35 g for the 0.5 mm2 probe and 30 g for the 0.1 mm2 probe, indicating that these are the smallest forces that this population of lamina I STT neurones can discriminate. Thus, as a population the sample of lamina I STT neurones obtained can discriminate both stimulus intensity and stimulus area, although there were differences in neuronal encoding properties related to the classification of the units. These are described later. Normalizing the response of each neurone to its own peak discharge rate reduced the effect of differences between individual unit's absolute discharge rates, and linear regressions of the stimulus-response curves yielded slopes of 28 % (100 g)−1 for the 5.0 mm2 probe (r = 0.57), 46 % (100 g)−1 for the 0.5 mm2 probe (r = 0.74) and 54 % (100 g)−1 for the 0.1 mm2 probe (r = 0.87). The 95 % confidence limits of the regression span a width of 24 g for the 5.0 mm2 probe, 13 g for the 0.5 mm2 probe and 10 g for the 0.1 mm2 probe.
Differentiation of NS and HPC lamina I STT neurones
Quantitative cooling and heating stimuli were used to distinguish NS and HPC neurones (Fig. 5). The stimulus- response functions of the NS and HPC neurones differed for cooling (Craig et al. 2001), since none of the NS neurones responded to this stimulus modality. Consistent with prior studies, there was no significant difference between the heat-evoked stimulus-response curves of NS and HPC cells (P > 0.7, 2-factor ANOVA; Craig et al. 2001). The median threshold of the NS neurones (42.7 °C) tended to be lower than that of the HPC neurones (45.5 °C), although the difference between the two populations did not quite achieve significance in the present sample (P > 0.1, Mann-Whitney U test). We have previously observed in a substantially larger sample of units that the heat thresholds of NS neurones are significantly lower than those of HPC neurones (Craig et al. 2001).
Intracutaneous electrical stimulation was used to determine the conduction velocities of the afferent inputs to 23 lamina I STT neurones (14 NS, 9 HPC). Of 14 NS cells, eight received time-locked (monosynaptic) inputs from A-fibres only, and not from C-fibres. The conduction velocities of the A-fibres were in the range 6.2-27.7 m s−1, indicating that they were lightly myelinated Aδ axons. The remaining six NS neurones received inputs from both Aδ- (10.0- 25.7 m s−1) and C-fibres (0.7-1.3 m s−1). For these units, a single suprathreshold electrical stimulus typically evoked a robust, stable latency A-fibre response (mean no. of impulses = 5, s.d. 2; range 3-10), whereas the C-fibre response was typically weaker (mean no. of impulses = 2, s.d. 1; range 1-4). Additionally, the C-fibre responses were not observed following every stimulus: based on 10 consecutive stimuli delivered at 0.25 Hz, C-fibre responses were noted in 30-80 % of trials, and their latencies varied by up to 25 ms (‘jitter’). By counting all of the impulses evoked by a single electrical stimulus we calculated that for all 14 of the NS neurones tested, A-fibres accounted for, on average, 88 % of their output (range 55-100, s.d. 16) whereas C-fibres accounted for only 11 % of their output (range 0-45, s.d. 16).
In contrast, all nine of the HPC neurones tested received C-fibre (0.6-1.8 m s−1) input; 7 of the 9 received both Aδ- (8.1-21.8 m s−1) and C-fibre inputs, and two HPC cells received inputs exclusively from C-fibres. There were usually more C-fibre-evoked impulses (mean = 7, s.d. 3) than A-fibre-evoked impulses (mean = 2, s.d. 1; P < 0.002, unpaired t test), and the C-fibre responses had stable, time-locked latencies indicative of monosynaptic inputs. Considering all nine of the HPC neurones tested with electrical stimulation, A-fibres accounted for on average only 22 % of their output (range 0-40, s.d. 15) whereas C-fibres accounted for 78 % of their output (range 56-100, s.d. 16). These results are consistent with earlier studies of lamina I STT neurones (Craig & Kniffki, 1985) and unidentified superficial dorsal horn neurones (Fitzgerald & Wall, 1980).
Encoding of mechanical stimulus intensity and area by NS and HPC neurones
All of the NS and HPC neurones responded to noxious mechanical stimulation, albeit with varying sensitivity. Figure 6 and Figure 7 show the responses of four different NS neurones and four different HPC neurones to graded mechanical stimulation applied with probes of 5.0, 0.5 and 0.1 mm2. These examples are representative of the variety of responses observed with respect to thresholds, suprathreshold responsiveness and peak discharge rates. These examples show the variable presence of dynamic components of the response and the presence of after-discharges; most units also showed adaptation to a maintained suprathreshold mechanical stimulus (also see Figs 3B and C and 4A). As can be seen from these examples, NS neurones showed greater suprathreshold responsiveness than HPC neurones: the mean peak discharge rate of the NS neurones (15.3 impulses s−1, s.d. 10.6, range 4.1-51.2) was significantly greater than the mean peak discharge rate of the HPC neurones (6.8 impulses s−1, s.d. 4.2, range 1.4-15.7; P < 0.03, unpaired t test). The mean monofilament (von Frey) threshold of the NS neurones (56.5 g, s.d. 54.5, range 6.0-154.5) tended to be lower than that of the HPC neurones (78.7 g, s.d. 61.7, range 25.8-154.5), although not significantly so (P > 0.1, Mann-Whitney U test). However, there was a strong negative correlation (r = 0.55; P < 10−3 Spearman's test) between the von Frey threshold of a unit and its peak discharge rate, such that neurones with lower thresholds had higher peak discharge rates. Based on the diameters of the monofilaments used in the current experiments, the mean threshold expressed as force per unit area was 138 g mm−2 for the NS neurones (range 28-265, s.d. 73), and 158 g mm−2 for the HPC neurones (range 56-265, s.d. 70).
Figure 6. Encoding of mechanical stimulus intensity and probe size by NS neurones.
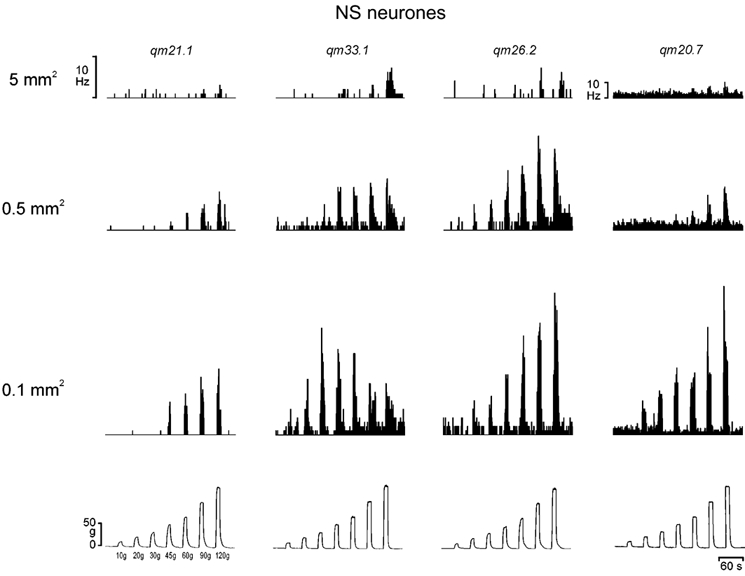
The histogrammed responses (1 s bins) of 4 individual NS lamina I STT neurones to graded mechanical stimulation with 3 different sized probes, representing the variety of response patterns observed. The records in each column are from the same cell, and an example of a standard force record is shown at the bottom of each column. Note the size of the scale bar for unit qm20.7.
Figure 7. Encoding of mechanical stimulus intensity and probe size by HPC neurones.
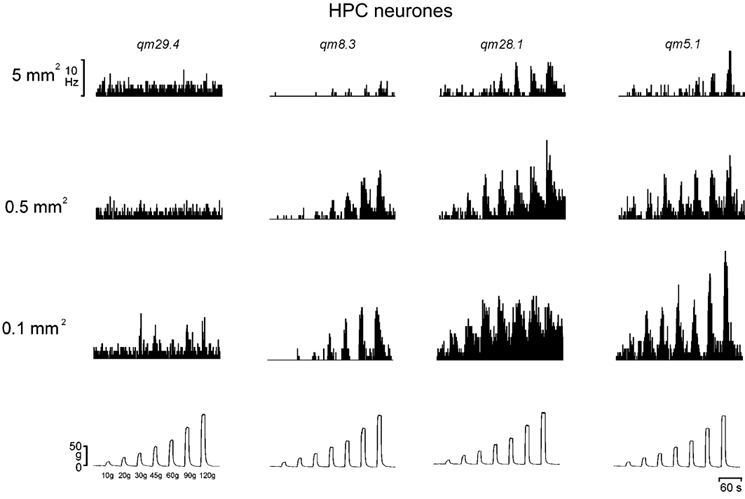
The histogrammed responses (1 s bins) of 4 individual HPC lamina I STT neurones to graded mechanical stimulation with 3 different sized probes, representing the variety of response patterns observed. The records in each column are from the same cell, and an example of a standard force record is shown at the bottom of each column.
Individual stimulus-response curves are shown for each of the NS (n = 20) and HPC (n = 19) neurones tested with all three probes in Fig. 8. Mean stimulus-response curves for each population are shown for all forces and probe sizes in Fig. 9 (upper panels). The discharge of NS neurones increased with a linear trend as stimulus intensity increased for all three probe sizes (P < 10−5, ANOVA). Thresholds, determined with Tukey's test post hoc, were 45 g for the 5.0 mm2 probe, 30 g for the 0.5 mm2 probe and 20 g for the 0.1 mm2 probe (P < 0.05 or better for each probe). The NS neurones differentiated all three probe sizes (P < 10−4, 2-factor ANOVA; P < 0.02 or better, Tukey's test post hoc), and there was also an interaction between force and probe size (P < 10−5, 2-factor ANOVA), indicative of the increasing slope. Similar results were obtained if the discharge rates of individual neurones were normalized to their own peak rate. Linear regressions of the individual stimulus-response curves using the y = ax + b model yielded slopes of 3.4 Hz (100 g)−1 for the 5.0 mm2 probe (r = 0.48), 7.6 Hz (100 g)−1 for the 0.5 mm2 probe (r = 0.59) and 10.2 Hz (100 g)−1 for the 0.1 mm2 probe (r = 0.55). The 95 % confidence limits of the regression span a width of 70 g for the 5.0 mm2 probe, 30 g for the 0.5 mm2 probe and 18 g for the 0.1 mm2 probe, indicating that these are the smallest forces that this population of NS neurones can discriminate. For normalized discharge rates, linear regressions yielded slopes of 31 % (100 g)−1 for the 5.0 mm2 probe (r = 0.47), 58 % (100 g)−1 for the 0.5 mm2 probe (r = 0.64) and 80 % (100 g)−1 for the 0.1 mm2 probe (r = 0.94). The 95 % confidence limits of the regression span a width of 31 g for the 5.0 mm2 probe, 16 g for the 0.5 mm2 probe and 11 g for the 0.1 mm2 probe.
Figure 8. Stimulus-response functions of NS and HPC neurones.
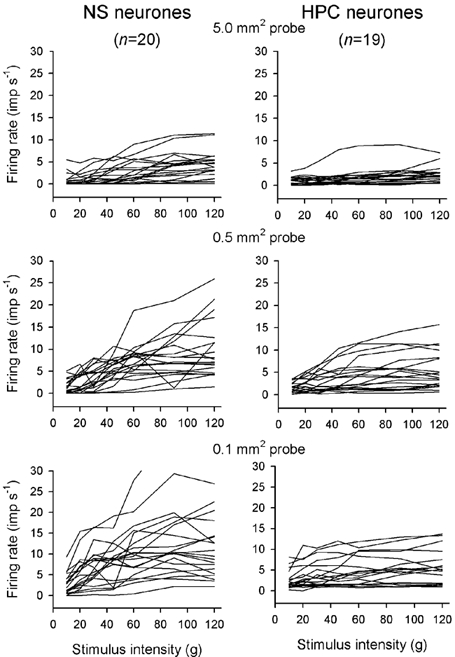
The individual response functions of all 20 NS neurones and all 19 HPC neurones to graded mechanical stimulation with all 3 probe sizes. The response of 1 NS cell has been truncated vertically for clarity (bottom left).
Figure 9. NS neurones encode mechanical stimulus intensity and probe size better than HPC neurones.
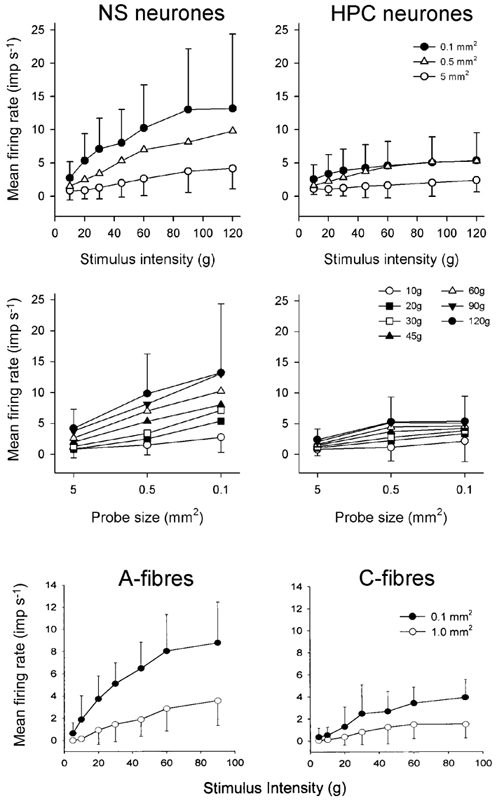
Mean population stimulus- response curves to graded mechanical stimulation (10-120 g) for NS (n = 20) and HPC (n = 19) neurones (top row). Three-factor, repeated measures ANOVA confirmed that NS neurones were more responsive than HPC neurones to mechanical stimulation (P < 0.02). The same data re-plotted with respect to probe size are shown in the middle row. For comparison, the stimulus-response curves of A- and C-fibre nociceptors to graded stimulation (10-90 g) with probes of 0.1 and 1.0 mm2 are shown (bottom row; reproduced from Andrew & Greenspan (1999) with permission).
The discharge of the HPC neurones also increased with increasing stimulus intensity for all three probes (P < 10−5, ANOVA), but their thresholds were 60 g for the 5.0 mm2 probe and 30 g for both the 0.5 mm2 probe and the 0.1 mm2 probe (P < 0.03 or better, Tukey's test post hoc). In contrast to the NS neurones, the HPC cells could only differentiate the largest (5.0 mm2) and smallest (0.1 mm2) probes (P < 0.006 2-factor ANOVA; P < 0.02 Tukey's test post hoc), as the stimulus-response curves for the 0.5 mm2 and 0.1 mm2 probes were not significantly different (P > 0.5, Tukey's test post hoc). Also, there was no interaction between force and probe size for the HPC neurones (P > 0.2). Similar data were also obtained from normalized discharge rates. Linear regressions of the absolute stimulus-response curves yielded slopes of 1.9 Hz (100 g)−1 for the 5.0 mm2 probe (r = 0.24), 4.0 Hz (100 g)−1 for the 0.5 mm2 probe (r = 0.38) and 2.9 Hz (100 g)−1 for the 0.1 mm2 probe (r = 0.26). The 95 % confidence limits of the regression span a width of 78 g for the 5.0 mm2 probe, 40 g for the 0.5 mm2 probe and 44 g for the 0.1 mm2 probe. For normalized discharge rates, linear regressions yielded slopes of 26 % (100 g)−1 for the 5.0 mm2 probe (r = 0.32), 49 % (100 g)−1 for the 0.5 mm2 probe (r = 0.57) and 53 % (100 g)−1 for the 0.1 mm2 probe (r = 0.56). The 95 % confidence limits of the regression span a width of 40 g for the 5.0 mm2 probe, 20 g for the 0.5 mm2 probe and 22 g for the 0.1 mm2 probe.
As is readily apparent in the population stimulus-response curves sizes shown in Fig. 9 (upper panels), the NS neurones encoded both stimulus intensity and area significantly better than the HPC neurones, based on the greater magnitude of the responses of NS neurones, and also the greater separation of the stimulus-response curves generated with different probe sizes. Three-factor, repeated measures ANOVA confirmed that unit classification was a significant factor effect (P < 0.02). Post hoc tests showed that NS neurones encoded stimulus intensity significantly better than the HPC neurones for both the 0.1 and 0.5 mm2 probes (P < 0.04 or better), though not for the 5.0 mm2 probe (P > 0.2). Identical results were obtained if normalized discharge rates were compared. These same data are shown re-plotted with respect to probe size in the middle panels of Fig. 9. It can be clearly seen that the NS neurones encode probe size better than the HPC neurones.
The responses of A- and C-fibre nociceptors to similar forces applied with probes of 1.0 and 0.1 mm2 contact areas (Andrew & Greenspan, 1999) are shown in the lower panels of Fig. 9 for comparison with the population stimulus-response curves of NS and HPC lamina I STT cells shown in the upper panels. The correspondence of the discharge of the NS population to that of the A-fibre nociceptors is unmistakable, and the responses of the HPC neurones are remarkably similar to those of the C-fibre nociceptors. The stimulus-response curves of the NS and HPC populations are compared to the psychophysical pain judgements in humans that were evoked with similar graded mechanical stimuli in Fig. 10. As can be clearly seen, the discharge of the NS neurones better matches the psychophysical data than the discharge of the HPC neurones, and the stimulus-response curve of the NS neurones follows a very similar trajectory to that of the psychophysical pain ratings.
Figure 10. The discharge of NS neurones better matches the psychophysics of mechanical pain than the discharge of HPC neurones.
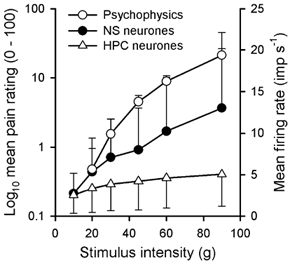
Mean population stimulus-response curves for NS (•) and HPC (▵) neurones evoked by the 0.1 mm2 probe. For comparison, the psychophysical pain judgments (○) reported by 12 human subjects evoked by brief (4 s), graded stimulation (5-90 g) with the same sized probe plotted on a log scale are also shown (adapted from Andrew & Greenspan (1999) with permission). Symbols are means ± 1 s.d. (•, ▵) and means ± 1 s.e.m. (○). The curves for the NS and HPC neurones have been truncated at 90 g.
Force-displacement curves of NS and HPC neurones that were obtained from records of probe displacement were compared, to test whether the differences between the mechanical encoding properties of these two groups of neurones could be attributed to systematic differences in the distribution of their receptive fields. Compliance could have been a confounding factor, since 8/20 NS neurones but only 1/19 HPC neurones had the controlled mechanical stimuli applied to a region of hairy skin, rather than to glabrous skin. Due to the proximity of the underlying bones, the hairy skin receptive fields would have been less compliant than glabrous skin receptive fields. Mean force- displacement curves generated with the 0.1 mm2 probe are shown for NS and HPC neurones in Fig. 11. As can be seen from this plot, these curves were practically identical and 2-factor, repeated measures ANOVA confirmed that there was no difference between the two groups of neurones (P > 0.8).
Figure 11. Differences in the mechanical responsiveness of NS and HPC neurones are not due to systematic differences in the compliance of their receptive fields.
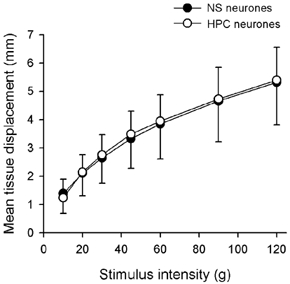
Force-displacement plots for NS and HPC neurones recorded during characterizations with the 0.1 mm2 probe. Two-factor, repeated measures ANOVA confirmed that there was no significant difference between tissue compliance for the 2 groups of cells (P > 0.8).
Identification of sub-groups of lamina I STT neurones with distinct mechanical encoding properties
Prior studies provided evidence that the NS and HPC categories of nociceptive lamina I STT neurones are robust and distinct, yet a comprehensive analysis of the quantitative response characteristics of 228 nociceptive cells revealed that some cells show ‘transitional’ responses not typical of the large majority of neurones in each category (Craig et al. 2001). A category-independent cluster analysis of the adaptation patterns of NS and HPC neurones to maintained mechanical stimuli corroborated this observation (Andrew & Craig, 2002). That analysis identified two partitions, one that showed maintained responses and another that showed adapting responses. These clusters corresponded remarkably well to the NS and HPC categories, respectively, but each partition did include a few cells of the other category. We speculated that more sophisticated physiological analyses might provide additional evidence that could differentiate such transitional cells.
Thus, in the present experiments we again performed a k-means cluster analysis of the stimulus-response curves of absolute firing rates that were evoked by graded stimulation with the 0.1 mm2 probe to determine whether neurones could be classified based on their mechanical encoding properties. Two partitions were identified (P < 10−3) that, similar to our prior study (Andrew & Craig, 2002), corresponded well to the NS and HPC categories. Thus, one partition comprised 14 NS neurones and 3 HPC neurones, and the other partition comprised 16 HPC and six NS cells. As well as showing distinct stimulus- response functions (Fig. 12), these two groups were also distinguished by their von Frey thresholds, as the mean monofilament threshold of the first cluster (35.5 g, s.d. 38.6, range 6.0-154.5; Fig. 12, left) was significantly lower than the mean threshold of the second cluster (94.8 g, s.d. 59.1, range 13.9-154.5; P < 10−3, Mann-Whitney U test; Fig. 12, right). In addition, the two groups showed differences in their cooling-evoked stimulus- response functions, consistent with the association of one group with NS cells and the other with HPC cells. However, the two clusters were not differentiated by their central conduction velocities (P > 0.4, unpaired t test), by their levels of background (ongoing) discharge (P > 0.2, unpaired t test) or by their projections to thalamus (P > 0.6, chi squared test). Up to two further partitions could be identified using cluster analysis that split the first two groups based on peak firing rates. Analyses based on normalized firing rates also identified up to four clusters of cells that were grouped by the shape of the stimulus- response curves, though their encoding curves based on absolute discharge rates did not differ (P > 0.9, 2-factor ANOVA; data not shown).
Figure 12. Classification of nociceptive lamina I STT neurones based on their mechanical responsiveness.
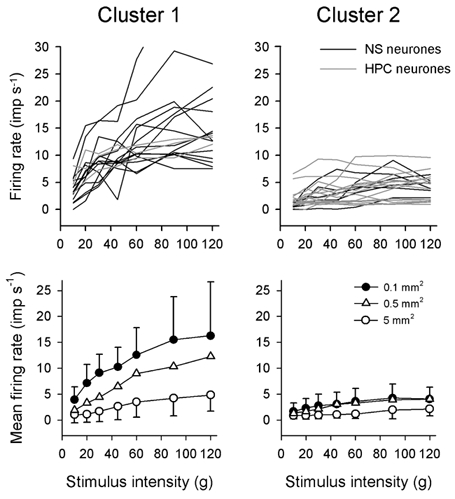
Individual (upper panel, 0.1 mm2 probe) and population (lower panel, all 3 probes) stimulus-response curves of the partitions identified by cluster analysis of responses to graded mechanical stimulation. The first cluster was composed of 14 NS neurones and 3 HPC neurones, and the second cluster was composed of 6 NS neurones and 16 HPC neurones (upper panel). The response of 1 NS cell in cluster 1 has been truncated vertically. Symbols are means ± 1 s.d.
To investigate whether any other quantitative measures of a unit's physiological properties could be used as predictors of its mechanical responsiveness, and therefore useful to identify neurones categorized as NS and HPC units with transitional characteristics, we used factor analysis to determine whether the mechanical responsiveness of a cell was correlated with either its cold or heat sensitivity. With this method the three-dimensional Euclidean separations of neurones that resulted from linear combinations of their peak discharge to mechanical, cooling and heating were computed and compared pairwise for each stimulus modality. Cold sensitivity was found to correlate inversely with mechanical responsiveness, as there was a weak negative correlation (r = 0.38; P < 0.004, Spearman's test) between peak mechanical discharge and peak cold discharge. In other words, neurones with high mechanical responsiveness tended to have low cold responsiveness, and vice versa. This is consistent with the general observation that cold-sensitive HPC neurones were generally poorer at encoding mechanical stimulus intensity and area than cold-insensitive NS neurones. Further corroboration was provided by observations from the 3 HPC neurones that were partitioned with the 14 NS neurones by the cluster analysis. These units had high mechanical sensitivity and low cold sensitivity; their peak mechanically evoked discharge frequencies were 13.7, 13.3 and 12.1 impulses s−1, and their peak discharge frequencies to cold stimuli were 5.9, 9.1 and 7.0 impulses s−1. These cold-evoked peak rates are all below the average peak firing rate of the HPC population (see Fig. 10A in Craig et al. 2001). Thus, the three transitional HPC cells that were partitioned with the NS-like group by the cluster analysis had response characteristics that resembled more the NS neurones. Conversely, the six NS cells that were partitioned with 16 HPC neurones encoded stimulus intensity and probe size relatively poorly (Fig. 12, right), and they were more comparable to HPC neurones than to NS neurones, even though none of the NS neurones responded to cooling stimuli. The high von Frey thresholds (mean 103.6 g, s.d. 60.3; range 13.9-154.5) of this sub-set of NS neurones similarly reflected their poor mechanical encoding properties. In contrast, there was no correlation between a cell's peak response to noxious heat and its peak response to mechanical stimulation (r = 0.03).
Discussion
This is the first report to characterize central nociceptive neurones using mechanical stimuli that were systematically varied with respect to both stimulus intensity and stimulus area. A key technical requirement for the present study was a mechanical stimulator that could apply constant-intensity noxious forces over a sufficiently large range of displacements to accommodate the variety of tissue compliances that are found in the cat's hindlimb. Stimulators based on the design of Chubbuck (1966) are able to deliver precisely controlled constant-displacement stimuli, and they provide excellent stimulus control for studying tactile sensations and mechanoreception. However, this type of stimulator can only apply noxious intensity stimuli at sites where the tissue compliance is low, such as the dorsum of the human finger or when small contact area probes are used (Greenspan & McGillis, 1991, 1994), and these limitations have restricted their use in studying the neural mechanisms of mechanical nociception (Willis et al. 1975). Others have used a graded series of von Frey monofilaments as a semi-quantitative measure of mechanical responsiveness (e.g. Price et al. 1978; Tanner et al. 1998), but there is an uneven trade-off between force and surface area as the filaments become stiffer, and edge effects are generated during bending of the stiffer filaments.
Using a custom-designed, force-feedback-controlled stimulator and interchangeable probes we have shown that the nociceptive-specific class of spinothalamic lamina I neurones encodes stimulus intensity and area significantly better than the other main class of nociceptive lamina I STT neurones, the polymodal-nociceptive cells. In the following text the encoding properties of these two classes of neurones are considered in light of prior data obtained from previous primary afferent, central neurone and psychophysical experiments.
Comparison with primary afferent nociceptors
Although there are only a few reports that have characterized cutaneous nociceptors using force-controlled stimuli (Handwerker et al. 1987; Garell et al. 1996; Khalsa et al. 1997, 2000; Andrew & Greenspan, 1999; Slugg et al. 2000), the consensus of those studies performed in vivo is that Aδ nociceptors show greater mechanical responsiveness than do C-fibre nociceptors, and Aδ nociceptors also encode stimulus area better than C-fibre nociceptors (Handwerker et al. 1987; Garell et al. 1996; Andrew & Greenspan, 1999; Slugg et al. 2000). Our present observations are consistent with those prior studies, since NS neurones, which receive strong Aδ inputs and weak or absent C-fibre inputs encode both stimulus intensity and stimulus area significantly better than HPC neurones, which receive strong, monosynaptic C-fibre inputs and weaker or absent Aδ inputs. It is possible that the C-fibre inputs to neurones were underestimated, due to A-fibre mediated inhibition (Handwerker et al. 1975), but the use of high-intensity electrical stimulation maximized the possibility of documenting unmyelinated inputs, and also the responses of NS neurones to graded mechanical stimulation were very similar to those of A-fibre nociceptors rather than those of C-fibres.
A-fibre nociceptors have been divided into two sub-types based either on their adaptation profile to a 2 min mechanical stimulus in rats (rapidly or slowly adapting; Andrew & Greenspan, 1999), or based on their von Frey thresholds in monkeys (mechanically sensitive or mechanically insensitive with the dividing value being 6 bars (60 g mm−2), Meyer et al. 1991; Davis et al. 1993). The slowly adapting class of A-fibre nociceptors have monotonic stimulus-response functions, whereas the stimulus-response functions of the rapidly adapting class of A-fibre nociceptors plateau at intensities close to human mechanical pain threshold (30-45 g at a contact area of 0.1 mm2; Greenspan & McGillis, 1991, 1994; Andrew & Greenspan, 1999). It is tempting to speculate that the NS neurones receive their A-fibre inputs predominantly from the slowly adapting type of A-fibre nociceptors, since the shape of their respective stimulus-response functions are very similar (compare Fig. 4A in Andrew & Greenspan, 1999 with Fig. 9, top left). On the other hand, the stimulus-response functions of HPC neurones closely resemble those of C-fibre nociceptors (Fig. 9, right), although a contribution from the rapidly adapting class of A-fibre nociceptors cannot be ruled out. Nonetheless, the mechanical responses of the transitional neurones suggest that these patterns of primary afferent convergence onto distinct classes of lamina I STT neurones are not rigid. This might be expected of a developmentally defined neural system, i.e. one where the sensory experience fine-tunes the development of synaptic connections.
Comparison with prior central neurone studies
The quantitative data reported in the present study are comparable with prior studies that used manually applied, force-monitored mechanical stimuli to characterize lamina I STT neurones in the cat (Craig et al. 2001) and lamina I spinoparabrachial neurones in the rat (Bester et al. 2000), in terms of thresholds and suprathreshold sensitivity. Thresholds determined with pinch stimuli applied with forceps of 3 mm2 contact area were 100 g mm−2 for NS neurones and 130 g mm−2 for HPC neurones (Craig et al. 2001), which are similar to those reported here determined with von Frey monofilaments. Data presented for nociceptive spinoparabrachial neurones (Bester et al. 2000) are also comparable, despite technical differences. Similarly, the stimulus-response functions of STT and spinoparabrachial lamina I neurones reported previously are monotonic over a comparable range despite differences in the stimulus intensities applied and the sizes of the probes used.
In general, prior experiments have not distinguished differences in the mechanical encoding properties of different classes of central nociceptive neurones, because only a single large probe was used (Cervero et al. 1988; Bester et al. 2000; Craig et al. 2001). Using a small probe (0.1 mm2 contact area) we previously showed that NS neurones encode the intensity of a 2 min mechanical stimulus better than HPC neurones; NS neurones also show a maintained response pattern that better matches the psychophysical judgments of the evoked pain sensations in humans (Andrew & Craig, 2002). However, manually applied, force-monitored pinch stimuli that were applied in an ‘ascending staircase’ manner with a large probe were not sufficient to reveal differences in the stimulus- response functions of these two classes of cells (Craig et al. 2001).
In contrast, the present experiments demonstrate that NS and HPC neurones do in fact encode both mechanical stimulus intensity and probe size differently, using small probes to reveal these differences. The differences between the encoding properties of NS and HPC neurones are consistent with their respective responses to Aδ- and C-fibre inputs, and the mechanical encoding properties of the respective peripheral nociceptors. Thus the NS neurones with their strong Aδ inputs, as expected, encoded stimulus intensity and probe size better than the HPC neurones with their strong C-fibre inputs.
By comparison, rat spinal neurones with unidentified projections have been classified as ‘good’ or ‘poor’ mechanical encoders based on either the shapes of their stimulus-response curves to three different intensity mechanical stimuli (Cervero et al. 1988), or on their ability to signal a step change in stimulus intensity (Laird & Cervero, 1991). Whilst there was a tendency for neurones with ‘good’ encoding properties to be in the superficial dorsal horn, and to receive inputs exclusively from peripheral nociceptors, there were no key features that distinguished neurones that were ‘good’ encoders from those that were ‘poor’ encoders. However, none of the neurones studied were identified as projection neurones, and as cold stimuli were not used in the characterization process, NS and HPC neurones were not differentiated.
Our prior study of the adaptation of NS and HPC neurones to a 2 min noxious mechanical stimulus indicated that NS neurones adapted significantly more slowly than HPC neurones (Andrew & Craig, 2002). A cluster analysis of the shape of the discharge profiles of all of the neurones, independent of classification, supported this conclusion, but there were a few HPC neurones that had mechanical responses that were more typical of most NS neurones and vice versa. Such transitional cell types were also observed in the current experiments, particularly in the stimulus- response curves evoked by the 0.1 mm2 probe. Furthermore, the results of factor analysis of the mechanical, heat and cold responsiveness of all the lamina I STT neurones characterized in the present experiments indicated that the transitional HPC cells can be identified by their high mechanical responsiveness and their comparatively weak cooling sensitivity, whereas the transitional NS cells are characterized by their high von Frey thresholds and low mechanical responsiveness. As noted in the preceding text, transitional cells may reflect a developmental incongruity, such that the transitional HPC cells receive input from the slowly adapting Aδ nociceptors rather than the rapidly adapting ones, and the transitional NS cells receive input from the rapidly adapting Aδ nociceptors and not from the slowly adapting ones. We have previously identified two sub-classes of HPC neurones that were statistically distinguished by their high (8.1 Hz) or low (2.1 Hz) discharge frequencies at a temperature of 18.7 °C (Craig et al. 2001), but their mechanical stimulus-response curves evoked by manually applied pinch stimuli applied with a 3 mm2 probe did not differ (A. D. Craig & D. Andrew, unpublished data). Although those two partitions probably reflect differences in the depth of the receptors in the skin, the present experiments suggest that differences in mechanical sensitivity might become evident if a smaller probe were used. Thus, the present results corroborate our prior observations of nociceptive lamina I STT cells with transitional mechanical response characteristics between the NS and HPC categories, yet further studies are needed to adequately distinguish these few neurones.
NS neurones, mechanical pain and the sensation of sharpness
The present experiments show that NS neurones encode stimulus intensity and differentiate probe size significantly better than HPC neurones, although the number of neurones that are simultaneously activated by a given probe will ultimately determine the percept of stimulus area. The profile of the stimulus-response function of the NS neurones also matches the psychophysical intensity-scaling curve much better than that of the HPC neurones, and these observations indicate that NS cells are likely to be important in mechanical pain sensations. This conclusion is consistent with our recent functional analyses of lamina I STT neurones using psychophysically validated stimuli (Andrew & Craig, 2002; Craig & Andrew, 2002). Using tonic mechanical stimuli, which produces an augmenting sensation of sharp pain, and repeated brief contact heat stimulation, which produces a rapidly augmenting sensation of second pain in humans (Vierck et al. 1997), we demonstrated a double dissociation indicating that NS neurones can subserve sharp (first) pain, whereas HPC neurones can subserve burning (second) pain.
Remarkably little is known about the psychophysics of mechanical pain, in part due to limitations of the commonly available mechanical stimulators referred to earlier. Most psychophysical studies of mechanical pain have focused on pain threshold and the factors that influence threshold measurement (Bishop, 1949; Greenspan & McGillis, 1991, 1994). No study has yet used ‘just noticeable difference’ methods (but see Magerl et al. 1990) or paired, forced-choice paradigms to investigate mechanical pain discrimination, and only one study has examined intensity scaling of mechanical pain using graded, constant force stimuli (Andrew & Greenspan, 1999). Human pain thresholds determined using brief, graded stimuli were in the range 30-45 g with a probe of 0.1 mm2 contact area (Greenspan & McGillis, 1991, 1994), and pain judgments increased approximately linearly as stimulus intensity increased above threshold (Andrew & Greenspan, 1999). The average mechanical threshold of NS neurones determined with a 0.1 mm2 probe (20 g) is slightly lower than the threshold for mechanical pain, but it is known from microneurography studies that summation of nociceptive impulses is needed to evoke the sensation of pain (Gybels et al. 1979). Like human pain estimates, the discharge of NS neurones increased linearly above threshold, and the two curves have similar trajectories (Fig. 10). Nonetheless, a noxious mechanical stimulus will also activate lamina I spinothalamic HPC cells and STT neurones in the deep dorsal horn as well as NS cells, and the resulting sensation will be a product of the integration of all of these inputs in the forebrain. Further experiments on nociceptive thalamo-cortical neurones will be required to address this issue.
Although we associate NS neurones with sharp (first) pain, the majority of the NS neurones studied (16/20) also responded to noxious heat stimulation. Nonetheless, this observation does not preclude a role for these cells in sharp pain, since noxious heat can evoke a sensation that is variously described as ‘pricking’, ‘heat’ or ‘prepain’ at temperatures slightly below the threshold of burning pain (≈45 °C; Boring, 1942; Campbell & LaMotte, 1983; Handwerker & Kobal, 1993). The heat thresholds of the Aδ-dominated NS neurones (≈43 °C) are significantly lower than those of the C-fibre-dominated HPC neurones (≈45.5 °C; Craig et al. 2001), which is consistent with a role for NS neurones in first pain and a role for HPC neurones in second pain.
NS neurones may also have a role in the sensation of ‘sharpness’. Sharpness evoked by punctate stimuli is distinguishable from mechanical pain in psychophysical studies, as the forces needed to evoke sharpness are about half the magnitude of those needed to evoke pain, regardless of stimulus area (Greenspan & McGillis, 1991, 1994). In contrast to mechanical pain, sharpness does not show spatial summation (Greenspan et al. 1997). Sharpness has been suggested to be due to activity in a sub-set of A-fibre nociceptors (Garell et al. 1996) that seem to be comparable to the mechanically sensitive group of nociceptors identified in monkey (Meyer et al. 1991). NS neurones with their strong A-fibre inputs and weak or absent C-fibre inputs are therefore good candidates to be involved in sharpness as well as mechanical pain sensations. The thresholds of the NS neurones to the 0.1 and 0.5 mm2 probes are close to the psychophysical thresholds for sharpness (Greenspan & McGillis, 1991, 1994): 16 g for sharpness vs. 20 g for NS neurones with the 0.1 mm2 probe and 45 g for sharpness vs. 30 g for NS neurones with the 0.5 mm2 probe.
We also identified two NS neurones (both responsive to pinch and heat and both with Aδ- and C-fibre inputs) that might have a specific role in sharpness, since their stimulus- response functions evoked by the 0.1 mm2 probe were bell-shaped, as their discharge peaked at ≤ 30 g and then declined with more intense stimuli (e.g. cell qm33.1 in Fig. 6). Their stimulus-response functions with the larger 0.5 mm2 probe were ‘step-like’ above a threshold of 45 g. That is, the response did not grade with supra-threshold intensity stimuli. Mechanical pain threshold in humans determined with a 0.5 mm2 probe is approximately 115 g (Greenspan & McGillis, 1991). Thus, the fact that the discharge of both of these cells did not increase as stimulus intensity increased into the painful range suggests that these two cells were not explicitly involved in mechanical pain sensations, and a role in sharpness is suggested instead.
Acknowledgments
Supported by the NIH (NS-25616) and the Atkinson Pain Research Fund administered by the Barrow Neurological Foundation. We thank M. Tatum and S. Jordan for excellent technical assistance. D.A. is currently a Research Fellow of the Royal Society of Edinburgh.
References
- Adriansen H, Gybels J, Handwerker HO, Van Hees J. Nociceptor discharges and sensations due to prolonged noxious mechanical stimulation – a paradox. Human Neurobiology. 1984;3:53–58. [PubMed] [Google Scholar]
- Andrew D, Craig AD. Spinothalamic lamina I neurons selectively sensitive to histamine: a central neural pathway for itch. Nature Neuroscience. 2001a;4:72–77. doi: 10.1038/82924. [DOI] [PubMed] [Google Scholar]
- Andrew D, Craig AD. Spinothalamic lamina I neurones selectively responsive to cutaneous warming in cats. Journal of Physiology. 2001b;537:489–495. doi: 10.1111/j.1469-7793.2001.00489.x. [DOI] [PMC free article] [PubMed] [Google Scholar]
- Andrew D, Craig AD. Responses of spinothalamic lamina I neurons to maintained noxious mechanical stimulation in the cat. Journal of Neurophysiology. 2002;87:1889–1901. doi: 10.1152/jn.00577.2001. [DOI] [PubMed] [Google Scholar]
- Andrew D, Greenspan JD. Peripheral coding of tonic mechanical cutaneous pain: Comparison of rat nociceptor discharge and human psychophysics. Journal of Neurophysiology. 1999;82:2641–2648. doi: 10.1152/jn.1999.82.5.2641. [DOI] [PubMed] [Google Scholar]
- Bester H, Chapman V, Besson J-M, Bernard J-F. Physiological properties of the lamina I spinoparabrachial neurons in the rat. Journal of Neurophysiology. 2000;83:2239–2259. doi: 10.1152/jn.2000.83.4.2239. [DOI] [PubMed] [Google Scholar]
- Bishop GH. Relation of pain sensory threshold to form of mechanical stimulator. Journal of Neurophysiology. 1949;12:51–57. doi: 10.1152/jn.1949.12.1.51. [DOI] [PubMed] [Google Scholar]
- Boring EG. Sensation and Perception in the History of Experimental Psychology. New York: Appleton-Century-Crofts; 1942. [Google Scholar]
- Bushnell MC, Duncan GH, Dubner R, He LF. Activity of trigeminothalamic neurons in medullary dorsal horn of awake monkeys trained in a thermal discrimination task. Journal of Neurophysiology. 1984;52:170–187. doi: 10.1152/jn.1984.52.1.170. [DOI] [PubMed] [Google Scholar]
- Campbell JN, Lamotte RH. Latency to detection of first pain. Brain Research. 1983;266:203–208. doi: 10.1016/0006-8993(83)90650-9. [DOI] [PubMed] [Google Scholar]
- Campbell JN, Meyer RA. Cutaneous nociceptors. In: Belmonte C, Cervero F, editors. Neurobiology of Nociceptors. New York: Oxford University Press; 1996. pp. 146–183. [Google Scholar]
- Carstens E. Responses of rat spinal dorsal horn neurons to intracutaneous microinjection of histamine, capsaicin, and other irritants. Journal of Neurophysiology. 1997;77:2499–2514. doi: 10.1152/jn.1997.77.5.2499. [DOI] [PubMed] [Google Scholar]
- Cervero F, Handwerker HO, Laird JMA. Prolonged noxious mechanical stimulation of the rat's tail: responses and encoding properties of dorsal horn neurons. Journal of Physiology. 1988;404:419–436. doi: 10.1113/jphysiol.1988.sp017297. [DOI] [PMC free article] [PubMed] [Google Scholar]
- Christensen BN, Perl ER. Spinal neurons specifically excited by noxious or thermal stimuli: marginal zone of the dorsal horn. Journal of Neurophysiology. 1970;33:293–307. doi: 10.1152/jn.1970.33.2.293. [DOI] [PubMed] [Google Scholar]
- Chubbuck JG. Small-motion biological stimulator. APL Technical Digest. 1966;5:18–23. [Google Scholar]
- Collins WF, Jr, Nulsen FE, Randt CT. Relation of peripheral nerve fiber size and sensation in man. Archives of Neurology. 1960;3:381–385. doi: 10.1001/archneur.1960.00450040031003. [DOI] [PubMed] [Google Scholar]
- Craig AD. Supraspinal pathways and mechanisms relevant to central pain. In: Casey KL, editor. Pain and Central Nervous System Disease: The Central Pain Syndromes. New York: Raven Press; 1991. pp. 157–170. [Google Scholar]
- Craig AD, Andrew D. Responses of spinothalamic lamina I neurons to brief repeated contact heat stimulation in the cat. Journal of Neurophysiology. 2002;87:1902–1914. doi: 10.1152/jn.00578.2001. [DOI] [PubMed] [Google Scholar]
- Craig AD, Dostrovsky JO. Differential projections of thermoreceptive and nociceptive lamina I trigeminothalamic and spinothalamic neurons in the cat. Journal of Neurophysiology. 2001;86:856–870. doi: 10.1152/jn.2001.86.2.856. [DOI] [PubMed] [Google Scholar]
- Craig AD, Kniffki K-D. Spinothalamic lumbosacral lamina I cells responsive to skin and muscle stimulation in the cat. Journal of Physiology. 1985;365:197–221. doi: 10.1113/jphysiol.1985.sp015767. [DOI] [PMC free article] [PubMed] [Google Scholar]
- Craig AD, Krout K, Andrew D. Quantitative response characteristics of thermoreceptive and nociceptive lamina I spinothalamic neurons in the cat. Journal of Neurophysiology. 2001;86:1459–1480. doi: 10.1152/jn.2001.86.3.1459. [DOI] [PubMed] [Google Scholar]
- Craig AD, Serrano LP. Effects of systemic morphine on lamina I spinothalamic tract neurons in the cat. Brain Research. 1994;636:233–244. doi: 10.1016/0006-8993(94)91022-7. [DOI] [PubMed] [Google Scholar]
- Davis KD, Meyer RA, Campbell JN. Chemosensitivity and sensitization of nociceptive afferents that innervate the hairy skin of the monkey. Journal of Neurophysiology. 1993;69:1071–1081. doi: 10.1152/jn.1993.69.4.1071. [DOI] [PubMed] [Google Scholar]
- Ferrington DG, Sorkin LS, Willis WD. Responses of spinothalamic tract cells in the superficial dorsal horn of the primate lumbar spinal cord. Journal of Physiology. 1987;388:681–703. doi: 10.1113/jphysiol.1987.sp016638. [DOI] [PMC free article] [PubMed] [Google Scholar]
- Fitzgerald M, Wall PD. The laminar organization of dorsal horn cells responding to peripheral C fibre stimulation. Experimental Brain Research. 1980;41:36–44. doi: 10.1007/BF00236677. [DOI] [PubMed] [Google Scholar]
- Garell PC, McGillis SLB, Greenspan JD. Mechanical response properties of nociceptors innervating feline hairy skin. Journal of Neurophysiology. 1996;75:1177–1189. doi: 10.1152/jn.1996.75.3.1177. [DOI] [PubMed] [Google Scholar]
- Greenspan JD, McGillis SLB. Stimulus features relevant to the perception of sharpness and mechanically evoked cutaneous pain. Somatosensory and Motor Research. 1991;8:137–147. doi: 10.3109/08990229109144738. [DOI] [PubMed] [Google Scholar]
- Greenspan JD, McGillis SLB. Thresholds for the perception of pressure, sharpness, and mechanically evoked pain: effects of laterality and repeated testing. Somatosensory and Motor Research. 1994;11:311–317. doi: 10.3109/08990229409028875. [DOI] [PubMed] [Google Scholar]
- Greenspan JD, Thomadaki M, McGillis SL. Spatial summation of perceived pressure, sharpness and mechanically evoked cutaneous pain. Somatosensory and Motor Research. 1997;14:107–112. doi: 10.1080/08990229771105. [DOI] [PubMed] [Google Scholar]
- Gybels J, Handwerker HO, Van Hees J. A comparison between the discharge of human nociceptive nerve fibres and the subject's ratings of his sensations. Journal of Physiology. 1979;292:193–206. doi: 10.1113/jphysiol.1979.sp012846. [DOI] [PMC free article] [PubMed] [Google Scholar]
- Han Z-S, Zhang E-T, Craig AD. Nociceptive and thermoreceptive lamina I neurons are anatomically distinct. Nature Neuroscience. 1998;1:218–225. doi: 10.1038/665. [DOI] [PubMed] [Google Scholar]
- Handwerker HO, Anton F, Reeh PW. Discharge patterns of afferent cutaneous nerve fibers from the rat's tail during prolonged noxious mechanical stimulation. Experimental Brain Research. 1987;65:493–504. doi: 10.1007/BF00235972. [DOI] [PubMed] [Google Scholar]
- Handwerker HO, Iggo A, Zimmermann M. Segmental and supraspinal action on dorsal horn neurons responding to noxious and non-noxious stimuli. Pain. 1975;1:147–165. doi: 10.1016/0304-3959(75)90099-8. [DOI] [PubMed] [Google Scholar]
- Handwerker HO, Kobal G. Psychophysiology of experimentally induced pain. Physiological Reviews. 1993;73:639–671. doi: 10.1152/physrev.1993.73.3.639. [DOI] [PubMed] [Google Scholar]
- Khalsa PS, Lamotte RH, Grigg P. Tension and compression responses of nociceptors in rat hairy skin. Journal of Neurophysiology. 1997;77:492–505. doi: 10.1152/jn.1997.78.1.492. [DOI] [PubMed] [Google Scholar]
- Khalsa PS, Zhang C, Qin Y-X. Encoding of location and intensity of noxious indentation into rat skin by spatial populations of cutaneous mechano-nociceptors. Journal of Neurophysiology. 2000;83:3049–3061. doi: 10.1152/jn.2000.83.5.3049. [DOI] [PubMed] [Google Scholar]
- Koltzenburg M, Handwerker HO. Differential ability of human cutaneous nociceptors to signal mechanical pain and to produce vasodilation. Journal of Neuroscience. 1994;14:1756–1765. doi: 10.1523/JNEUROSCI.14-03-01756.1994. [DOI] [PMC free article] [PubMed] [Google Scholar]
- Laird JMA, Cervero F. Signalling of a step-like intensity change of noxious mechanical stimuli by dorsal horn neurones in the rat spinal cord. Journal of Physiology. 1991;434:561–575. doi: 10.1113/jphysiol.1991.sp018486. [DOI] [PMC free article] [PubMed] [Google Scholar]
- Landgren S. Thalamic neurons responding to cooling of the cat's tongue. Acta Physiologica Scandinavica. 1960;48:255–267. doi: 10.1111/j.1748-1716.1960.tb01860.x. [DOI] [PubMed] [Google Scholar]
- Lewis T, Pochin EE. The double pain response of the human skin to a single stimulus. Clinical Sciences. 1937;3:67–76. [Google Scholar]
- Light AR, Sedivec MJ, Casale EJ, Jones SL. Physiological and morphological characteristics of spinal neurons projecting to the parabrachial region of the cat. Somatosensory and Motor Research. 1993;10:309–325. doi: 10.3109/08990229309028840. [DOI] [PubMed] [Google Scholar]
- Magerl W, Geldner G, Handwerker HO. Pain and vascular reflexes elicited by prolonged noxious mechano-stimulation. Pain. 1990;43:219–225. doi: 10.1016/0304-3959(90)91075-T. [DOI] [PubMed] [Google Scholar]
- Maixner W, Dubner R, Kenshalo DR, Jr, Bushnell MC, Oliveras J-L. Responses of medullary dorsal horn neurons during the detection of noxious heat stimuli. Journal of Neurophysiology. 1989;62:437–499. doi: 10.1152/jn.1989.62.2.437. [DOI] [PubMed] [Google Scholar]
- Meyer RA, Davis KD, Cohen RH, Treede R-D, Campbell JN. Mechanically insensitive afferents (MIAs) in cutaneous nerves of monkey. Brain Research. 1991;561:252–261. doi: 10.1016/0006-8993(91)91601-v. [DOI] [PubMed] [Google Scholar]
- Price DD, Hayes RL, Ruda M, Dubner R. Spatial and temporal transformations of input to spinothalamic tract neurons and their relation to somatic sensations. Journal of Neurophysiology. 1978;41:933–947. doi: 10.1152/jn.1978.41.4.933. [DOI] [PubMed] [Google Scholar]
- Slugg RM, Meyer RA, Campbell JN. Responses of cutaneous A- and C-fiber nociceptors in the monkey to controlled-force stimuli. Journal of Neurophysiology. 2000;83:2179–2191. doi: 10.1152/jn.2000.83.4.2179. [DOI] [PubMed] [Google Scholar]
- Tanner KD, Reichling DB, Levine JD. Nociceptor hyper-responsiveness during vincristine-induced painful peripheral neuropathy in the rat. Journal of Neuroscience. 1998;18:6480–6491. doi: 10.1523/JNEUROSCI.18-16-06480.1998. [DOI] [PMC free article] [PubMed] [Google Scholar]
- Vierck CJ, Cannon RL, Fry G, Maixner W, Whitsel BL. Characteristics of temporal summation of second pain sensations elicited by brief contact of glabrous skin by a preheated thermode. Journal of Neurophysiology. 1997;82:992–1002. doi: 10.1152/jn.1997.78.2.992. [DOI] [PubMed] [Google Scholar]
- Willis WD, Maunz RA, Foreman RD, Coulter JD. Static and dynamic responses of spinothalamic tract neurons to mechanical stimuli. Journal of Neurophysiology. 1975;38:587–600. doi: 10.1152/jn.1975.38.3.587. [DOI] [PubMed] [Google Scholar]
- Willis WD, Trevino DL, Coulter JD, Maunz RA. Responses of primate spinothalamic tract neurons to natural stimulation of hindlimb. Journal of Neurophysiology. 1974;37:358–372. doi: 10.1152/jn.1974.37.2.358. [DOI] [PubMed] [Google Scholar]
- Wilson LB, Andrew D, Craig AD. Activation of spinobulbar lamina I neurons by static muscle contraction. Journal of Neurophysiology. 2002;87:1641–1645. doi: 10.1152/jn.00609.2001. [DOI] [PubMed] [Google Scholar]