

Abstract
Most cotransporters characteristically display two main kinds of electrical activity: in the absence of organic substrate, transient presteady-state currents (Ipre) are generated by charge relocation during voltage steps; in the presence of substrate, sustained, transport-associated currents (Itr) are recorded. Quantitative comparison of these two currents, in Xenopus oocytes expressing the neural GABA cotransporter rGAT1, revealed several unforeseen consistencies between Ipre and Itr, in terms of magnitude and kinetic parameters. The decay rate constant (r) of Ipre and the quantity of charge displaced to an inner position in the transporter (Qin(0)) depended on voltage and ionic conditions. Saturating GABA concentrations, applied under the same conditions, suppressed Ipre (i.e. Qin(∞) = 0) and produced a transport-associated current with amplitude Itr = Qin(0)r. At non-saturating levels of GABA, changes of Itr were compensated by corresponding variations in Qin, such that Ipre and Itr complemented each other, according to the relation: Itr = (Qin(0) - Qin) r. Complementarity of magnitude, superimposable kinetic properties and equal dependence on voltage and [Na+]o point to the uniqueness of the charge carrier for both processes, suggesting that transport and charge migration arise from the same molecular mechanism. The observed experimental relations were correctly predicted by a simple three-state kinetic model, in which GABA binding takes place after charge binding and inward migration have occurred. The model also predicts the observed voltage dependence of the apparent affinity of the transporter for GABA, and suggests a voltage-independent GABA binding rate with a value around 0.64 μm−1 s−1.
Great progress in the functional characterization of cotransporters has been favoured by the possibility of cloning and expressing them at high levels in heterologous systems, to record their electrophysiological properties (Parent et al. 1992a; Mager et al. 1993, 1996; Bossi et al. 1999; Lu & Hilgemann, 1999a,b; Forster et al. 2000). Besides the membrane current associated with the ion-coupled translocation of the organic substrate (transport-associated current, Itr), most cotransporters exhibit two further kinds of current, in the absence of organic substrate: an ‘uncoupled’ (steady) current, whose physiological significance is unclear, and a presteady-state current (Ipre), which is thought to represent partial reactions in the transporter cycle (Parent et al. 1992b; Su et al. 1996; Loo et al. 1998; Hilgemann & Lu, 1999).
Presteady-state and transport-associated currents are reminiscent of two distinct currents in voltage-dependent ionic channels: the gating current and ionic current through the channel itself, respectively (Armstrong & Bezanilla, 1974; Hille, 1992). Similar to the gating currents, Ipre has the characteristics of an intramembrane charge movement, as it is transient, saturable and symmetric (Mager et al. 1993; Bossi et al. 1999; Forlani et al. 2001b). Conversely, Itr and the current through an ionic channel are true transmembrane currents, as the actual charge carriers physically move from the extracellular to the cytosolic compartment or vice versa. In ionic channels clearly distinct functions have been assigned to the two currents. As the name implies, the gating currents are believed to signal the conformational changes that accompany opening (or closing) of the permeation pathway (Catterall, 1993). The current through the channel can only occur when the gates are open, and therefore a simple relation, based on Ohm's law, exists between the probability of the channel being open and the current flux. Whereas the ionic current obviously depends on the presence and on the equilibrium potential of the permeating ion, this parameter does not affect the gating currents. Actually, gating currents are best measured in the absence of permeating ions. Therefore, the charges that sustain gating and ionic currents are clearly distinct.
In cotransporters the situation is certainly less clear and the reciprocal dependence of Ipre and Itr appears to be much more stringent than that between gating and ionic currents in channels. In fact, the charges responsible for the presteady-state current cannot be clearly distinguished from those giving rise to the transmembrane current flux. The ions that are necessary to activate the transport of substrate, producing in this way Itr, are generally required for the generation of the presteady-state currents as well; the two kinds of current are mutually exclusive, that is, while the presteady-state current is best observed in the absence of substrate, it disappears when the latter is present in saturating amounts (Mager et al. 1993; Bossi et al. 1999). Changes in the concentrations of ions involved in Ipre also affect Itr in similar ways, and finally, blockers of the transport-associated current often block the presteady-state current as well (Mager et al. 1993; Mager et al. 1996; Bossi et al. 1999).
A number of mechanistic models have been proposed to explain the peculiar electrophysiological characteristics outlined above, including discrete ordered kinetic schemes (Parent et al. 1992b; Loo et al. 1998; Hilgemann & Lu, 1999) and stochastic multi-substrate single-file models (Su et al. 1996; DeFelice et al. 2001). Although all these models can account for most experimental results, they consider separately the properties of the presteady-state current and of the transport-associated current, without preliminarily establishing an experimentally derived connection between the two processes. In the present work we have investigated on experimental grounds the relation between presteady-state and transport-associated currents in the rat GABA transporter rGAT1 expressed in Xenopus oocytes, and have obtained consistent results that can be accounted for by a minimal three-state kinetic scheme.
Methods
cRNA preparation and Xenopus laevis oocyte expression
The experimental procedure has been described in detail elsewhere (Forlani et al. 2001a). Briefly, the cDNA encoding the rat GAT1 cotransporter was cloned into the pAMV-PA vector; after linearization with Not I, the cRNA was synthesized in vitro in the presence of Cap Analog and 200 units of T7 RNA polymerase. All enzymes were supplied by Promega Italia, Milan, Italy.
Oocytes were collected under anaesthesia (MS-222, tricaine methanesulfonate; 0.10 % (w/v) solution in tap water) from Xenopus laevis frogs that were humanely killed after the final collection. The experiments were carried out in accordance with institutional and national ethical guidelines.
The oocytes were treated with collagenase (Sigma Type IA; 1 mg ml−1 in calcium-free ND96 solution) for at least 1 h at 18 °C. Healthy looking V and VI stage oocytes were collected and injected with 12.5 ng of cRNA in 50 nl of water, using a manual microinjection system (Drummond). The oocytes were incubated at 18 °C for 3-4 days in NDE solution (ND96 solution: 96 mmNaCl, 2 mm KCl, 1.8 mm CaCl2, 1 mm MgCl2, 5 mm Hepes (pH 7.6), supplemented with 50 μg ml−1 gentamicin and 2.5 mm sodium pyruvate) before electrophysiological studies.
Electrophysiology
A two-electrode voltage-clamp system was used to perform the experiments (Geneclamp, Axon Instruments, Union City, CA, USA). The holding potential (Vh) was kept at -40 mV; voltage pulses to test potentials from -120 to +40 mV, in 20 mV increments, were applied and four pulses were averaged at each potential. Signals were filtered at 1 kHz and sampled at 2 kHz.
Data analysis was performed using Clampfit 8.2 (Axon Instruments). Presteady-state currents were isolated by subtraction of corresponding traces in the presence of 30 μm SKF89976A (Tocris), a substance able to block both transient and transport-associated currents (Mager et al. 1993); subtracted traces were corrected for any remaining leakage (which never exceeded ± 15 nA) and integrated. Charge data in the text and figures always represent the average of ‘on’ and ‘off’ integrals, which did not differ more than 10 % from each other.
Solutions
The external control solution had the following composition (mm): NaCl, 98; MgCl2, 1; CaCl2, 1.8; Hepes free acid, 5; at pH 7.6. When [Na+]o was reduced, it was replaced by corresponding amounts of TMA+. The pH was adjusted with NaOH or TMAOH. Solutions were superfused by gravity onto the oocyte by a pipette tip placed very close (1-2 mm) to the cell.
Experiments were done at room temperature (20-24 °C). To minimize variability related to different batches and among oocytes, the comparison between Ipre and Itr was always performed individually in each oocyte.
Results
The main characteristics of the presteady-state and of the transport-associated currents, measured in Xenopus oocytes expressing heterologous rGAT1, are illustrated in Fig. 1. These features have been reported in several instances (Mager et al. 1993, 1996; Forlani et al. 2001a), and are shared by most, neural and non-neural, cotransporters (Hazama et al. 1997; Bossi et al. 1999; Forster et al. 2000; Forlani et al. 2001b). They illustrate the two distinct modes of operation of the cotransporter - ‘transport’ mode and ‘capacitive’ mode - that are observed depending on the presence/absence of the organic substrate. These results are presented in Fig. 1 as a synopsis, to highlight the relations among the various graphs.
Figure 1. Main properties of Ipre and Itr.

A, Ipre in response to voltage pulses to -120, -80, 0 and +40 mV from Vh = -40 mV, after subtraction of the corresponding records in the presence of SKF89976A. B, Q-V curve obtained from integration of the transients in A and vertically offset, in order to make it start from zero at positive values. Vm, membrane potential. Fitting the sigmoid with a Boltzmann function: Q =Qmax/{1 + exp[-(V1/2 - V)/s]}, gives in this oocyte: Qmax = -26.7 nC, V1/2 = -30.3 mV and log-slope s = 21.2 mV). C, charge equilibration rate (▪) and unidirectional rate constants (α, ○; and β, ▵) obtained from the traces in A. D, isolated Itr in response to the same voltage protocol as in A; the dotted line indicates zero current. E, steady-state Itr from records in D. All data in A-E are from the same oocyte. F, relation between Itr at -120 mV and Qmax from 16 individual oocytes; the linear regression (r = 0.97) gives a slope of 24 ± 2 nA nC−1 (or s−1). Vertical calibration bar represents 0.25 μA for A and 0.5 μA for D.
The traces in Fig. 1A were obtained after subtraction of the corresponding records in the presence of the specific blocker SKF89976A (30 μm). The presteady-state currents isolated in this way were integrated to give the sigmoid charge (Q) vs. voltage (V) relation (Fig. 1B), and were fitted with single exponentials to obtain the charge transfer rate (r = 1/τ; Fig. 1C) (Parent et al. 1992a; Mager et al. 1993, 1996; Bossi et al. 1999; Lu & Hilgemann, 1999a,b; Forster et al. 2000). In order to facilitate the subsequent analysis, the zero charge level in Fig. 1B was set to the saturation value at positive potential, obtained by fitting a Boltzmann function. We shall call the resulting quantity Qin to indicate that it represents the charge displaced to an inner position of the transporter, and Qmax will be its maximal attainable value. The charge and rate curves may be used to obtain the unidirectional outward (α) and inward (β) rate constants of charge movement, through the equations (Bossi et al. 1999; Forlani et al. 2001a):
| (1a) |
| (1b) |
The traces in Fig. 1D represent the isolated transport-associated currents in the presence of 100 μm GABA, resulting from the subtraction of the corresponding records after addition of SKF89976A (30 μm). From these traces the steady-state I-V relation shown in Fig. 1E can be obtained. Finally, in Fig. 1F the transport-associated current (Itr), measured at -120 mV and with 100 μm GABA in 16 oocytes with different levels of expression, is plotted against the corresponding Qmax. As shown before for various transporters (Mager et al. 1993; Bossi et al. 1999; Forlani et al. 2001b), these two quantities are linearly related, indicating that both depend on the number of transporters.
A simple relation between Itr and Qin at saturating GABA
In order to investigate the physical basis of the correlation shown in Fig. 1F we initially used the classical approach employed in the study of ionic channels (Hodgkin & Huxley, 1952; Dodge & Frankenhaeuser, 1959), i.e. we attempted to detect a reversal potential (Erev) of Itr, and consequently to determine the conductance of the transporter, in order to see whether it was related in some simple way to the Q vs.V curve. Reversal of the transport-associated current of rGAT1 has indeed been observed in inside-out experiments on oocyte macropatches (Lu & Hilgemann, 1999a). Two-pulse experiments aimed at this purpose failed to reveal reversal of the instantaneous current (Fig. 2). In our experiments, performed in the intact oocyte, the intracellular GABA concentration is estimated to be in the micromolar range at most (see Discussion), whereas outwardly directed GABA-coupled currents require internal GABA concentrations in the millimolar range (Lu & Hilgemann, 1999a). This may explain the lack of reversal in our experiments, provided that the transporter affinity for GABA is much lower at the internal than at the external side, a necessary condition for physiological uphill transport of the neurotransmitter.
Figure 2. Two-pulse experiment aimed to detect Itr reversal.

A, sample current traces, after subtraction of the corresponding records in SKF89976A. The membrane voltage was initially stepped to -120 mV from Vh = -40 mV for 400 ms, after which a second step to variable voltages between -120 and +80 mV was applied. B, instantaneous I-V relation, in which the value of the current at the beginning of the second step is plotted against its voltage level. Data are means ± s.e.m. from 5 oocytes.
Indeed, it has been pointed out (DeFelice, 1997) that, whereas the current in channels may be written as I = Nip, where N is the number of channels, i is the single channel current and p is the open probability of the channel, for transporters one should write:
| (2) |
where N is the number of transporters, f the fraction actively operating, q the charge transferred per cycle and ρ the turnover rate. Returning to Fig. 1, it is possible to note that the value of the relaxation rate of Ipre at -120 mV (about 27 s−1, Fig.1C) is rather close to the slope of the linear fit of Fig. 1F (the ratio between the current at -120 mV and the maximal charge displacement), which also has the dimensions of a rate (about 24 nA nC−1, i.e. 24 s−1). This observation hinted at a possible correlation between Itr and Ipre and prompted us to try to apply eqn (2) to the data of Fig. 1. If the same process underlies charge transfer and transport current, the qN term in eqn (2) should equal the maximal quantity of displaceable charge (Qmax), and assuming that with saturating GABA all the charges in the inner transporter position will take part in the current, the product qNf should equal Qin. Finally, if charge redistribution within the membrane is rate-limiting in the transport cycle (Mager et al. 1993), its rate (r) may be tentatively taken as the transporter turnover rate at this potential.
A few notations have been introduced to simplify the equations: the substrate (GABA) concentration is indicated by G, with the shorthand notations ‘0′ and ‘∞‘, respectively, being used to indicate the absence or presence of a saturating concentration of substrate, and the various parameters (currents, charge, rates) are expressed as functions of GABA concentration.
From the above discussion, in general we expect:
| (3) |
i.e. the uptake current in the presence of saturating GABA (Itr(∞)) should be predicted by combining the experimental measurements of: (i) the quantity of inwardly displaced charge in the absence of GABA (Qin(0)), and (ii) the rate constant of Ipre relaxation (r (0)).
Note that, combining eqns (1b) and (3) we can write:
| (3a) |
which suggests an alternative - but equivalent - interpretation of the data at saturation: the amount of charge involved is qN = Qmax, and the turnover rate equals the inward migration rate, β.
Figure 3A shows the result of dividing the value of Itr (from Fig. 1E) by the rate r (from Fig. 1C); the result has the dimensions of a charge and, according to eqn (3), it should correspond to Qin (0); therefore we have plotted in the same graph the Q-V curve taken from Fig. 1B. It can be seen that the two curves are in very good quantitative agreement. The result of Fig. 3A indicates that the charge inwardly displaced within the membrane electrical field by voltage steps in the absence of GABA strictly corresponds to the charge that is transferred across the membrane during neurotransmitter transport, and that the rate at which the two processes occur is the same.
Figure 3. Correspondence between charge movement and transport current.

A, comparison between Qinvs. V curve and the ratio Itr/r. The filled squares represent the result of dividing Itr (from Fig. 1E) by the charge equilibration rate of Fig. 1C (▪). Open squares are replotted from Fig. 1B. B, comparison between measured Itr (open symbols) and the product Qinr (filled symbols) for 3 oocytes showing different levels of expression (values of Qmax in nC are indicated on the left).
It should be noted that the coincidence in Fig. 1 between rate and slope of the Itrvs. Qmax relation could have been observed at any potential and not only at -120 mV; this value was chosen for Fig. 1F because at this potential Itr is large and Qmax is attained.
In Fig. 3B, the results of applying eqn (3) are compared with the transport-associated currents, measured in the presence of 100 μm GABA, in three other oocytes with different levels of expression, with very good agreement. It should be stressed again that this result could only be obtained at saturating concentrations of GABA, so that all the transporters are involved in GABA translocation.
We tested the validity of eqn (3) under other experimental conditions, namely in altered extracellular sodium concentrations, a parameter that has been shown to affect both Ipre and Itr in several cotransporters (Mager et al. 1993; Bossi et al. 1999; Forlani et al. 2001a). Reducing the external sodium concentration has the effect of shifting both Q-V and Itr-V curves towards more negative potentials; it also shifts the rate vs. V curve and raises its minimum (Bossi et al. 2002). Examples of such effects are shown in Fig. 4. The values of the transport-associated current in the presence of saturating GABA at several different potentials and sodium concentrations were predicted from the Qin and rate vs.V curves, using eqn (3). The results are plotted in Fig. 4C (filled symbols) together with the experimental data (open symbols), again showing that the match is quite satisfactory for all conditions.
Figure 4. Effects of external Na+ concentration.

A, the Q-V curves in the absence of GABA are negatively shifted without change in Qmax.B, the rate vs. V curves are also shifted by reductions in external Na+, with a concomitant increase in minimum rate. C, effects of Na+ on Itr (induced by 100 μm GABA); open symbols are experimental data and filled symbols are data calculated from Itr =Qinr, with values taken from A and B. Symbols correspond to the following Na+ concentrations (mm): □, ▪: 98; ○, •:, 50; ▵, ▴: 25; ▿, ▾: 12.
The results obtained so far therefore indicate that the intramembrane charges that are displaced to the inner position in the absence of GABA (Qin (0), charges associated with Ipre (0)) are converted to an equivalent amount of transmembrane current-carrying charge (i.e. they switch from capacitive to conductive behaviour), upon addition of saturating levels of GABA. These charges appear to turn over with the same rate, r (0), as charge equilibration during Ipre (0). This amount of Itr-associated charge, which we shall call Qtr (∞), corresponds to the difference between Qin measured in the absence of GABA (Qin (0)) and Qin measured with saturating GABA (Qin (∞)).
Relations between Ipre and Itr in non-saturating GABA concentrations
When the GABA concentration is below saturation, the current records in response to the usual voltage protocol display both presteady-state and transport-associated currents. This is evident in the recordings shown in Fig. 5A, where 0, 10 and 1000 μm GABA were applied to the same oocyte.
Figure 5. Relations between Ipre and Itr in non-saturating [GABA].

A, uncorrected current traces from an oocyte in the presence of the indicated GABA concentrations and in response to voltage clamp pulses to -120, -80, 0 and +40 mV from Vh = -40 mV. B, traces resulting from Aa - Ac and Ab - Ac, respectively, and after subtraction of the steady-state current. C, results of the integration of the transients in Ba (□) and Bb (○); averages between ‘on’ and ‘off’ areas ± s.e.m are shown; fitting of the squares with a sigmoid function gave: Qmax = -48.4 nC, V1/2 = -38.4 mV and log-slope = 19.8 mV. D, rate constants from the same oocyte at the indicated GABA concentrations. E, Itr from the same oocyte at the indicated GABA concentrations.
In order to extend the analysis of the relation between Ipre and Itr introduced above to intermediate GABA concentrations, it is necessary to consider the possibility that only part of the charges that are displaced to the inner position in zero GABA might be converted from the Qin to the Qtr form, such that in any case:
Equation (3) would then become:
| (4) |
Equation (3) follows from eqn (4) as a particular case for saturating conditions: since Qin (∞) = 0, then Qtr (∞) = Qin (0).
This relation indicates that the transport current measured under any condition should be correctly predicted by multiplying the loss of internally displaced charge due to addition of GABA (Qtr (G)) by the rate constant of Ipre relaxation (r (0)).
We then tested eqn (4) by measuring Qin (G), the amount of charge displaceable in a non-saturating GABA concentration. In order to simplify the experiment, in Fig. 5 the presteady-state current was isolated by subtracting the traces in saturating GABA concentration and forcing to zero the steady level at the end of the pulse. This unusual procedure assumes time-independent Itr during each voltage pulse and no Ipre with saturating GABA, i.e. it is based on the mutual exclusivity between Ipre and Itr. Sample traces obtained in this way are shown in Fig. 5B, and the resulting time integrals are plotted in Fig. 5C. As a validation, the procedure was applied to recordings obtained in zero GABA, yielding parameters in close agreement with those obtained with the standard method (see legend to Fig. 5).
The plots in Fig. 5 show a marked decrease in the maximum attainable value of Qin. The transient currents in 10 μm GABA systematically displayed ‘on’ areas that were somewhat larger than the corresponding ‘off’ areas, as indicated by the error bars in the circles of Fig. 5C. The rate constants of the charge movements in Fig. 5B were estimated by single exponential fits and are shown in Fig. 5D. The rates are slightly lower than those of Fig. 1 and Fig. 4, possibly reflecting batch differences in this set of experiments. It can be noted that the half-charge voltage (V1/2) is negatively shifted in the presence of 10 μm GABA (-56.1 ± 1.4 vs. -38.4 ± 0.8 mV).
The transport-associated current was also estimated under these conditions: the resulting Itrvs. V curves are plotted in Fig. 5E.
The difference in intramembrane charge movement between 0 and 10 μm GABA was clearly significant and reproducible in all oocytes analysed in this way. The average curves from five oocytes are shown in Fig. 6A.
Figure 6. Interconversion between intramembrane and transmembrane charge movements.

A, average curves of the charge at the internal transporter position (see text), from 5 oocytes analysed as in Fig. 5. ▵, difference between □ (no GABA) and ○ (10 μm GABA); ▴ are derived from eqn (5). B, average charge transfer rates from the same oocytes (⋄, r; ▵, ○: unidirectional rates). C, average Itr at the indicated GABA concentrations; open symbols are experimental data, filled symbols represent the currents calculated from eqn (4) using the values from the corresponding symbols in A multiplied by the rate in B (▪ (C) =□(A) ×⋄ (B); ▴ (C) =▵ (A) ×⋄ (B)). D, GABA apparent affinity evaluated as the concentration giving rise to half Itr at each potential.
According to eqn (4), the rationale of this kind of analysis was to verify whether the loss of intramembrane charge displacement, seen in the presence of 10 μm GABA, corresponded to the fraction of Itr gained. In order to do so, we first calculated the difference between the inwardly displaced charge in 0 and 10 μm GABA, Qtr (10) (shown in Fig. 6A, ▵); then, Itr (10) was predicted by eqn (4) using the data of Fig. 6A and B; the results are shown in Fig. 6C (filled symbols), where it can be seen that they compare quite favourably with the experimental data (open symbols).
This result indicates that the inwardly displaced charge decreases from Qin (0) to zero with increasing GABA concentration, while the quantity of charge involved in generating current complementarily increases from Qtr (0) = 0 to Qtr (∞) = Qin (0). In particular, it is reasonable to assume that the dependence of Qtr (G) on GABA concentration should reproduce the dependence of Itr on [GABA]. Thus, a further way of testing the hypothesis of the interconversion between the transporting and non-transporting forms of the protein is to predict Qtr (G) based on independently estimated GABA concentration-effect curves on transport current. The I-V curves at low [GABA] illustrated in Fig. 6C flattened at negative potentials, suggesting a lower affinity under these conditions. Indeed, the concentration of GABA inducing the half-maximal current (K1/2) at each potential could be evaluated electrophysiologically and displayed marked voltage dependence, as illustrated in Fig. 6D, which confirms previous determinations (Mager et al. 1993; Forlani et al. 2001a). We thus expect that the following Michaelian relation should hold:
| (5) |
The result of eqn (5) is plotted in Fig. 6A as filled triangles, and shows good agreement with the experimentally derived values.
We may conclude that both reconstructions, of Itr in non-saturating GABA concentrations on the basis of the loss of charge movement, and of charge loss on the basis of the apparent affinity of the transporter for GABA, give satisfactory results, especially considering that the isolation of pure presteady-state currents in the presence of GABA is probably subject to some errors.
Discussion
It has been already pointed out (Mager et al. 1993) that the Na+-dependent charge translocation event constitutes a rate-limiting step for GABA transport in rGAT1. Our finding, that the turnover rate of the transport-associated current substantially coincides with the rate of charge relaxation, following voltage jumps in the absence of GABA, quantitatively substantiates this idea. The validity of the correlation between transport-associated and presteady-state current has been verified at various Na+ concentrations in saturating GABA. With non-saturating GABA concentrations, presteady-state and transport currents display quantitative complementarity; this strongly supports the idea that the charge carrier is the same for both processes and points to a rather simple transport mechanism.
It appears quite well established that in rGAT1 the charge movement in the absence of GABA is mostly Na+ dependent, although Cl− is also involved (Mager et al. 1993; Lu & Hilgemann, 1999a,b; Bossi et al. 2002). Therefore it might be due either to the in and out movement of the ions in the membrane field, or to a conformational change of the protein subsequent to binding, or to a combination of the two. The fact that the presteady-state currents may be satisfactorily fitted by single exponentials suggests that charge movement essentially occurs between two states only; therefore binding of Na+ and charge translocation should be tightly coupled and may be operationally treated as a single process.
We have shown that the transport current amplitude, at any substrate concentration (G), is accounted for by a quantity of charges (Qtr (G)) turning over with rate r. The quantity Qtr (G) is equal to the loss of inwardly displaced charges (Qin) with respect to measurements in the absence of substrate, while r is the relaxation rate of pre-steady state current, also measured without substrate. This indicates that at any membrane potential a fraction of the inwardly displaced charges (capacitive behaviour) is converted by the addition of GABA to current-carrying charges (conductive behaviour), without alterations in the kinetics of charge migration.
An alternative interpretation of these data is that a corresponding fraction of the total displaceable charge (Qmax) switches in the presence of GABA from capacitive to conductive behaviour. Since the inwardly displaced charges represent a fraction (inward rate/relaxation rate = β/r) of the total charges, in this view the turnover rate would be limited to the inward rate β, instead of r, as mentioned in the text relating to eqns (3) and (3a).
These two models are numerically equivalent, but favour two distinct kinetic interpretations: in the former case, GABA would bind to transporter molecules carrying charge on the inside (switching a fraction thereof from capacitive to conductive operating mode); in the latter, GABA would bind to any transporter forms and switch them to conductive mode. Quantitative consistency in the data presented above indicates that charge migration rates, and in particular the inward rate (β), are unaffected by the operating mode (i.e. by GABA binding). This strongly suggests that the inward charge migration step proceeds unchanged by GABA binding, and definitely favours the former interpretation. It would in fact be very unlikely that the transporters could undergo an energetically relevant step (charge translocation) with precisely the same rate irrespective of being loaded or not with substrate. Furthermore, the dependence of the inward rate constant on temperature (Binda et al. 2002) suggests that charge migration is a diffusive process, not coupled with significant activation barriers and conformational changes; this also supports the idea that possible conformational changes, involved in substrate binding and translocation, must follow the charge migration step. Additional support for the proposed sequence comes from the following consideration: if GABA interacted exclusively with the empty transporter (i.e. before the Na+ binding and charge translocation), at strongly negative potentials most transporters would be sequestered in the state with the charge in the inner position and therefore unable to bind GABA. On the contrary, the large transport-associated currents at negative potentials and high [GABA] require all the available transporters to be operating, and therefore this binding order must be discarded.
Following these considerations, we have devised a simple three-state kinetic scheme that fully accounts for the experimental data, giving formal kinetic foundations to eqns (2) to (5). The scheme is illustrated in Fig. 7 and analytically discussed in the Appendix. It is comprised of the following three states: uncharged transporter (T0), transporter with a charge on the inside (T1), and a further - presumably evanescent - state (T2), which follows GABA binding and rapidly falls back to state T0, releasing the substrates towards the cytosol. The transporter moves from state T0 to T1 with rate β, and returns back with rate α; from state T1 it may also move to state T2, with the rate determined by GABA concentration (G) and its binding rate constant (k1), to rapidly fall back to state T0. State T1 (inwardly displaced charge) should be a high energy state, a ‘strained’ state (Läuger, 1991), which has acquired the energy of the Na+ gradient and should be ready to translocate the substrate. It is not necessary at this stage to define precisely the nature of the charge carrier and the exact stoichiometry, although clearly Na+ ions play a prominent role. The assumption that binding of GABA results in immediate cytosolic release of both substrates implies that backward unbinding is kinetically negligible. We can hypothesize that the binding of GABA to state T1 induces a further conformational change that causes a dramatic affinity decrease for both substrates. Finally, agreement with experimental findings requires state T2 to be an evanescent state. In the hypothesis of an alternate-access model, we may expect state T0 to possess the lowest free energy level, and that the return rate from state T2 to the empty, outwardly facing, state T0 should be high compared with the other rates. An alternative view is that strong Na+ binding on the inner position of the transporter is what prevents the charges, in the absence of GABA, from flowing through, thereby directly regenerating the ‘resting’ transporter; GABA binding, by promoting Na+ release, and subsequent release of GABA itself, would permit this direct regeneration of the resting transporter.
Figure 7. Model representing the minimal kinetic scheme necessary to reproduce the experimental results and correlations.

The transporter is depicted as the light grey oval spanning the membrane; mobile charge (e.g. Na+ ions) is represented by the black circles, while the dark grey rectangle symbolizes GABA. A, in the absence of GABA the transporters equilibrate between the two states, empty (at left) and charged (right), according to the unidirectional rates α and β.B, when GABA is present, it can bind to the charged state with rate k1; in order to account for the experimental results the complex formed by the transporter, GABA and ions must dissociate instantaneously, releasing ions and GABA to the cytosol. The transporter returns immediately to the ‘empty’ state.
In the model, GABA binding and substrate release play the role of an alternative path back from state T1 to state T0, such that: (i) the inward migration rate constant (β) remains unaltered by GABA binding; (ii) the outward migration rate (α) is increased in the presence of GABA by a factor Gk1; (iii) the relaxation rate of Ipre (r) is correspondingly increased (from α + β to α + β + Gk1); and (iv) the molar fraction of state T1 (β/r) is correspondingly decreased.
All these aspects are verified by the data presented. Figure 8 compares the experimental findings with the theoretical predictions of the equations in the Appendix (A1, A3 and A4), for a number of GABA concentrations. Furthermore, the mathematical treatment (see Appendix) leads to a number of analytical relations which are identical to the experimental correlations observed above.
Figure 8. Reconstruction of experimental findings from the model of Fig. 7.
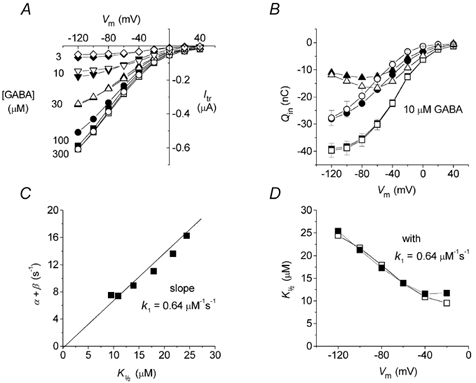
A, transport-associated currents in the presence of different concentrations of GABA; open symbols are experimental points (averaged from 5 oocytes), while filled symbols are calculated from eqn (A1) using α, β and Qmax averaged from the same oocytes. B, Qin in 0 (□, ▪) and 10 μm GABA (○, •); ▵ and ▴, difference between squares and circles; open symbols are experimental data from the same oocytes of Fig. 6, and filled symbols are calculated from eqns (A4) and (A6). C, plot of the charge equilibration rate r = (α+β) vs. K1/2; according to eqn (A3), the slope represents k1.D, voltage dependence of K1/2; □, experimental data (from Fig. 6); ▪, data derived from eqn (A3), using the k1 value from C.
Taken together these observations lead to the following functional sequence: (i) Na+ enters a diffusive path within the transporter; (ii) it migrates (with rate β) to a position on the inner side of the electrical field; (iii) it binds there and triggers a conformational change which increases the affinity for GABA (Lester et al. 1996); (iv, a) if no GABA binds the path can be travelled backwards (with rate α); (iv, b) if GABA binds to the transporter (and presumably decreases the energy barrier for charge unbinding), Na+ (and possibly other co-ions) is released to the cytosol (which presumably lowers the affinity of the GABA binding site); and (v) GABA itself is released to the cytosol and the transporter returns to the initial state.
The simplicity of the present interpretation may seem surprising when compared with the complexity of proposed models of cotransporter functioning (Parent et al. 1992b; Su et al. 1996; Hilgemann & Lu, 1999). Clearly, the relations introduced above do not consider the faster partial reactions of the cycle, in particular those involving the effects of intracellular substrates. In intact oocytes the intracellular concentrations of Na+ and Cl− are estimated to be around 10-20 and 40-50 mm, respectively (Kusano et al. 1982; Barish, 1983), while for GABA there is apparently no information. Assuming that negligible amounts of GABA are present in the cytosol at the beginning of experiments, it is possible to estimate that, even at the end of the longest voltage-clamp protocols, the increments of internal sodium, chloride and GABA concentrations should not exceed 10 μm, an insignificant quantity for the two ions and also for GABA, given the reported K1/2 of about 2 mm for intracellular GABA (Lu & Hilgemann, 1999a). We might therefore be confident that the cytosolic concentrations of substrates do not change significantly during the experiment, and in particular that the GABA concentration always remains far below the levels necessary to induce reverse mode currents in the transporters (Lu & Hilgemann, 1999a).
Our analysis provides an explanation for the voltage dependence of the apparent affinity of the transporter for GABA: the substrate concentration producing the half-maximal current would be determined by the charge equilibration rate (r = α + β, eqn (A3)). Therefore the maximal apparent affinity will be observed when the rate is minimal; this occurs between -40 and -60 mV, depending on temperature (Binda et al. 2002), which certainly is a physiological condition both for presynaptic and glial membranes. Equation (A3) also allows the GABA binding rate (k1) to be estimated; it appears to be approximately constant at about 0.64 μm−1 s−1. The apparent voltage independence of k1 may indicate that GABA interacts with the transporter in a neutral or zwitterionic state.
The fact that α + β determines the apparent affinity may appear puzzling. An intuitive explanation may be as follows: when α is high (towards more positive potentials), the lifetime (1/α) of the GABA-accessible state T1 will be short and therefore the apparent affinity will be low; on the other hand, when β is high, higher concentrations of GABA will be needed to saturate the rapid return of the transporter to the GABA-accessible state (determined by β). Put more simply, the higher the rate with which charges in various positions equilibrate, the higher the concentration of GABA needed to divert the same fraction of charges from back and forth shuttling to release to the cytosol.
In this work we have shown that the currents generated by the GABA cotransporter rGAT1 in the absence of its organic substrate are strictly related to the currents observed in the presence of GABA. We explain this correlation as a progressive conversion from an intramembrane (capacitive) to a transmembrane (conductive) movement of charges, driven by GABA in a concentration-dependent fashion. The key experimental findings are nicely reproduced by a kinetic scheme with very few relevant states. The sequence of binding of all cosubstrates has not been the object of specific experimental investigation, but the fixed sequence ‘GABA before Na+’ must be discarded. Either random binding or the ‘Na+ before GABA’ sequence appears to be compatible with the results. The latter option is more likely on thermodynamic grounds, and would imply that Na+ interaction and charge migration are needed to make the transporter accessible for GABA.
Acknowledgments
We are grateful to Professor H. A. Lester and Dr C. Labarca for the generous gift of rGAT cDNA. This work was supported by a PRIN grant from the Italian Ministry for University and Research to A. Peres.
APPENDIX
The kinetic scheme illustrated in Fig. 7 is described by the following differential system:
 |
where n0, n1 and n2 are the molar fractions of transporter states T0, T1 and T2, respectively.
Obviously, n0+ n1+ n2 = 1.
The system may be solved analytically at steady state, giving the solution:
 |
We shall assume here that GABA and ions will dissociate towards the cytosol as soon as the complex T2 is formed and that the transporter will instantaneously return to state T0. This statement corresponds to assuming γ → ∞. The above relations become:
 |
Clearly the condition n0+ n1+ n2 = 1 is verified. T2 may therefore be considered an evanescent state that disappears towards T0 as soon as it is formed. Note that the value of k2 becomes totally irrelevant with respect to the kinetics of the system.
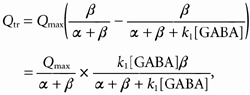
In the scheme of Fig. 7, the transport-associated current will be given by:
where q is the charge for each transporter and N is the number of transporter molecules.
With the same above assumptions (γ → ∞, and n2 → 0) and with Qmax = -qN:
or
| (A1) |
In the absence of organic substrate, i.e. [GABA] = 0, the above relation reduces to:
while, at saturation (k1 [GABA] >> α + β):
| (A2) |
which is identical to text eqn (3a).
From eqn (A1), the GABA concentration giving rise to the half-maximal current will be:
| (A3) |
and it can be readily noted that this relation is in agreement with the experimentally observed voltage dependence of K1/2 (Fig. 6D).
Considering now the intramembrane charge movement giving rise to the presteady-state current, we shall have:
| (A4) |
and when [GABA] = 0:
| (A5) |
The amount of charge sustaining the transport-associated current (Qtr) will be the difference between Qin at zero GABA and Qin in the presence of GABA:
 |
(A6) |
which is identical to text eqn (5).
From eqns (A1) and (A6) we also have:
| (A7) |
This last relation justifies text eqn (4) and validates the procedure used in the analysis of Fig. 6.
References
- Armstrong CM, Bezanilla F. Charge movement associated with the opening and closing of the activation gates of the Na channels. Journal of General Physiology. 1974;63:533–552. doi: 10.1085/jgp.63.5.533. [DOI] [PMC free article] [PubMed] [Google Scholar]
- Barish ME. A transient calcium-dependent chloride current in the immature Xenopus oocyte. Journal of Physiology. 1983;342:309–325. doi: 10.1113/jphysiol.1983.sp014852. [DOI] [PMC free article] [PubMed] [Google Scholar]
- Binda F, Bossi E, Giovannardi S, Forlani G, Peres A. Temperature effects on the presteady-state and transport-associated currents of GABA cotransporter rGAT1. FEBS Letters. 2002;512:303–307. doi: 10.1016/s0014-5793(02)02271-8. [DOI] [PubMed] [Google Scholar]
- Bossi E, Centinaio E, Castagna M, Giovannardi S, Vincenti S, Sacchi VF, Peres A. Ion binding and permeation through the lepidopteran amino acid transporter KAAT1 expressed in Xenopus oocytes. Journal of Physiology. 1999;515:729–742. doi: 10.1111/j.1469-7793.1999.729ab.x. [DOI] [PMC free article] [PubMed] [Google Scholar]
- Bossi E, Giovannardi S, Binda F, Forlani G, Peres A. Role of anion-cation interactions on the pre-steady-state currents of the rat Na+-Cl−-dependent GABA cotransporter rGAT1. Journal of Physiology. 2002;541:343–350. doi: 10.1113/jphysiol.2001.013457. [DOI] [PMC free article] [PubMed] [Google Scholar]
- Catterall WA. Structure and function of voltage-gated ion channels. Trends in Neurosciences. 1993;16:500–506. doi: 10.1016/0166-2236(93)90193-p. [DOI] [PubMed] [Google Scholar]
- DeFelice LJ. Electrical Properties of Cells. 1. New York: Plenum Press; 1997. [Google Scholar]
- DeFelice LJ, Adams SV, Ypey DL. Single-file diffusion and neurotransmitter transporters: Hodgkin and Keynes model revisited. Biosystems. 2001;62:57–66. doi: 10.1016/s0303-2647(01)00137-x. [DOI] [PubMed] [Google Scholar]
- Dodge FA, Frankenhaeuser B. Sodium currents in the myelinated nerve fibres of Xenopus laevis investigated with the voltage clamp technique. Journal of Physiology. 1959;148:188–200. doi: 10.1113/jphysiol.1959.sp006281. [DOI] [PMC free article] [PubMed] [Google Scholar]
- Forlani G, Bossi E, Ghirardelli R, Giovannardi S, Binda F, Bonadiman L, Ielmini L, Peres A. Mutation K448E in the external loop 5 of rat GABA transporter rGAT1 induces pH sensitivity and altered substrate interactions. Journal of Physiology. 2001a;536:479–494. doi: 10.1111/j.1469-7793.2001.0479c.xd. [DOI] [PMC free article] [PubMed] [Google Scholar]
- Forlani G, Bossi E, Perego C, Giovannardi S, Peres A. Three kinds of currents in the canine Betaine/GABA transporter BGT-1 expressed in Xenopus laevis oocytes. Biochimica et Biophysica Acta: Molecular Cell Research. 2001b;1538:172–180. doi: 10.1016/s0167-4889(00)00144-0. [DOI] [PubMed] [Google Scholar]
- Forster IC, Biber J, Murer H. Proton-sensitive transitions of renal type II Na+-coupled phosphate cotransporter kinetics. Biophysical Journal. 2000;79:215–230. doi: 10.1016/S0006-3495(00)76285-0. [DOI] [PMC free article] [PubMed] [Google Scholar]
- Hazama A, Loo DDF, Wright EM. Presteady-state currents of the rabbit Na+/glucose cotransporter (SGLT1) Journal of Membrane Biology. 1997;155:175–186. doi: 10.1007/s002329900169. [DOI] [PubMed] [Google Scholar]
- Hilgemann DW, Lu C-C. GAT1 (GABA:Na+:Cl−) cotransport function. Database reconstruction with an alternating access model. Journal of General Physiology. 1999;114:459–475. doi: 10.1085/jgp.114.3.459. [DOI] [PMC free article] [PubMed] [Google Scholar]
- Hille B. Ionic Channels of Excitable Membranes. 2. USA: Sinauer Associates; 1992. [Google Scholar]
- Hodgkin AL, Huxley AF. The components of membrane conductance in the giant axon of Loligo. Journal of Physiology. 1952;116:473–496. doi: 10.1113/jphysiol.1952.sp004718. [DOI] [PMC free article] [PubMed] [Google Scholar]
- Kusano K, Miledi R, Stinnakre J. Cholinergic and catecholaminergic receptors in the Xenopus oocyte membrane. Journal of Physiology. 1982;328:143–170. doi: 10.1113/jphysiol.1982.sp014257. [DOI] [PMC free article] [PubMed] [Google Scholar]
- Läuger P. Electrogenic Ion Pumps. USA: Sinauer Associates; 1991. [Google Scholar]
- Lester HA, Cao Y, Mager S. Listening to neurotransmitter transporters. Neuron. 1996;17:807–810. doi: 10.1016/s0896-6273(00)80213-5. [DOI] [PubMed] [Google Scholar]
- Loo DDF, Hirayama BA, Gallardo EM, Lam JT, Turk E, Wright EM. Conformational changes couple Na+ and glucose transport. Proceedings of the National Academy of Sciences of the USA. 1998;95:7789–7794. doi: 10.1073/pnas.95.13.7789. [DOI] [PMC free article] [PubMed] [Google Scholar]
- Lu C-C, Hilgemann DW. GAT1 (GABA:Na+:Cl−) cotransport function. Steady state studies in giant Xenopus oocyte membrane patches. Journal of General Physiology. 1999a;114:429–444. doi: 10.1085/jgp.114.3.429. [DOI] [PMC free article] [PubMed] [Google Scholar]
- Lu C-C, Hilgemann DW. GAT1 (GABA:Na+:Cl−) cotransport function. Kinetic studies in giant Xenopus oocyte membrane patches. Journal of General Physiology. 1999b;114:445–457. doi: 10.1085/jgp.114.3.445. [DOI] [PMC free article] [PubMed] [Google Scholar]
- Mager S, Kleinberger-Doron N, Keshet GI, Davidson N, Kanner BI, Lester HA. Ion binding and permeation at the GABA transporter GAT1. Journal of Neuroscience. 1996;16:5405–5414. doi: 10.1523/JNEUROSCI.16-17-05405.1996. [DOI] [PMC free article] [PubMed] [Google Scholar]
- Mager S, Naeve J, Quick M, Labarca C, Davidson N, Lester HA. Steady states, charge movements, and rates for a cloned GABA transporter expressed in Xenopus oocytes. Neuron. 1993;10:177–188. doi: 10.1016/0896-6273(93)90309-f. [DOI] [PubMed] [Google Scholar]
- Parent L, Supplisson S, Loo DDF, Wright EM. Electrogenic properties of the cloned Na+/glucose transporter: I. Voltage-clamp studies. Journal of Membrane Biology. 1992a;125:49–62. doi: 10.1007/BF00235797. [DOI] [PubMed] [Google Scholar]
- Parent L, Supplisson S, Loo DDF, Wright EM. Electrogenic properties of the cloned Na+/glucose cotransporter: II. A transport model under nonrapid equilibrium conditions. Journal of Membrane Biology. 1992b;125:63–79. doi: 10.1007/BF00235798. [DOI] [PubMed] [Google Scholar]
- Su A, Mager S, Mayo SL, Lester HA. A multi-substrate single-file model for ion-coupled transporters. Biophysical Journal. 1996;70:762–777. doi: 10.1016/S0006-3495(96)79616-9. [DOI] [PMC free article] [PubMed] [Google Scholar]