

Abstract
Rationale and Objectives
The purpose of this study was to analyze the variability of experienced thoracic radiologists in the identification of lung nodules on CT scans and thereby to investigate variability in the establishment of the “truth” against which nodule-based studies are measured.
Materials and Methods
Thirty CT scans were reviewed twice by four thoracic radiologists through a two-phase image annotation process. During the initial “blinded read” phase, radiologists independently marked lesions they identified as “nodule ≥ 3mm (diameter),” “nodule < 3mm,” or “non-nodule ≥ 3mm.” During the subsequent “unblinded read” phase, the blinded read results of all radiologists were revealed to each of the four radiologists, who then independently reviewed their marks along with the anonymous marks of their colleagues; a radiologist’s own marks then could be deleted, added, or left unchanged. This approach was developed to identify, as completely as possible, all nodules in a scan without requiring forced consensus.
Results
After the initial blinded read phase, a total of 71 lesions received “nodule ≥ 3mm” marks from at least one radiologist; however, all four radiologists assigned such marks to only 24 (33.8%) of these lesions. Following the unblinded reads, a total of 59 lesions were marked as “nodule ≥ 3 mm” by at least one radiologist. 27 (45.8%) of these lesions received such marks from all four radiologists, 3 (5.1%) were identified as such by three radiologists, 12 (20.3%) were identified by two radiologists, and 17 (28.8%) were identified by only a single radiologist.
Conclusion
The two-phase image annotation process yields improved agreement among radiologists in the interpretation of nodules ≥ 3mm. Nevertheless, substantial variabilty remains across radiologists in the task of lung nodule identification.
Keywords: lung nodule, computed tomography (CT), thoracic imaging, inter-observer variability, computer-aided diagnosis (CAD)
INTRODUCTION
Both the interest in and demand for computer-aided diagnostic (CAD) methods for a variety of radiologic tasks involving lung nodules and computed tomography (CT) scans have been rapidly accelerating. CAD for thoracic CT is no longer in its infancy. In fact, the field has matured to the point that regulatory approval is now a practical consideration, and clinical radiologists faced with the task of both identifying and characterizing lung nodules on large, multidetector row CT data sets recognize the need for computerized assistance (1, 2). As more investigators seek to contribute to this expanding field, a common constraint has become evident—limited access to well-characterized image data.
Recognizing that the development of CAD methods by the medical imaging research community would be facilitated and stimulated through access to a well-characterized repository of CT scans, the National Cancer Institute (NCI) formed the Lung Image Database Consortium (LIDC) (3, 4). The publicly accessible database of CT scans and corresponding “truth” being created by the LIDC is expected to hasten advancement of lung nodule CAD research by (1) providing clinical images to investigators who might not have access to patient images and (2) allowing for a direct comparison of CAD methods reported in the literature by eliminating database composition as a source of variability in system performance (5).
Two fundamental requirements are common to all CAD research: patient image data and a task-specific definition of “truth” (3). For investigators not affiliated with medical centers, access to image data requires collaborative research agreements that may be hindered by federal regulations governing the transmission of patient data (including images) to outside institutions (6). Even for investigators associated with medical centers, the task of identifying and collecting appropriate images for any specific research activity is a laborious, time-consuming, and expensive process.
Once an appropriate set of images has been assembled, “truth” must be established (7). Investigators developing automated lung nodule detection methods, for example, require the opinion of an experienced radiologist regarding the location of nodules within the CT scans. More appropriately, a panel of experienced thoracic radiologists would be used to establish the “truth” for the nodule-detection task, since radiologists can miss lung nodules (8, 9) and the variability among radiologists in the detection of lung nodules is known to be substantial (10-13) (some investigators even incorporate the output from the CAD system itself into the “truth” assessment (14, 15)). Furthermore, the notion of a single “truth” in any particular instance is elusive (16), with differences of opinion in the interpretation of images among even experienced thoracic radiologists a reality (13). The resulting variability in the “truth” must be understood and appreciated by CAD investigators.
The purpose of this study was to analyze the variability of experienced thoracic radiologists in the identification of lung nodules on CT scans. The study involved the first 30 CT scans collected and reviewed by LIDC radiologists (publicly available at http://ncia.nci.nih.gov). In effect, this study investigated variability in the establishment of “truth”—the “gold standard” against which nodule-based studies (whether radiologist performance or CAD performance) are measured. The results of this study also have implications for the clinical practice of radiology.
MATERIALS AND METHODS
Patient image data
A total of 30 thoracic helical CT scans (six from each of the five LIDC institutions) was collected for the first phase of the LIDC database, in accordance with the inclusion criteria previously published (3, 4). Appropriate local IRB approval was obtained. The LIDC radiologist at each site retrospectively selected six scans from that site’s screening or diagnostic CT examinations; the site then became known as the “originating site” for those scans. Scans collected for the database had been acquired in accordance with each site’s independently established clinical or on-going research imaging protocols. The LIDC did not prescribe the institution’s CT scanning protocols, and no CT scan was performed specifically for inclusion in the LIDC database. Each scan was required to have a collimation and reconstruction interval no greater than 3 mm. As a general guideline, scans selected at each site were limited to approximately six lung nodules with longest diameter less than 30 mm (consistent with the accepted upper limit of nodule size (17)) and greater than or equal to 3 mm (a lower limit imposed for practical considerations (3)), as determined by the originating site’s LIDC radiologist during a cursory review. The purpose of this rough limit on the number of nodules was to avoid the selection of scans with a preponderance of nodules rather than to establish an initial impression of nodule locations. Scans could include high levels of noise or streak, motion, or metal artifacts, unless the interpretation of nodules in the scan was compromised by the presence of the noise or artifact. The presence of other pathology was acceptable, unless that pathology was spatially contiguous with nodules and substantially interfered with their visual interpretation, as determined by the originating site’s LIDC radiologist. A nodule could be primary lung cancer, metastatic disease, a non-cancerous process, or indeterminate in nature.
The 30 scans each had been acquired from different patients (12 females, 18 males; age 22-84 years, median 60 years). Since the scans were collected from five different institutions, a range of scanner manufacturers and models was represented (four different LightSpeed scanners from GE Medical Systems, three different Brilliance scanners from Philips, an Emotion scanner and a Sensation scanner from Siemens, and an Aquilion scanner from Toshiba). The tube peak potential energies used for scan acquisition were as follows: 120 kV (n=21), 130 kV (n=1), 135 kV (n=4), and 140 kV (n=4). Tube current ranged from 40-486 mA (mean: 180 mA). Slice thicknesses were 1.25 mm (n=2), 1.5 mm (n=1), 2.0 mm (n=12), 2.5 mm (n=10), and 3 mm (n=5). Reconstruction interval ranged from 0.75-3.0 mm (mean: 1.9 mm). The in-plane resolution of the 512×512-pixel sections ranged from 0.542-0.750 mm (mean: 0.658 mm). While the convolution kernels used for image reconstruction differ among manufacturers, these convolution kernels may be classified broadly as “standard/non-enhancing” (n=19), “slightly enhancing” (n=11), and “over-enhancing” (n=0) (in order of increasing spatial frequencies accentuated by each class). A majority of the scans, 66.7% (20/30), had been performed without the administration of intravenous contrast material.
Data collection process
The LIDC developed a data collection process model that governs (1) the identification of appropriate CT scans, (2) the assessment of lesion location and extent (spatial “truth”), (3) the cataloguing of scans and nodules, (4) the recording of pertinent information about each nodule, and (5) the coordination of these activities across the five geographically disparate institution. The process model details the steps required to translate a CT scan acquired for the clinical evaluation of a patient into a viable element of the LIDC database. Identification of a candidate scan set in motion a sequence of events that began at the local institution and extended to the other four institutions. First, the scan was transferred to the local research computer, where it was catalogued through a local DICOM receiver. Anonymization software was applied to remove all protected health information contained within the DICOM headers of the images in accordance with HIPAA guidelines (6).
The anonymized scan was made available to the other four institutions for the identification of lesions. Rather than a forced consensus panel approach, the LIDC adopted a combination of “blinded” and “unblinded” reading sessions by multiple radiologists (i.e., one LIDC radiologist at each of the other four institutions, so that each radiologist reviewed 24 of the 30 scans) to establish estimates of both the spatial location of lesions (in terms of (x, y, z) coordinates) and the spatial extent of lesions considered to be nodules (in terms of nodule outlines). The “blinded” and “unblinded” reads are both part of the same process that attempts to identify, as completely as possible, all lesions in a scan (with an emphasis on lung nodules). In this approach, the designated LIDC radiologist at each site first performs an independent “blinded” read by identifying (1) the spatial location and extent of all nodules with greatest in-plane dimensions ≥ 3 mm that do not exceed 30 mm, regardless of presumed histology (“nodule ≥ 3 mm”), (2) the spatial location of all nodules < 3 mm that are not clearly benign (“nodule < 3 mm”), and (3) the spatial location of all other intraparenchymal lesions ≥ 3 mm (“non-nodule ≥ 3 mm”). Non-nodules were identified for the sake of completeness, thus indicating to potential users of the database that an abnormality is present at a certain location even though that abnormality may not be considered a “nodule.” The radiologists used a computer interface to construct outlines around nodules ≥ 3 mm in each CT section in which the nodule appeared, and they marked only the approximate three-dimensional center-of-mass location for both nodules < 3 mm and non-nodules ≥ 3 mm. Measurement tools were available through the interface to assist the radiologists determine whether a lesion’s dimension exceeded the 3-mm threshold. Only transaxial sections were reviewed; non-axial reformatted images and maximum-intensity projection images were not available. During this initial phase, each radiologist interpreted the original scan independently from the radiologists at the other three institutions reviewing that scan, hence the term “blinded” review.
Monitors with clinically acceptable specifications were used at each site, and each monitor used was calibrated with a VeriLUM Color Dual Mode Pod (IMAGE Smiths, Kensington, MD). Ambient lighting was set to simulate the clinical reading environment. Each CT scan was initially presented at a standard brightness/contrast setting without magnification, but the radiologists were allowed to adjust brightness, contrast, and magnification as appropriate to enable the most complete interpretation of the scan.
After the completion of the blinded reads by all four radiologists, each radiologist independently performed an “unblinded” read. During this unblinded read, the radiologists reviewed all lesions marked during the blinded reads of all four radiologists. They had knowledge of which marks were their own but did not know which specific radiologist assigned any of the other marks. Each radiologist then made a final decision regarding the classification of each lesion. Note that a forced consensus was not imposed; rather, all of the lesions indicated by the reviewing radiologists were recorded and will be made available to users of the database.
The LIDC radiologists who participated in this study were experienced thoracic radiologists each with a minimum of 15 years experience. The radiologists were involved in the design of the data collection process and in the formulation of the three lesion categories. All radiologists were familiar with the computer interface they used to identify lesions.
Analysis of lesions
To analyze agreements and disagreements among radiologists at both the blinded and unblinded stages, all marks placed by each of the four radiologists who read each scan were visually reviewed and inventoried by a single LIDC principal investigator. The marks of individual radiologists from the blinded and unblinded reads were analyzed separately to capture trends in the radiologists’ decision-making process. While the outcomes of the blinded and unblinded reads were evaluated separately for this study, the blinded and unblinded reads each represent one component of what was designed as a single, integrated process; only the results of the complete process (i.e., the post-unblinded reads from all four readers) are included in the public release of the first 30 scans from the LIDC.
For each scan the marks of the blinded read were reviewed first followed by a review of the unblinded read marks through a computer interface. This interface displayed simultaneously all marks assigned by all radiologists during one of the two reading sessions. The marks were displayed within the images at the spatial locations indicated by the radiologists during the reading sessions, and the displayed marks of each radiologist were color-coded to allow visual distinction among the marks of different radiologists. A mark indicating a “non-nodule ≥ 3 mm” (which will be referred to simply as a “non-nodule”) was displayed as a single “X” at the image location specified by the radiologist, a mark indicating a “nodule < 3 mm” (which will be referred to as a “micronodule”) was displayed as a single hexagon circumscribing the lesion and centered at the image location specified by the radiologist, and the indication of a “nodule ≥ 3 mm” (which will be referred to simply as a “nodule”) was the complete nodule outline created by the radiologist in all CT sections that contain the nodule. The interface loaded the images from one complete scan, together with the aggregate of all four radiologists’ marks from either the blinded or unblinded reads, and provided the ability to raster through the sections of the scan for visual review of all radiologist marks, which could be suppressed to view the underlying lesions without obstruction. The term “micronodule” has been adopted in the context of this study solely for ease of discussion, and the 3-mm size threshold is somewhat arbitrary; it is not our intent to recommend the general use of this term or to advance a specific definition the term.
The first task was to inventory distinct lesions identified by the radiologists. A lesion was defined when at least one radiologist placed a mark within the scan during either their blinded or unblinded reading session. Marks considered to represent the same physical lesion within the scan were grouped together, recognizing that the same lesion could have been assigned marks representing different lesion categories by different radiologists (Figure 1). Grouping was performed by visual inspection of all radiologist marks followed by a subjective determination of the three-dimensional contiguity of the lesions those marks were intended to represent (see Figure 1). Distinct lesions were initially defined based on a review of the marks of all radiologists assigned during the blinded read; this set of distinct lesions then was verified based on a review of the marks of all radiologists during the unblinded read. This grouping of marks defined the inventory of lesions that provided the basis for all subsequent analyses. It should be noted that had marks been grouped differently, slight differences in the reported results would be expected, since all results were obtained from a by-lesion assessment of the categories (i.e., “nodule,” “micronodule,” “non-nodule,” or no category) assigned by different radiologists during the blinded and unblinded reading sessions.
Figure 1.
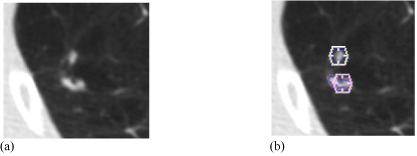
(a) A region from one transaxial CT section. (b) The assigned unblinded read marks. A hexagon indicates an assigned “nodule < 3 mm” mark, while contours constructed by a radiologist indicate a “nodule ≥ 3 mm” designation. Based on a manual assessment of the three-dimensional contiguity of lesions and marks in the scan, these five marks were grouped into two distinct lesions: the upper lesion with one radiologist’s “nodule < 3 mm” mark and another radiologist’s “nodule ≥ 3mm” mark, and the lower lesion with one radiologist’s “nodule < 3 mm” mark and two radiologists’ “nodule ≥ 3mm” marks.
The second task was to identify how many radiologists marked each lesion and to which lesion category or categories each was assigned. The third task was to determine concordance among radiologists during the blinded reads and then again during the unblinded reads. The fourth task was to examine differences between the blinded and unblinded reads of each radiologist. Although the data collection process we employed did not allow for advanced statistical analyses (each of the five LIDC radiologists reviewed a different subset of 24 of the 30 scans, since radiologists did not review the six scans originated by their own institution), this study provided extensive image-interpretation data and demonstrated general trends in radiologist review of the CT scans.
RESULTS
Numbers of identified lesions
A total of 466 distinct lesions (nodules, micronodules, and non-nodules) were identified in the 30 CT scans by the radiologists (i.e., marked by at least one radiologist during either the blinded or unblinded read). Of this total, 23 lesions were marked by radiologists during the blinded reading phase only and were not marked by any radiologist during the unblinded reading phase; therefore, the unblinded reading phase yielded 443 lesions. Each of these blinded-read-only lesions was marked by the same single radiologist (Radiologist C): 15 of these were marked as “micronodule” and eight were marked as “non-nodule.” One lesion was marked by radiologists during the unblinded reading phase only so that the blinded reading phase yielded 465 lesions (Figures 2 and 3). This one unblinded-read-only lesion was marked by a single radiologist (also Radiologist C) as a “non-nodule.”
Figure 2.

Number of lesions marked by at least one radiologist during the blinded and unblinded reading sessions.
Figure 3.
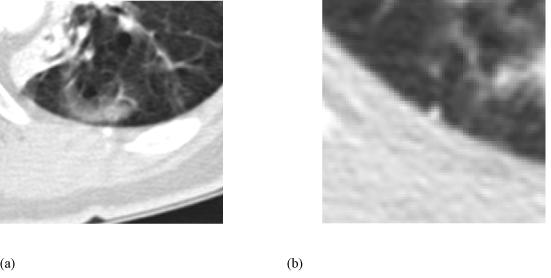
(a) The single lesion that was marked only during the unblinded reading phase and (b) a lesion that was marked only during the blinded reading phase. The lesion in (a) was not marked by any radiologists during the blinded reading phase, but was marked as a “non-nodule” by one radiologist during the unblinded reading phase. The lesion in (b) was marked as a “micronodule” by a single radiologist during the blinded reading phase, but was not marked by any radiologist during the unblinded reading phase.
The numbers of lesions marked by different radiologists during the blinded and unblinded reads are presented in Table 1. The percentage of lesions marked by each radiologist increased between their respective blinded and unblinded reads. The numbers of lesions that were marked by different numbers of radiologists during the blinded and unblinded reads are presented in Figure 4. Blinded-read-only lesions and unblinded-read-only lesions appear at zero along the x-axis of Figure 4. On the opposite extreme of the x-axis, 68 (14.6%) of the 465 blinded-read lesions were marked by all four radiologists and 102 (23.0%) of the 443 unblinded-read lesions were marked by all four radiologists; these numbers, however, do not necessarily imply agreement on the classification of these lesions, since the radiologist marks could represent different lesion categories. Thus, this graph shows agreement by lesion location, but not necessarily agreement by lesion category.
Table 1.
Numbers of lesions marked by different radiologists during blinded and unblinded reads. Each of the five LIDC sites contributed six scans (for a total of 30 scans), and the radiologists, one from each of the LIDC sites, did not read scans from their own institution; accordingly, the total number of lesions in scans read by each radiologist was different
| Radiologist | Total number of lesions in scans read by radiologist (blinded read) | Marked blinded lesions | Total number of lesions in scans read by radiologist (unblinded read) | Marked unblinded lesions |
|---|---|---|---|---|
| A | 338 | 159 (47.0%) | 323 | 286 (88.5%) |
| B | 359 | 115 (32.0%) | 349 | 122 (35.0%) |
| C | 386 | 282 (73.1%) | 364 | 332 (91.2%) |
| D | 376 | 131 (34.8%) | 355 | 142 (40.0%) |
| E | 401 | 179 (44.6%) | 381 | 259 (68.0%) |
Figure 4.

The distribution of the number of radiologists (out of a maximum of 4) marking individual lesions (from among the 466 lesions identified by at least one radiologist in this study) during the blinded and unblinded reads. Blinded-read-only lesions and unblinded-read-only lesions appear at 0 along the x-axis.
Lesion category evaluation
Figure 5 presents the distribution of the change in the numbers of radiologists marking individual lesions between the blinded and unblinded reads and the distribution of the change in the numbers of lesion categories to which those marks were assigned for individual lesions between the blinded and unblinded reads. The mode of both distributions is zero, where no change indicates that the same number of radiologists marked the lesion during both blinded and unblinded reads (for the radiologist distribution) and that marks were assigned to the same number of categories during both the blinded and unblinded reads (for the lesion category distribution). The trend toward more radiologists marking lesions during the unblinded reads (right skew of the radiologist distribution) and the trend toward those marks spanning fewer lesion categories (left skew of the category distribution) are evident.
Figure 5.

The distribution of change in the number of radiologists marking individual lesions between blinded and unblinded reads, and the distribution of change in the number of lesion categories to which those marks were assigned for individual lesions between the blinded and unblinded reads. While the mode of both distributions is 0, the trend toward more radiologists marking lesions in the unblinded reads (right skew of the radiologist distribution) and the trend toward those marks spanning fewer lesion categories (left skew of the category distribution) are evident.
The marks assigned by the radiologists during the unblinded reads were exactly the same (in terms of lesion category) as the marks those radiologists had assigned during the blinded reads in only 145 (31.1%) of the 466 total lesions. The unblinded reads of the remaining 321 lesions differed from the blinded reads as a result of (1) one or more radiologists marking a lesion during the unblinded read that they had not marked during the blinded read (which occurred for 264 (82.2%) of these 321 lesions), (2) one or more radiologists removing a mark from a lesion during the unblinded read that they had marked during the blinded read (which occurred for 75 lesions (23.4%)), (3) one or more radiologists changing the assigned lesion category (which occurred for 30 lesions (9.3%)), or (4) some combination of these actions (which occurred for 48 lesions (15.0%)).
To identify the consistency of an individual radiologist’s assessment of lesions between the blinded and unblinded reads, Table 2 presents the numbers of lesions assigned to each category (including the “null” category in which no mark was placed) during the blinded and unblinded reads by each radiologist. For example, 38 of the lesions observed by Radiologist A were assigned to the “nodule” category during both the blinded and the unblinded reads of Radiologist A, while 4 lesions marked as “nodules” and 69 lesions marked as “micronodules” during the unblinded read of Radiologist A had not been marked at all by Radiologist A during the blinded read. Of the 12 possible changes in lesion category between blinded and unblinded reads (nodule to micronodule, nodule to non-nodule, nodule to no mark, micronodule to non-nodule, micronodule to no mark, non-nodule to no mark, and the reverse change for each of the above), all occurred at least once across radiologists (see Table 3). The most common change (with 191 occurrences) was a lesion that received no mark by a specific radiologist during the blinded read then being marked by that radiologist as a non-nodule during the unblinded read, while the change that occurred the least (with a single occurrence) was a blinded-read non-nodule lesion marked as a nodule during the unblinded read.
Table 2.
Numbers of lesions assigned to each lesion category during the blinded and unblinded reads. For scans reviewed by each radiologist, the table tracks individual lesions marked by at least one of the four radiologists who reviewed that scan during the blinded or unblinded reads. These lesions are recorded by the lesion category, if any, to which the lesion was assigned during the two reading sessions of the specified radiologist. The numbers in parentheses convert the numbers of lesions to percentages based on all identified lesions in the scans reviewed by the radiologist
| Unblinded Read | |||||
|---|---|---|---|---|---|
| nodule | micronodule | non-nodule | no mark | ||
| Radiologist A Blinded Read | nodule | 38 (11.2) | 0 | 1 (0.3) | 1 (0.3) |
| micronodule | 0 | 21 (6.2) | 0 | 0 | |
| non-nodule | 0 | 1 (0.3) | 94 (27.8) | 3 (0.9) | |
| no mark | 4 (1.2) | 69 (20.4) | 58 (17.2) | 48 (14.2) | |
| Radiologist B Blinded Read | nodule | 25 (6.9) | 0 | 0 | 0 |
| micronodule | 0 | 24 (6.7) | 0 | 0 | |
| non-nodule | 0 | 0 | 66 (18.3) | 0 | |
| no mark | 1 (0.3) | 2 (0.6) | 4 (1.1) | 238 (66.1) | |
| Radiologist C Blinded Read | nodule | 23 (5.9) | 1 (0.3) | 1 (0.3) | 1 (0.3) |
| micronodule | 1 (0.3) | 97 (25.1) | 6 (1.6) | 22 (5.7) | |
| non-nodule | 0 | 0 | 115 (29.7) | 15 (3.9) | |
| no mark | 2 (0.5) | 25 (6.5) | 61 (15.8) | 17 (4.4) | |
| Radiologist D Blinded Read | nodule | 23 (6.1) | 0 | 0 | 1 (0.3) |
| micronodule | 3 (0.8) | 32 (8.5) | 2 (0.5) | 8 (2.1) | |
| non-nodule | 1 (0.3) | 2 (0.5) | 47 (12.5) | 12 (3.2) | |
| no mark | 0 | 18 (4.8) | 14 (3.7) | 214 (56.8) | |
| Radiologist E Blinded Read | nodule | 34 (8.5) | 7 (1.7) | 7 (1.7) | 1 (0.2) |
| micronodule | 0 | 20 (5.0) | 1 (0.2) | 0 | |
| non-nodule | 0 | 2 (0.5) | 96 (23.9) | 11 (2.7) | |
| no mark | 3 (0.7) | 35 (8.7) | 54 (13.4) | 131 (32.6) | |
Table 3.
Number of lesions (across radiologists) for which changes in lesion category occurred between the blinded and unblinded reads of a particular radiologist. For example, if two radiologists both assigned the category “nodule” to a specific lesion during their respective blinded reads and then both radiologists changed their assigned category for that lesion to “micronodule” during their respective unblinded reads, then this lesion would be counted twice in the first row of the table. The data presented in this table were extracted from Table 2
| Blinded-to-Unblinded Lesion Category Change | Number of Radiologist-Lesions |
|---|---|
| nodule -> micronodule | 8 |
| nodule -> non-nodule | 9 |
| nodule -> no mark | 4 |
| micronodule -> non-nodule | 9 |
| micronodule -> no mark | 30 |
| non-nodule -> no mark | 41 |
| micronodule -> nodule | 4 |
| non-nodule -> nodule | 1 |
| non-nodule -> micronodule | 5 |
| no mark -> nodule | 10 |
| no mark -> micronodule | 149 |
| no mark -> non-nodule | 191 |
Table 4 presents by lesion category the total number of lesions marked by each radiologist during the blinded and unblinded reads. Table 5 presents the agreement (in terms of kappa value) among pairwise combinations of radiologists for the blinded and unblinded reading phases. The mean pairwise kappa values for the blinded and unblinded reading phases are 0.25 and 0.39, respectively.
Table 4.
Total number of lesions marked by each radiologist during blinded and unblinded reads presented by lesion category. Note that since each scan was reviewed by four of the five study radiologists, different subsets of scans were reviewed by different groupings of four radiologists so that no two radiologists reviewed the same subset of scans; therefore, the total number of lesions is not the same across radiologists. The data presented in this table were extracted from Table 2. The “no mark” category indicates that a radiologist did not mark a lesion that was marked by at least one other radiologist
| nodule | micronodule | non-nodule | no mark | ||
|---|---|---|---|---|---|
| Radiologist A | Blinded read | 40 | 21 | 98 | 179 |
| Unblinded read | 42 | 91 | 153 | 52 | |
| Radiologist B | Blinded read | 25 | 24 | 66 | 245 |
| Unblinded read | 26 | 26 | 70 | 238 | |
| Radiologist C | Blinded read | 26 | 126 | 130 | 105 |
| Unblinded read | 26 | 123 | 183 | 55 | |
| Radiologist D | Blinded read | 24 | 45 | 62 | 246 |
| Unblinded read | 27 | 52 | 63 | 235 | |
| Radiologist E | Blinded read | 49 | 21 | 109 | 223 |
| Unblinded read | 37 | 64 | 158 | 143 |
Table 5.
Agreement (kappa) among pairwise combinations of radiologists for the blinded reading phase (first value) and the unblinded reading phase (second value). The number of lesions in scans reviewed by both radiologists is given in parentheses
| Radiologist | A | B | C | D | E |
|---|---|---|---|---|---|
| A | - | 0.36 / 0.25 (232) | 0.20 / 0.65 (259) | 0.31 / 0.33 (249) | 0.32 / 0.56 (274) |
| B | - | 0.17 / 0.26 (281) | 0.34 / 0.36 (271) | 0.38 / 0.29 (296) | |
| C | - | 0.045 / 0.24 (298) | 0.076 / 0.47 (323) | ||
| D | - | 0.30 / 0.44 (313) | |||
| E | - | ||||
The data from Tables 2 and 3 that are most relevant to the LIDC database are the data that pertain to “nodules.” Table 3 indicates that in 21 instances a radiologist that had assigned a lesion to the “nodule” category during the blinded read changed the assigned category during the unblinded read to “micronodule” (n=8), “non-nodule” (n=9), or no mark at all (n=4) (see Figure 6a-c), while in 15 instances a radiologist changed the assigned category of a lesion to “nodule” during the unblinded read from a blinded read category of “micronodule” (n=4), “non-nodule” (n=1), or no mark at all (n=10) (see Figure 6d-f).
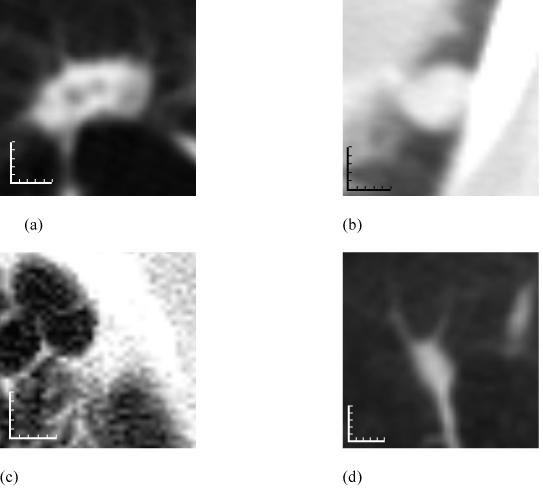
Figure 6.
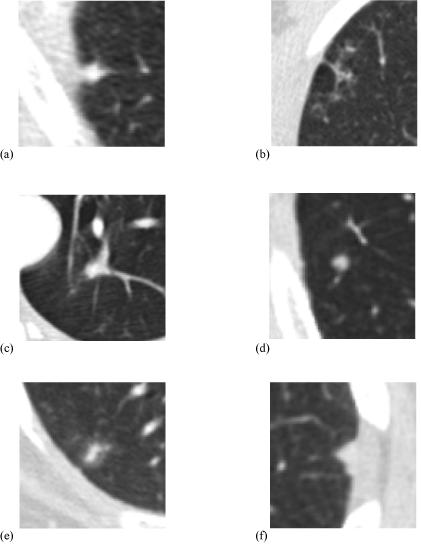
Examples of lesions for which radiologists changed their assigned lesion category between the blinded and unblinded reading sessions either to or from the “nodule” category. The categories of one radiologist are reported for each lesion. (a) A blinded read “nodule” by one radiologist that was changed to “micronodule” during the unblinded read of that same radiologist. (b) A blinded read “nodule” that was changed to “non-nodule” during the unblinded read. (c) A blinded read “nodule” that received no mark at all during the unblinded read. (d) A blinded read “micronodule” that was changed to “nodule” during the unblinded read. (e) A blinded read “non-nodule” that was changed to “nodule” during the unblinded read. (f) A lesion that did not receive any mark during the blinded read of one radiologist that was assigned to the “nodule” lesion category during the unblinded read of that same radiologist.
Evaluation of nodules ≥ 3 mm
The main focus of the LIDC effort is the identification of nodules ≥ 3 mm. Since these lesions have a greater probability of malignancy than micronodules or non-nodules and since these lesions receive the greatest attention from CAD developers, radiologist variability in the assessment of lesions designated as “nodules ≥ 3 mm” is of most interest. Table 6 tabulates, for all 466 lesions, the numbers of lesions assigned to the “nodule” lesion category by different numbers of radiologists during the blinded and unblinded reads. The marginal sums in Table 6 indicate that 71 (15.2%) of all 466 lesions were assigned to the “nodule” category by at least one radiologist during the blinded reads, a number that decreased to 59 (12.7%) during the unblinded reads as 12 lesions that had been marked “nodule” by a single radiologist during the blinded reads were assigned to some other lesion category during the unblinded reads.
Table 6.
Numbers of lesions assigned to the “nodule” category by different numbers of radiologists during the blinded and unblinded reads. All 466 lesions identified by at least one radiologist are represented. A total of 71 lesions were assigned to the “nodule” category by at least one radiologist during the blinded reads, and a total of 59 lesions were assigned to the “nodule” category by at least one radiologist during the unblinded reads
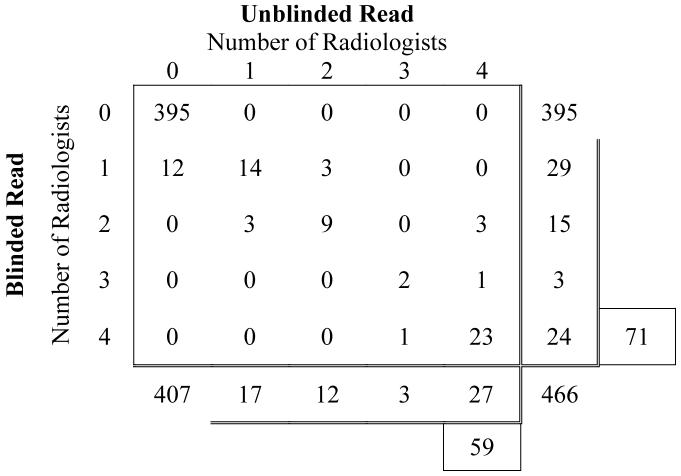 |
Of the 71 lesions that were assigned to the “nodule” category by at least one radiologist during the initial blinded reads, all four radiologists assigned this lesion category to only 24 (33.8%). Of the 59 lesions that were assigned to the “nodule” category by at least one radiologist during the unblinded reads, 27 (45.8%) were assigned to this category by all four radiologists, 3 (5.1%) were assigned to this category by 3 radiologists, 12 (20.3%) by 2 radiologists, and 17 (28.8%) by only a single radiologist (Figure 7). Twenty-three lesions were assigned to the “nodule” category by all four radiologists during both blinded and unblinded reading phases. Between the blinded and unblinded reading phases, the number of nodules on which all four radiologists agree increased from 33.8% (24/71) to 45.8% (27/59), the number of nodules on which at least three readers agree increased from 38.0% (27/71) to 50.9%(30/59), and the number of nodules on which at least two readers agree increased from 59.2% (42/71) to 71.2% (42/59).
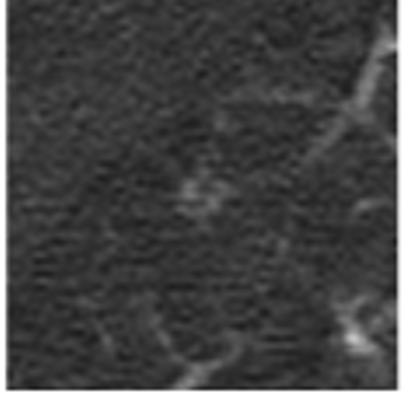
Figure 7.
Examples of lesions assigned to the “nodule” lesion category by different numbers of radiologists. (a) A lesion assigned to the “nodule” category by all four radiologists during both blinded and unblinded reading phases. (b) A lesion assigned to the “nodule” category by two radiologists during the blinded reads (the other two radiologists provided no mark during their blinded reads) and then by all four radiologists during the unblinded reads. (c) A lesion assigned to the “nodule” category by all four radiologists during the blinded reads but then by only three radiologists during the unblinded reads (the fourth radiologist assigned this lesion to the “non-nodule” category during the unblinded read). (d) A lesion assigned to the “nodule” category by a single radiologist during both blinded and unblinded reading phases (one of the other three radiologists assigned this lesion to the “micronodule” category during both blinded and unblinded reads, while the remaining two radiologists did not provide any marks during either reading phase). Each increment of the calibration scales corresponds to 1 mm.
DISCUSSION
Through a two-phase process of asynchronous reads, a convergence of interpretation is sought rather than a forced consensus. This general paradigm is consistent with the so-called Delphi procedure (18), which has been shown to improve the diagnostic accuracy of radiologists relative to individual assessment or interactive consultation (19), although its role in establishing “truth” has not been explored previously. The present study provides an assessment of such a paradigm for establishing “truth” in a CT-based lung-nodule-detection setting. “Truth” as reported in this study is not intended as a surrogate for pathological verification of nodule diagnosis; rather, the expert radiologists provided their opinion on the spatial location of structures that they would denote “nodule,” “mircronodule,” or “non-nodule.” For the purposes of the LIDC database, a “nodule” could be a primary lung cancer, metastatic disease, a non-cancerous process, or indeterminate in nature, and the nodule detection task would be considered independent of pathology.
The increase in the total number of marks between the blinded and unblinded reads is an expected consequence of the two-phase image annotation process that we established; the decrease in the number of categories across which those marks are distributed also is consistent with the intent of the LIDC process model. More marks were placed during the unblinded reads as radiologists were influenced by the findings of their colleagues, and a partial convergence of opinion regarding the categorical assignments of lesions was observed. The unblinded reads clearly increased agreement among radiologists for nodules from the blinded reads (the number of nodules on which all four radiologists agreed increased from 33.8% to 45.8% from the blinded reads to the unblinded reads), but substantial disagreement remained, even when radiologists were shown the marks of all other radiologists.
On 350 occasions across 264 distinct lesions, a radiologist did not mark a lesion during the blinded read that he or she later marked during the unblinded read. The extent to which these lesions represent search errors or decision-making errors, according to the categories of Kundel, et al. (20), cannot be known. The key question in the context of this study is: did the radiologist truly overlook the lesion during the blinded read and then later identify it with the benefit of marks made by the other radiologists, or did the radiologist identify the lesion during the blinded read, decide it did not fit into one of the LIDC-defined lesion categories, and then later change the interpretation during the unblinded read based on the marks of the other radiologists? Conversely, on 75 occasions across 75 distinct lesions, a radiologist removed a mark from a lesion during the unblinded read that he or she had marked during the blinded read (in effect revoking their blinded-read mark on the basis of the blinded-read marks (or lack of marks) of the other radiologists). In these instances, the radiologist’s thought process is more transparent: rather than deciding that a lesion he or she had previously marked during the blinded read was not a lesion at all, the radiologist most likely changed his or her interpretation of the lesion so that it no longer fit into one of the LIDC-defined categories. For example, a previously marked “micronodule” was determined during the unblinded read with the benefit of the marks (or lack of marks) of the other radiologists to be definitely benign (i.e., calcified), thereby excluding it from the “micronodule” category.
An interesting finding occurred in 29 lesions as a result of the asynchrony of the unblinded reads (i.e., the fact that radiologists did not communicate directly with each other during the reading process). For these lesions, a single radiologist had marked the lesion during the blinded read. Then, during the unblinded reads, the radiologist that had assigned the sole blinded-read mark observed that no other radiologist had marked the lesion during the blinded reads and decided to remove the mark; however, at least one of the other radiologists, now presented with the blinded-read mark of a colleague, decided to place a mark on the lesion (Figure 8). Human behavioral issues were unavoidable, with some radiologists demonstrating a greater tendency than others to modify their marks during the unblinded reads. We attempted to minimize this effect by using experienced, dedicated chest radiologists; in fact, the radiologists who participated in this study were the most senior thoracic radiologists at their respective institutions.
Figure 8.
A lesion that was assigned to the nodule category by a single radiologist during the blinded read (with no other marks placed by any other radiologist) and as a non-nodule by a different radiologist during the unblinded read (with no other marks placed by any other radiologist, including the radiologist who had marked the lesion during the blinded read).
The fact that only one additional lesion was identified during the unblinded reads reflects the intent of the two-phase image annotation process. The “blinded” and “unblinded” reading sessions are both part of the same process that attempts to identify, as completely as possible, all lung lesions in a scan that correspond to one of the three established categories. The intent of the unblinded read is not to identify lesions previously unmarked by any radiologist, but rather to give each radiologist a look at the marks placed by the other radiologists and thereby to improve the overall agreement among radiologists when establishing “truth.” The unblinded reading phase presented each radiologist with an inventory of the marks placed by all radiologists during the blinded reads; the task for each radiologist then was to assimilate the interpretations of all the radiologists into their own final interpretation.
The assignment of a lesion to a specific category in the context of the present study required three subjective steps: (1) identification of a lesion (Is the observed structure an abnormality or normal anatomy?), (2) determination of lesion size (Is the longest dimension of the lesion greater than or less than 3 mm? Does the longest diameter exceed 30 mm?), and (3) evaluation of lesion features (Does the lesion represent a “nodule”? If the lesion is less than 3 mm, is it clearly benign?). The multiple levels of inherently subjective interpretation required on the part of the radiologists help explain the finding that only 82 (17.7%) of the 463 lesions identified during the unblinded reading phase were (1) marked by all four radiologists and (2) assigned to the same lesion category by all four radiologists. Any possible combination of “nodule,” “micronodule,” “non-nodule,” and null category (i.e., no mark) assigned to the same lesion by different radiologists (or assigned by the same radiologist between their blinded and unblinded reads) could be considered reasonable (see Figure 7 for examples).
The subjective measurement step could be eliminated by considering the assigned nodule marks together with the assigned micronodule marks; however, the reduced percentage of complete agreement that results indicates that even if subjective size determination is eliminated, other factors exist. For example, variability in the assessment of lesion features may dominate for micronodules. Perhaps the very notion of “nodule” must be refined or somehow calibrated among radiologists. These considerations are the subject of continuing studies.
Several limitations are inherent in this study. First, the task of identifying nodules in the context of research differs from the identification task in the clinical setting, and the radiologists were asked to identify lesions based on three somewhat artificial categories without the benefit of accompanying clinical data. Second, the data collection process we employed did not allow for advanced statistical analyses, since each of the five radiologists reviewed a different subset of 24 of the 30 scans (radiologists did not review the six scans originated by their own institution). This process, however, was shaped by the practical consideration of radiologist time: the complete database is intended to comprise several hundred CT scans, and this study utilized the first 30 accrued scans. Fourth, pathologic information was not available for any of the lesions. Fifth, despite the benefit of maximum-intensity-projection images on the detectability of small lung nodules (9), CT images were not presented in this format; such a visualization technique, however, would be expected to impact variability during the blinded reading phase but not during the unblinded reading phase.
When a radiologist assigned a lesion to the “nodule” category, the radiologist constructed contours that encompassed the nodule in each CT section in which the nodule appeared. Differences in the contours constructed for nodules ≥ 3 mm were not evaluated in this study. Such differences and the resulting variance in nodule volume and nodule margin characteristics provide the basis for on-going LIDC investigations; Meyer et al. (21), for example, reported on the variance of nodule margins across six radiologists using three different software systems. When a radiologist assigned a lesion to the “nodule” category during the unblinded reading session, the radiologist provided a subjective assessment of nodule characteristics (nodule subtlety, internal structure, sphericity, margin, lobulation, spiculation, radiographic solidity, and likelihood of malignancy) through an electronic form. Differences in radiologists’ assessment of these characteristics were not evaluated in this study, but they provide the basis for on-going LIDC investigations.
This study was not founded on any preconceptions of “truth;” such a “gold standard” did not exist in this study and, in fact, is unattainable. The fundamental motivation for this study was to have experienced thoracic radiologists create the “truth”—an “expert observer truth” on which users of these scans (such as developers of CAD methods for automated lung nodule detection) ultimately will have to rely for development and validation purposes. The question that arises in the context of such CAD methods is: what should be considered meaningful detection targets? The targets on which an automated lung nodule detection method would be trained and against which the method ultimately would be evaluated could range from only those nodules marked as such by all four radiologists (n=27) to all nodules marked by at least one radiologist (n=59) (see Figure 7); in effect, the selection of targets would depend on the “probability” of a lesion being a nodule based on the number of radiologists marking it as a nodule, a notion preliminarily investigated by Kung et al. (22).
The implications of this study extend well beyond the quantification of radiologist variability in the identification of lung nodules on CT scans. The findings presented here challenge the certitude inherently associated with the expert-observer-defined truth that provides the basis for so many studies in the medical image analysis literature. For many tasks, radiologist interpretation is the closest approximation to “truth” that may be attained; the limitations of that approximation, however, must be recognized and appreciated by investigators.
The results of this study (similar to previous studies that investigated variability in the interpretation of chest radiographs and mammograms (23, 24)) could have important implications for the clinical interpretation of CT scans in the context of lung nodule detection in which a single reader is responsible for what is clearly a difficult detection task. The question must be raised as to assisting the single reader with a second (or multiple) human reader, or assisting the single reader through the computer-aided diagnosis paradigm. These discussions should be ongoing within the lung cancer imaging community.
Acknowledgments
Supported in part by USPHS Grants U01CA091085, U01CA091090, U01CA091099, U01CA091100, and U01CA091103.
Footnotes
Publisher's Disclaimer: This is a PDF file of an unedited manuscript that has been accepted for publication. As a service to our customers we are providing this early version of the manuscript. The manuscript will undergo copyediting, typesetting, and review of the resulting proof before it is published in its final citable form. Please note that during the production process errors may be discovered which could affect the content, and all legal disclaimers that apply to the journal pertain.
REFERENCES
- 1.Ko JP. Lung nodule detection and characterization with multi-slice CT. Journal of Thoracic Imaging. 2005;20:196–209. doi: 10.1097/01.rti.0000171625.92574.8d. [DOI] [PubMed] [Google Scholar]
- 2.Rubin GD. 3-D imaging with MDCT. European Journal of Radiology. 2003;45(Suppl 1):S37–S41. doi: 10.1016/s0720-048x(03)00035-4. [DOI] [PubMed] [Google Scholar]
- 3.Armato SG, III, McLennan G, McNitt-Gray MF, et al. Lung Image Database Consortium: Developing a resource for the medical imaging research community. Radiology. 2004;232:739–748. doi: 10.1148/radiol.2323032035. [DOI] [PubMed] [Google Scholar]
- 4.Clarke LP, Croft BY, Staab E, Baker H, Sullivan DC. National Cancer Institute initiative: Lung image database resource for imaging research. Academic Radiology. 2001;8:447–450. doi: 10.1016/S1076-6332(03)80555-X. [DOI] [PubMed] [Google Scholar]
- 5.Nishikawa RM, Yarusso LM. Variations in measured performance of CAD schemes due to database composition and scoring protocol. SPIE Proceedings. 1998;3338:840–844. [Google Scholar]
- 6.Department of Health and Human Services Standards for privacy of individually identifiable health information: final rules. Federal Register 2002. 2002;67:53182–53272. [PubMed] [Google Scholar]
- 7.Dodd LE, Wagner RF, Armato SG, III, et al. Assessment methodologies and statistical issues for computer-aided diagnosis of lung nodules in computed tomography: Contemporary research topics relevant to the Lung Image Database Consortium. Academic Radiology. 2004;11:462–475. doi: 10.1016/s1076-6332(03)00814-6. [DOI] [PubMed] [Google Scholar]
- 8.Naidich DP, Rusinek H, McGuinness G, et al. Variables affecting pulmonary nodule detection with computed tomography: Evaluation with three-dimensional computer simulation. Journal of Thoracic Imaging. 1993;8:291–299. doi: 10.1097/00005382-199323000-00005. [DOI] [PubMed] [Google Scholar]
- 9.Gruden JF, Ouanounou S, Tigges S, Norris SD, Klausner TS. Incremental benefit of maximum-intensity-projection images on observer detection of small pulmonary nodules revealed by multidetector CT. American Journal of Roentgenology. 2002;179:149–157. doi: 10.2214/ajr.179.1.1790149. [DOI] [PubMed] [Google Scholar]
- 10.Rogers SR, Brown MS, Goldin JG, et al. Automated lung nodule detection in CT: Nodule inclusion criteria for determining ground truth. Radiology. 2002;225(P):407. [Google Scholar]
- 11.Wormanns D, Ludwig K, Beyer F, Heindel W, Diederich S. Detection of pulmonary nodules at multirow-detector CT: Effectiveness of double reading to improve sensitivity at standard-dose and low-dose chest CT. European Radiology. 2005;15:14–22. doi: 10.1007/s00330-004-2527-6. [DOI] [PubMed] [Google Scholar]
- 12.Leader JK, Warfel TE, Fuhrman CR, et al. Pulmonary nodule detection with low-dose CT of the lung: Agreement among radiologists. American Journal of Roentgenology. 2005;185:973–978. doi: 10.2214/AJR.04.1225. [DOI] [PubMed] [Google Scholar]
- 13.Novak CL, Qian J, Fan L, et al. Inter-observer variations on interpretation of multi-slice CT lung cancer screening studies, and the implications for computer-aided diagnosis. SPIE Proceedings. 2002;4684:68–79. [Google Scholar]
- 14.Wormanns D, Beyer F, Diederich S, Ludwig K, Heindel W. Diagnostic performance of a commercially available computer-aided diagnosis system for automatic detection of pulmonary nodules: Comparison with single and double reading. Rofo: Fortschritte auf dem Gebiete der Rontgenstrahlen und der Nuklearmedizin. 2004;176:953–958. doi: 10.1055/s-2004-813251. [DOI] [PubMed] [Google Scholar]
- 15.Marten K, Seyfarth T, Auer F, et al. Computer-assisted detection of pulmonary nodules: Performance evaluation of an expert knowledge-based detection system in consensus reading with experienced and inexperienced chest radiologists. European Radiology. 2004;14:1930–1938. doi: 10.1007/s00330-004-2389-y. [DOI] [PubMed] [Google Scholar]
- 16.Revesz G, Kundel HL, Bonitatibus M. The effect of verification on the assessment of imaging techniques. Investigative Radiology. 1983;18:194–198. doi: 10.1097/00004424-198303000-00018. [DOI] [PubMed] [Google Scholar]
- 17.Austin JHM, Mueller NL, Friedman PJ, et al. Glossary of terms for CT of the lungs: Recommendations of the Nomenclature Committee of the Fleischner Society. Radiology. 1996;200:327–331. doi: 10.1148/radiology.200.2.8685321. [DOI] [PubMed] [Google Scholar]
- 18.Cascade PN. The American College of Radiology. ACR Appropriateness Criteria project. Radiology. 2000;214(Suppl):3–46. doi: 10.1148/radiology.214.1.r00ja493. [DOI] [PubMed] [Google Scholar]
- 19.Hillman BJ, Hessel SJ, Swensson RG, Herman PG. Improving diagnostic accuracy: A comparison of interactive and Delphi consultation. Investigative Radiology. 1977;12:112–115. doi: 10.1097/00004424-197703000-00002. [DOI] [PubMed] [Google Scholar]
- 20.Kundel HL, Nodine CF, Carmody D. Visual scanning, pattern recognition and decision-making in pulmonary nodule detection. Investigative Radiology. 1978;13:175–181. doi: 10.1097/00004424-197805000-00001. [DOI] [PubMed] [Google Scholar]
- 21.Meyer CR, Johnson TD, McLennan G, et al. Evaluation of lung MDCT nodule annotations across radiologists and methods. Academic Radiology. 2006;13:1254–1265. doi: 10.1016/j.acra.2006.07.012. [DOI] [PMC free article] [PubMed] [Google Scholar]
- 22.Kung JW, Matsumoto S, Hasegawa I, et al. Mixture distribution analysis of a computer assisted diagnosic method for the evaluation of pulmonary nodules on computed tomography scan. Academic Radiology. 2004;11:281–285. doi: 10.1016/s1076-6332(03)00717-7. [DOI] [PubMed] [Google Scholar]
- 23.Potchen EJ, Cooper TG, Sierra AE, et al. Measuring performance in chest radiography. Radiology. 2000;217:456–459. doi: 10.1148/radiology.217.2.r00nv14456. [DOI] [PubMed] [Google Scholar]
- 24.Beam CA, Layde PM, Sullivan DC. Variability in the interpretation of screening mammograms by U.S. radiologists. Archives of Internal Medicine. 1996;156:209–213. [PubMed] [Google Scholar]