

Abstract
Surface hybridization reactions, in which sequence-specific recognition occurs between immobilized and solution nucleic acids, are routinely carried out to quantify and interpret genomic information. Although hybridization is fairly well understood in bulk solution, the greater complexity of an interfacial environment presents new challenges to a fundamental understanding, and hence application, of these assays. At a surface, molecular interactions are amplified by the two-dimensional nature of the immobilized layer, which focuses the nucleic acid charge and concentration to levels not encountered in solution, and which impacts the hybridization behavior in unique ways. This study finds that, at low ionic strengths, an electrostatic balance between the concentration of immobilized oligonucleotide charge and solution ionic strength governs the onset of hybridization. As ionic strength increases, the importance of electrostatics diminishes and the hybridization behavior becomes more complex. Suppression of hybridization affinity constants relative to solution values, and their weakened dependence on the concentration of DNA counterions, indicate that the immobilized strands form complexes that compete with hybridization to analyte strands. Moreover, an unusual regime is observed in which the surface coverage of immobilized oligonucleotides does not significantly influence the hybridization behavior, despite physical closeness and hence compulsory interactions between sites. These results are interpreted and summarized in a diagram of hybridization regimes that maps specific behaviors to experimental ranges of ionic strength and probe coverage.
Keywords: biosensor, ferrocene, ionic strength, microarray, probe coverage
Solid-phase or “surface” hybridization is the foundation of modern microarray and biosensing technologies widely used in applied genomics for genotyping, drug discovery, gene expression profiling, and related applications based on measurement of genomic information (1, 2). These tools function through detection of interactions between nucleic acids immobilized on a solid support, or “probes,” with analyte “target” nucleic acids present in solution. Binding, or hybridization, between probes and targets to form an immobilized duplex takes place based on the degree of complementarity between the probe and target base sequences. The tremendous growth in applications of surface hybridization has been mirrorred by increased emphasis on experimental and fundamental aspects of the assays that directly impact measurement and interpretation of data (3, 4).
As summarized in several recent reviews (5–8), physical studies under simplified experimental conditions have begun to unravel the rich phenomenology that occurs in diagnostic assays. Applications typically operate away from equilibrium and are faced with a highly diverse pool of target sequences competing for the probe sites. A variety of aids to enhance hybridization performance is used, including surfactants and blocking agents to control nonspecific adsorption, washing procedures to develop contrast between fully and partially complementary sequences, and variation of assay parameters such as ionic strength or temperature. Physical studies (9–27) aim to distill down this complexity into scenarios where specific features of surface hybridization are brought out; for example, the impact of probe surface coverage on target hybridization (17, 20, 22, 23, 28).
A key ingredient in translating fundamental insight to applications lies in understanding how experimental conditions engender specific hybridization behaviors. One relationship of interest is the cooperative influence of ionic strength (CB) and probe coverage (SP). These parameters are linked through their electrostatic nature: ionic strength governs the magnitude of electrostatic interactions, whereas probe coverage determines the surface density of immobilized charge, from the probe phosphate groups, that a hybridizing target must overcome. In this study, these two parameters are found to dominate hybridization at low conversions, near the hybridization onset. Under conditions more typical of applications, when conversion is higher, additional interactions become significant. Here, suppressed affinity for targets and a lowered sensitivity of probe-target hybridization to salt conditions indicate presence of probe-probe associations. Moreover, a curious regime is encountered in which probes are physically close enough to interact yet, contrary to intuition, changes in their separation exert only weak effects on target hybridization. These regimes define a map of hybridization behaviors as a function of experimental conditions, and are discussed in the context of molecular level mechanisms.
Results
General Features of Hybridization in CB–SP Space.
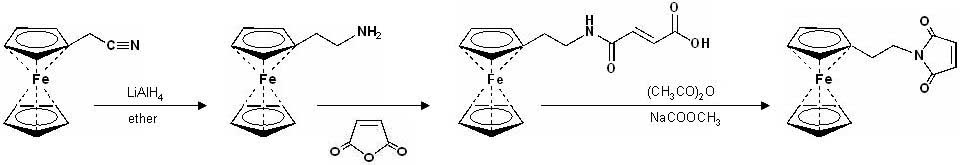
Experiments were carried out using monolayers of 20mer single-stranded oligodeoxyribonucleotide probes immobilized to gold supports. A “brush” type geometry, whereby the probes are tethered at one end and dangle into solution at the other, was created by using mercaptopropanol (MCP) as a surface passivant to decrease nonspecific interactions between the DNA and the surface (21, 28). The probe sequence used was the retinoblastoma RB1 marker 5′ TTT TAA ATT CTG CAA GTG AT-(CH2)3-S-S-(CH2)3-OH 3′, with the 3′ disulfide providing the surface immobilization.
Hybridization experiments were carried out across a grid of experimental conditions that spanned probe coverages between 2 × 10¹² and 1.6 × 10¹³ strands per cm2, and sodium phosphate buffer concentrations between 0.012 and 1 M in phosphate groups, at pH 7.0. This parameter space was selected to cover conditions typically encountered in applications (5, 7). Each probe layer of a given coverage SP (probes per area) underwent a series of hybridizations at different buffer strengths CB (mol phosphate per liter) to 100 nM complementary target sequence 5′ ATC ACT TGC AGA ATT TAA-F2 3′, where F2 signifies an electroactive N-(2-ferrocene-ethyl) maleimide moiety (29). The target was complementary to the first 18 bases at the 3′ end of the probe. Target coverage ST was determined from the total charge Q needed to switch the F2 tags of bound targets between ferrocene and ferricinium states, F2 − e− ↔ F2+. Hybridization was performed while stirring until ST reached a stationary value. Fig. 1 shows representative cyclic voltammetry (CV) data as a function of time for SP = 5.7 × 1012 cm−2 and CB = 1 M. After subtraction of the background at t = 0, the peak areas for cathodic and anodic scans were integrated to give Q and the average was converted to ST using ST = Q/(eA), where 1e is the charge per tag (target) and A is the electrode area. The symmetric shape of the peaks, near equivalence of F2 oxidation and reduction potentials, and linear scaling of peak current with scan rate (not shown) confirmed that the signals originated from hybridized targets, not diffusing species in solution.
Fig. 1.

CV time series showing progress of hybridization to complementary target at 5 min intervals from 0 to 40 min. (Right Inset) Target coverage as a function of time. (Left Inset) Initial (t = 0) and final (t = 40 min) CV traces for a noncomplementary 5′-TTT TTT TCC TTC CTT TTT-F2–3′ ferrocene-labeled target. Probe coverage, 5.7 × 1012 cm−2; buffer strength, 1 M; target concentration, 100 nM.
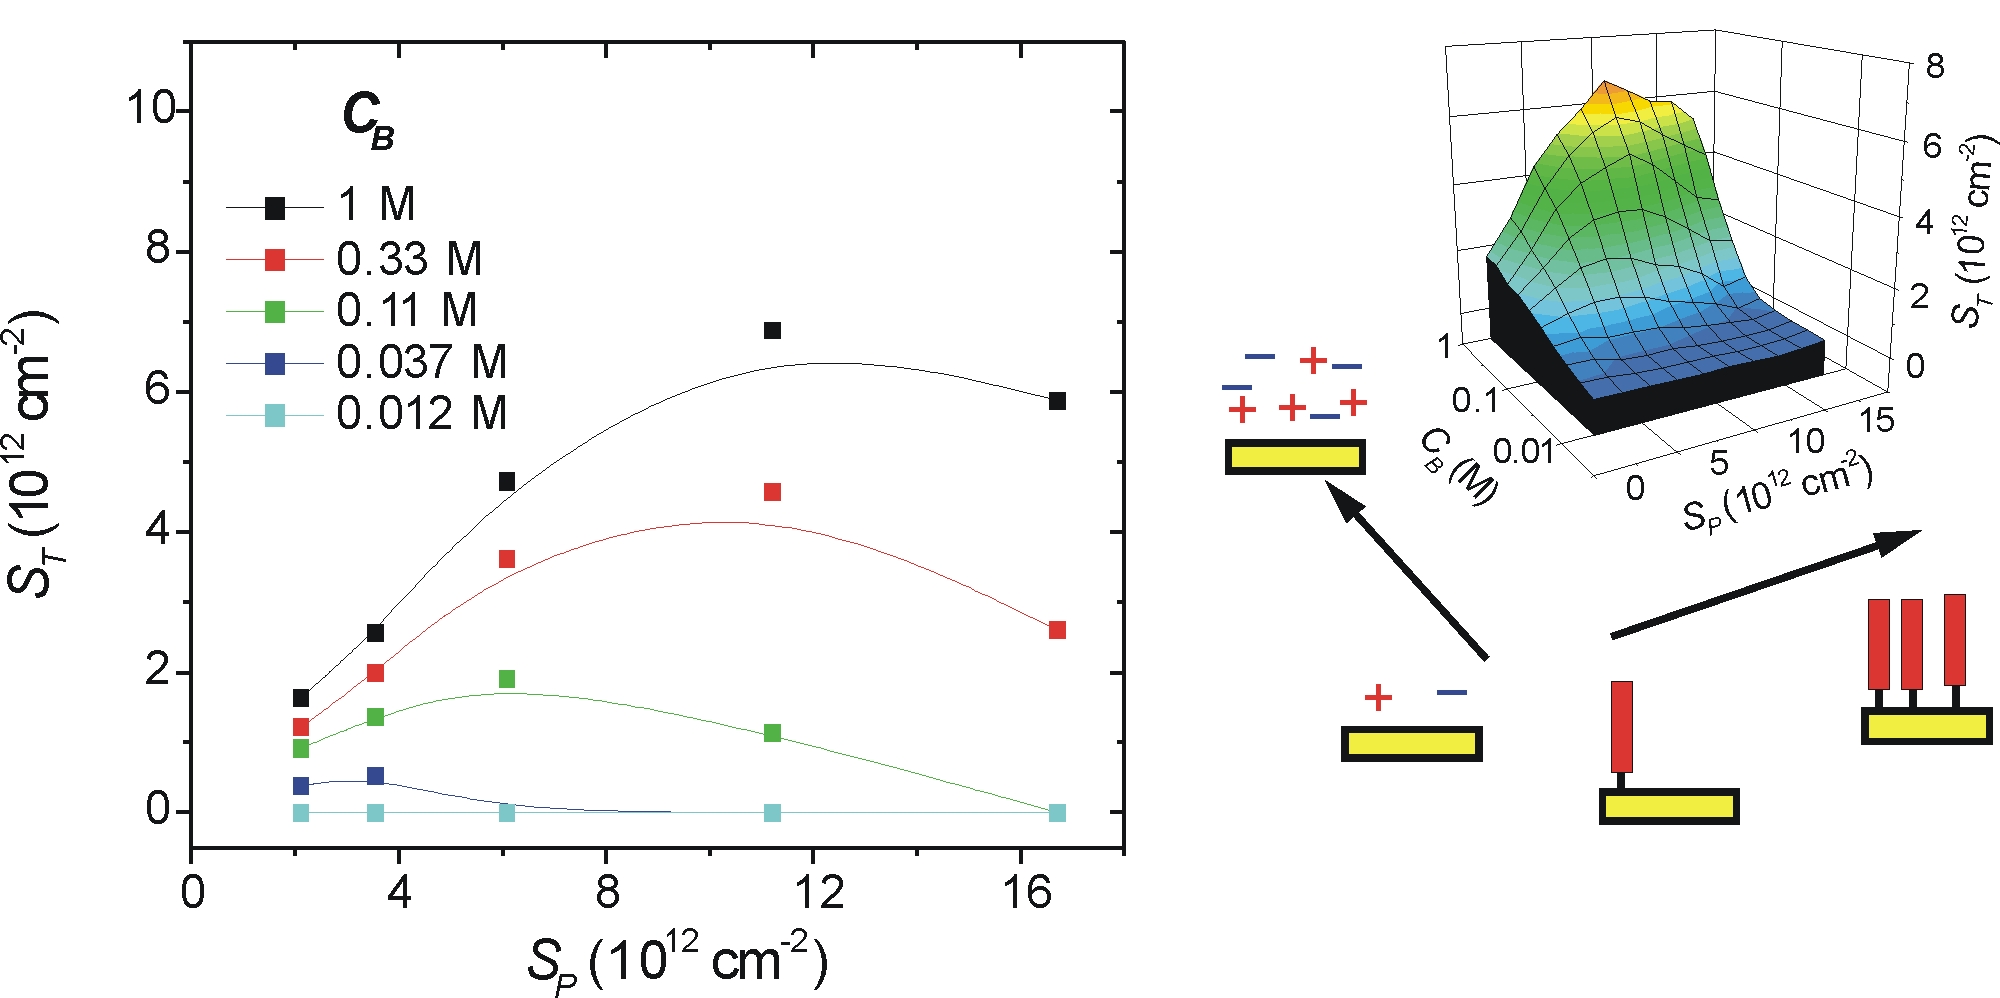
Fig. 2 presents line and surface plots of the final coverage of hybridized target molecules, ST, as a function of ionic strength CB and probe coverage SP. For the lowest ionic strength, CB = 0.012 M, hybridization was undetectable over the entire investigated range of 2 × 10¹² < SP < 1.6 × 10¹³ strands per cm2. Regardless of probe coverage, ST increased monotonically with CB, a trend that results from screening of electrostatic penalties to hybridization at higher ionic strengths. If SP was increased while CB was fixed, a maximum in ST was observed at an intermediate probe density SPST, consistent with prior measurements at high ionic strengths (17, 20, 22, 23). The initial rise in target coverage with SP reflects an increasing capacity of the surface to bind target, whereas the subsequent decrease is attributed to overwhelming steric and electrostatic repulsions presented to targets by crowded, dense probe films. SPST is seen to shift to higher coverages as CB increases. This dependence reflects compensating effects between probe coverage and ionic strength whereby stronger electrostatic screening (higher CB) is effective in reducing electrostatic hybridization penalties to higher probe coverages.
Fig. 2.

Target coverage ST (targets per cm2) as a function of probe coverage SP (probes per cm2) and ionic strength CB (moles of phosphate per liter). (Left) Scatter plot of measured data. Lines are guides for the eye. (Right) An interpolated surface plot representation.
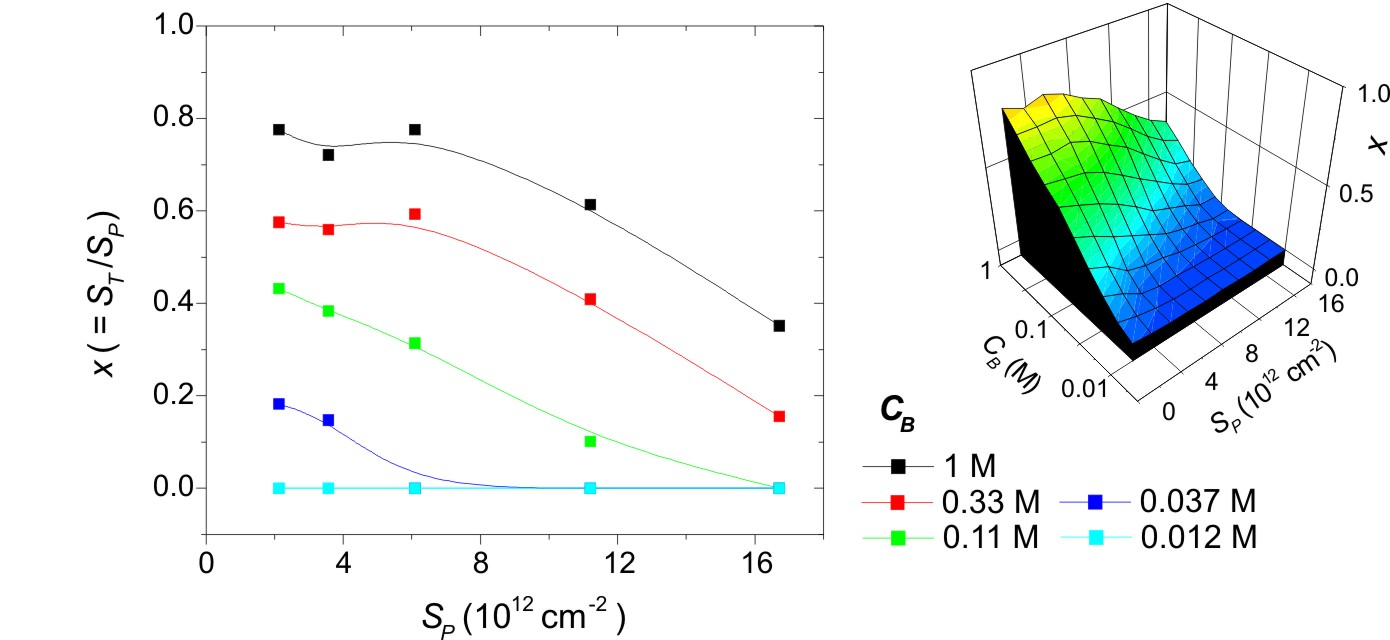
An alternative way to visualize these data is as the fraction of probes that hybridized, represented by the hybridization conversion x = ST/SP. When ionic strength was high, 0.33 M and 1 M data series, Fig. 3 shows that x was approximately independent of probe coverage at low values of SP. At higher probe coverages, x decreased. Implications of this behavior will be considered below. At lower ionic strengths, CB = 0.11 M and 0.037 M, x exhibited a monotonic decrease as SP increased within the accessible experimental window; whether a plateau existed at very low probe coverages could not be ascertained due to difficulties with quantification of SP below ≈1 × 1012 cm−2. As a practical note, the strongest hybridization signal was realized at SPST when ST was at a maximum but where x was already in decline.
Fig. 3.

Hybridization conversion x = ST/SP as a function of probe coverage SP (probes per cm2) and ionic strength CB (moles of phosphate per liter). (Left) Scatter plot. (Right) An interpolated surface plot representation.
Hybridization at Low Conversion: Electrostatics and the Onset of Hybridization.
What are the requirements for surface hybridization to proceed to some small value of x? From a purely electrostatic perspective, hybridization should cease at low ionic strengths when solution ions do not provide sufficient charge screening between the layer of immobilized probes and targets in solution. Because the charge density of the probe layer is concentrated if SP increases, high probe coverages are expected to exacerbate the electrostatic barrier to hybridization. Can a criterion be formulated that integrates these expectations into a testable condition for onset of surface hybridization?
The immobilized negative DNA charge must retain an elevated countercharge CC,S of cations at the surface, CC,S > CC,B, where CC,B is the buffer concentration of cations. When a target binds, to maintain electroneutrality of the near surface region additional cations must transfer from solution to compensate the newly added target charge. Because CC,S > CC,B this transfer will occur uphill, against the cation concentration gradient. In the limit of a very dilute buffer this gradient is large, because then CC,B ≪ CP ≈ CC,S, where CP is the concentration of immobilized probe charge. In this dilute limit the resultant osmotic penalty to hybridization will therefore be large and probe-target binding will be suppressed. In the other extreme, when CC,B ≫ CP, the cation concentration in the probe layer CC,S will be comparable to that in solution, CC,S ≈ CC,B, and the penalty will be small. Onset of hybridization is expected between these two extremes, when CC,B exceeds CP. This stipulation is conveniently expressed by defining Π  CP/CC,B, with the crossover between hybridizing and nonhybridizing conditions expected around Π ≈ 1. For pH 7 sodium phosphate buffer, CC,B equals CNa+,B = 1.61CB, where CB is the buffer phosphate concentration. Thus, onset of hybridization is expected for
The arguments leading to expression 1 are similar to those invoked in theoretical analyses of polyelectrolyte brushes (30, 31). A quantity related to Π also arises in the hybridization theory of Halperin, Buhot and Zhulina (HBZ) (32), where it delineates between different predictions for hybridization isotherms. The HBZ parameter is ΠHBZ = rD2/HΛ where rD is the Debye screening length in solution, H is the thickness of the probe layer, and Λ ∼1/σ is the Gouy–Chapman length which acts as a metric of the immobilized areal density of charge σ. ΠHBZ is readily shown to be proportional to Π by recognizing that rD2 ∼1/CB and that 1/HΛ ∼ CP.
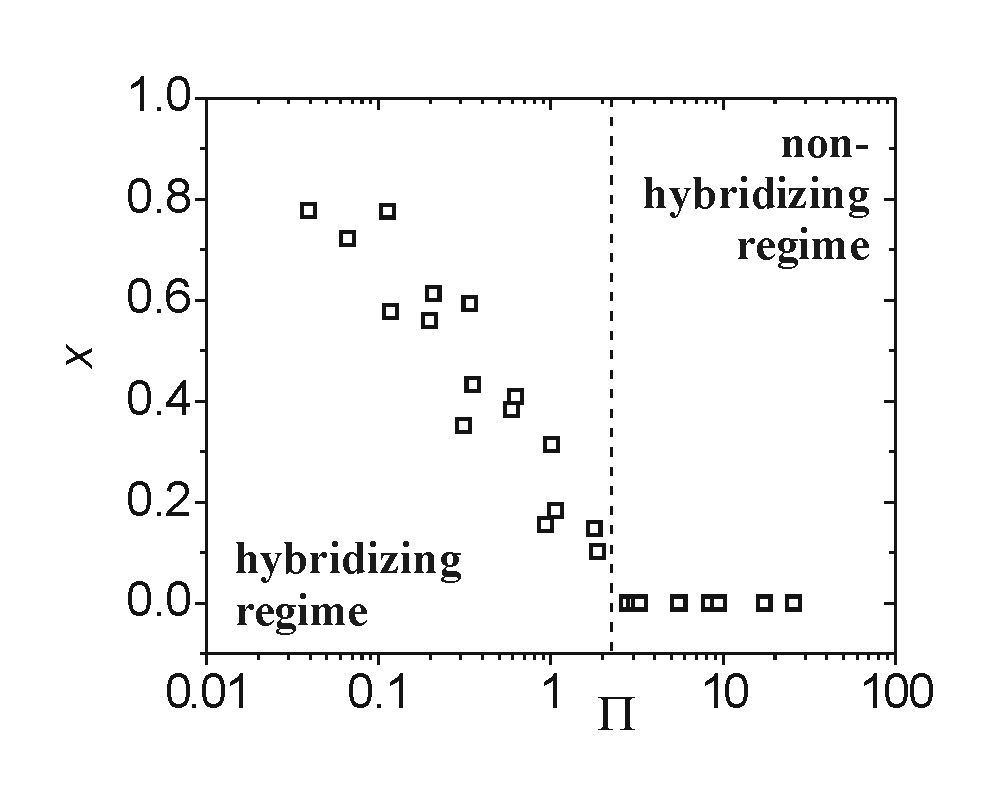
The hypothesis that the onset transition should occur around Π ≈ 1 is tested in Fig. 4, where x data are plotted against Π calculated as described in the figure legend. The most striking feature is the changeover from hybridizing to nonhybridizing conditions at Π = 2.2, consistent with the above estimate of Π ≈ 1.§ Substitution of Na+ by K+ counterions produced a trend similar to that in Fig. 4 [supporting information (SI)]. Although these results confirm that hybridization onset was governed by a cooperative interplay of probe coverage and ionic strength, as reflected in the ratio CP/CB, the lack of collapse to a single curve deeper in the hybridizing regime indicates that, at higher conversions, additional influences are affecting x. This more complex behavior is considered below.
Fig. 4.

Correlation of the extent of hybridization x with the dimensionless group Π. Onset of hybridization was observed at Π = 2.2. Π was calculated using Eq. 1 and CP = SPNP/HNA, where SP is the experimentally determined probe coverage, NP = 20 is the number of phosphate charges per probe, NA is Avogadro's number, and H is thickness of the probe layer. H was approximated by the probe contour length, H = 10 nm, based on polyelectrolyte brush theory, which predicts the probes to be highly stretched at the hybridization cross-over due to the still significant osmotic pressure of small ions (31).
Hybridization at High Conversion.
Assay applications tend to operate deeply in the hybridizing regime of Fig. 4, under conditions of high ionic strength and well away from the onset of hybridization. High ionic strength favors large values of x (i.e., x → 1), thus increasing the diagnostic signal. The equilibrium behavior of x can be represented by an isotherm, a function that relates the extent of hybridization to target concentration and, in principle, to other parameters defining the equilibrium state including probe coverage and ionic strength. The most common model that has been applied to surface hybridization is the Langmuir isotherm (18, 26, 27, 33, 34)
CT is the concentration of targets in solution. The equilibrium constant K is given by exp(−ΔGSo/kT) where ΔGSo, the standard free energy of surface hybridization, is defined for a reaction in which a target T binds to an immobilized probe P to yield the immobilized duplex D: Tsolution + Psurface ↔ Dsurface. T is the absolute temperature, and k is the Boltzmann constant. In the Langmuir model, probe sites are assumed to be noninteracting and equivalent in their binding affinity toward target species. This scenario, in which probes do not interact, can only be strictly valid if probes are spaced far apart so that physical contact is impossible and noncontact electrostatic interactions are attenuated to insignificant levels, i.e., below the thermal energy kT. For such a “Langmuir scenario” K is independent of the probe coverage SP and, from Eq. 2, so is x.
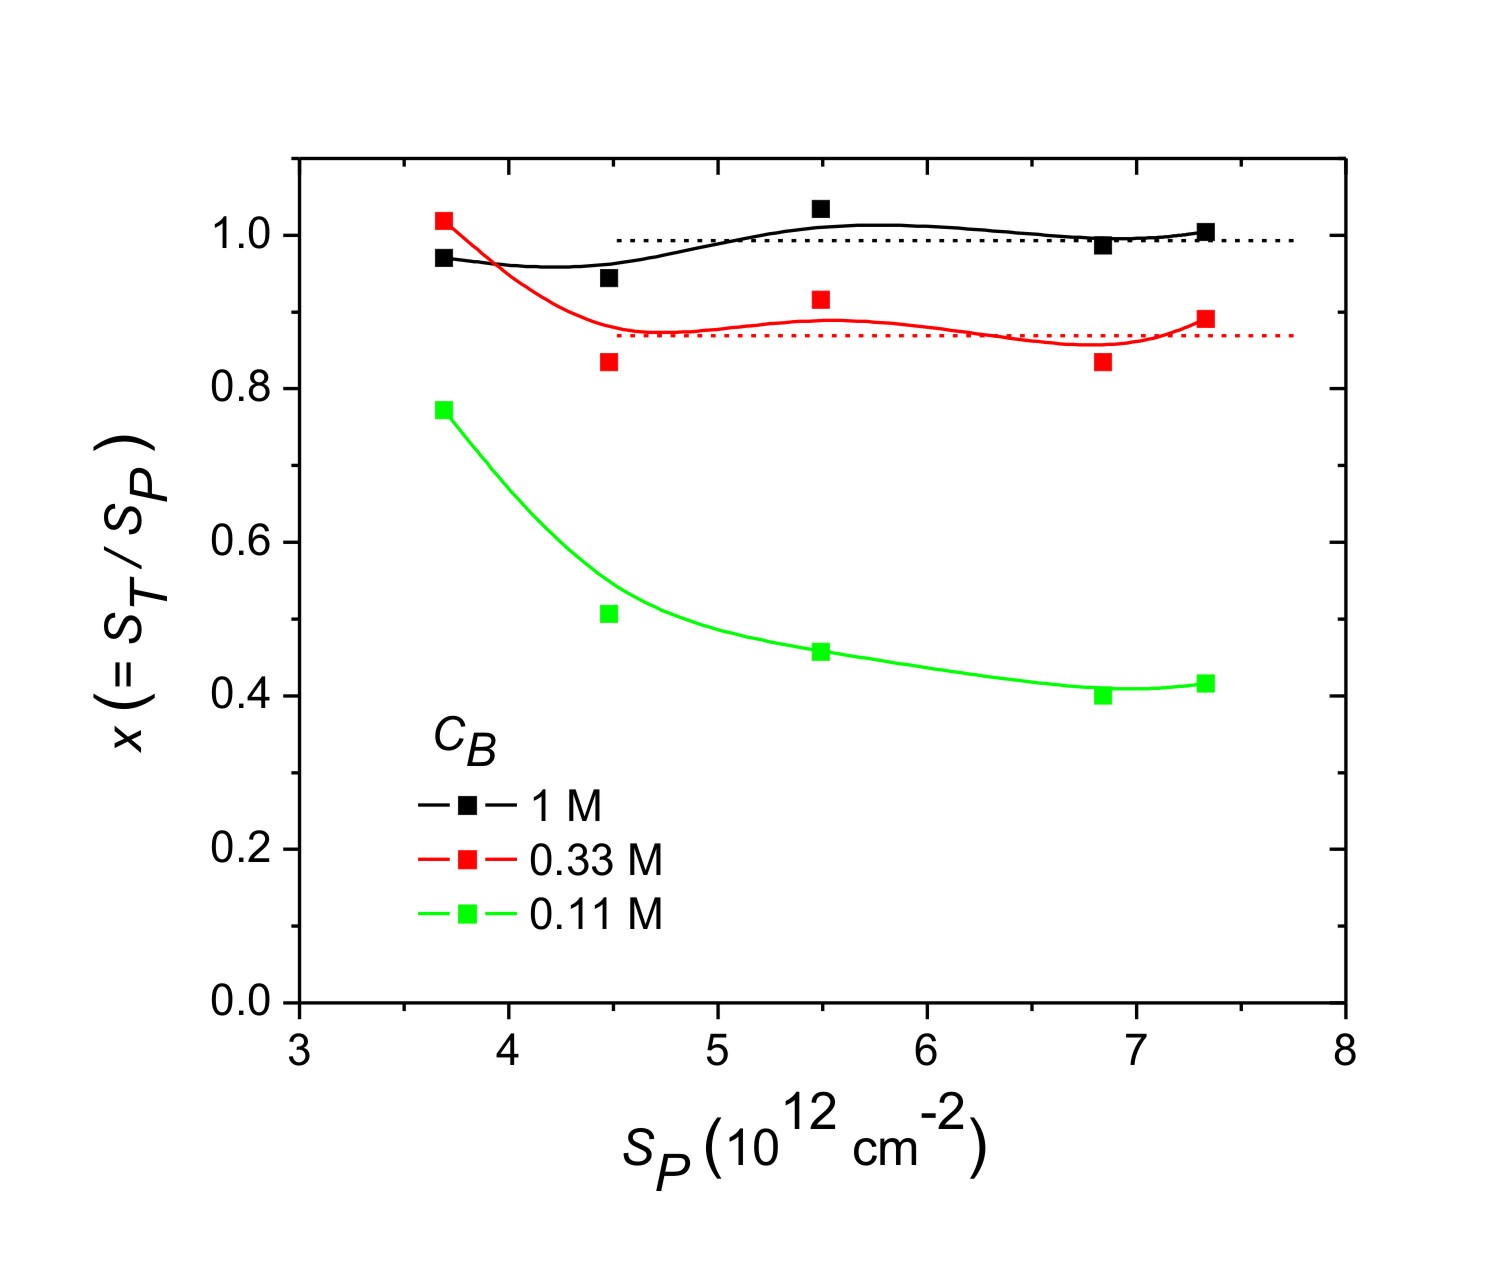
From the experimental dependence of x on SP (Fig. 3) two regimes can be discerned: (1) a “suppressed hybridization” (SH) regime where x decreases with SP, and a “pseudo-Langmuir” (PL) regime that occurs at lower probe coverages and within which x achieves an approximately constant, plateau value. The PL regime is only resolved for the 1 M and 0.33 M traces. The reason for the “pseudo” nomenclature will become evident below. The SH regime clearly violates the Langmuir model, because the required constancy of x with SP does not hold. The PL regime, on the other hand, is consistent with Langmuir behavior in that x does not vary, at least not strongly, with probe coverage. These trends were reproduced in a second set of experiments using potassium instead of sodium as the counterion (SI). Attempts to fit theoretical hybridization isotherms incorporating repulsive site interactions (7, 32, 35, 36) to the data were able to approximately account for the SH regime but not for the ionic strength-dependent PL plateau.
The average distance between probe sites in the experiments was at most 7.5 nm (SP > 1.7 × 1012 cm−2), and was thus always comfortably spanned by 20mer probes with a contour length of 10 nm. At these coverages, it appears impossible for the probes to not interact. The suppression of hybridization as SP increases in the SH regime is consistent with presence of site-site interactions, but the invariance of x with probe coverage in the PL regime is not. Although the plateau for the 1 M series for which x is close to unity could simply reflect saturation of the surface capacity to bind target, such an explanation is untenable for the 0.33 M series for which the data are clearly below saturation, and yet a plateau was observed.
Valuable insight into the PL regime can be obtained by considering the salt dependence of the x plateau. In solution, the equilibrium constant K depends on salt concentration (37) because hybridization involves a change in the number of counterions that are strongly associated (“condensed,” refs. 38 and 39) with the polyelectrolyte DNA backbone. Formally, counterion condensation can be included in the hybridization reaction as T + P + J C ↔ D, where a number J of cations C, initially free in solution, associate to the duplex D to screen its increased linear charge density. The role of the cations manifests through dependence of K on their concentration CC,B as K = K1M CC,BJ, where K1M is the value of K when CC,B = 1 M. Treating the K for surface hybridization similarly rearranges Eq. 2 to
The measured plateau values of x for CB = 1 M (x ≈ 0.88) and 0.33 M (x ≈ 0.68) are fit by Eq. 3 when K1M = 4.2 × 10⁷ and J = 1.1. The K1M value of 4.2 × 10⁷ falls between those reported previously for surface hybridization of 18mer targets (of different sequences) under 1 M Na+ strength; e.g., K1M = 3 × 10⁷ reported by Georgiadis and coworkers (18) and K1M = 6.8 × 10⁷ reported by the Corn group (26), after correcting for differences in ionic strength using J = 1.1 from above. Interestingly, irrespective of sequence the surface K1M values are similar in these studies and orders of magnitude smaller than those for solution hybridization under same conditions (5). For the particular sequence of this study, the surface K1M of 4.2 × 10⁷ is nine orders of magnitude below the solution value of 8 × 10¹⁶ at 25°C (37). A second significant result is that J = 1.1 is much smaller than J = 3.1 estimated from known salt dependence of solution hybridization for 18mer oligonucleotides (37).
The PL regime can thus be summarized by three primary observations. First, x is approximately independent of probe coverage, consistent with Langmuir behavior. Second, the K1M value is greatly lowered relative to solution, indicating decreased affinity of target hybridization. Third, the apparent number of counterions condensed when target hybridizes is reduced. What molecular level mechanisms can account for these observations? The first observation, constancy of x, indicates that duplex formation at a probe site is not affected by the spacing between sites. Given that sites are in sufficient proximity to interact, this is possible only if a mechanism exists that regulates interactions of a hybridized (duplex) site with its surroundings so as to maintain them approximately independent of site-site spacing. Such a mechanism presumably involves structural relaxation. For example, interactions between duplexes could be moderated by adoption of a more perpendicular helix orientation to the surface as duplex coverage increases. Transition to the SH regime would then signal exhaustion of the available relaxation mode; for example, once the helices have realized a maximal degree of alignment. Thereafter, at yet higher probe coverages, the fraction x of probes undergoing hybridization would thus be increasingly suppressed.
Significantly, the proximity of surface sites also enables unhybridized probes to interact and, if preferred, to exist in an associated state formed through attractive base stacking and hydrogen bonding interactions (40). Probe associations would be most favored at high ionic strengths when electrostatic repulsions between probes are weak. Existence of probe complexes has been postulated earlier by Forman et al. (24) as a possible cause of suppressed hybridization on commercial DNA chips under high (1 M) salt conditions. The lowering of K1M and J, relative to solution hybridization, is consistent with this interpretation. Probe association would decrease K1M because preexisting probe complexes would have to be disrupted during hybridization of target, thus making hybridization less favorable. Moreover, the backbone charge density of a probe complex should be higher than that of unassociated probes, with more counterions condensed before target hybridization. Then the additional condensation from subsequent target binding would be lowered, reducing J as indeed observed experimentally. Interestingly, insertion of a 1.1 nm poly(ethylene glycol) (PEG) linker between the solid support and the probe, keeping other conditions fixed, raised K1M eightfold to 3.5 × 10⁸ and J to, approximately, 2.7 (SI). These changes suggest that probe associations can be destabilized by PEG spacers.
While evidence for probe association came from analyzing the PL regime, these interactions are expected whenever conditions are favorable, including in the SH regime. Finally, it is worth noting that probe association can also explain suppression of surface K values relative to those in solution found in other physical studies of solid phase hybridization (5, 18, 26, 27).
A Map of Hybridization Regimes.
The experimental results can be summarized in the form of a hybridization map, illustrated in Fig. 5. A non-hybridizing (NH) regime was observed at high probe coverages and low ionic strengths. In the NH regime, the target coverage ST was below the detection limit of 2 × 1011 cm−2. All points in 0.012 M buffer, and some points measured under 0.037 M and 0.11 M conditions, belonged to the NH regime. The NH to SH transition, corresponding to the onset of hybridization, was defined by the condition that concentration of solution salt, CB, be comparable to the concentration of immobilized probe charge, CP. This condition is expected to apply as long as electrostatics dominate the NH to SH transition. If, however, probe coverage approaches the sterically-limited maximum of about 5 × 1013 cm−2, hybridization will become impossible. This physical constraint is indicated as an upturn in the NH to SH transition. In the SH regime x depended on the coverage of probe sites, a clear signature of non-Langmuirian behavior indicating that steric and/or electrostatic interactions between sites were influencing hybridization. From the SH regime, a decrease in coverage at higher ionic strengths led to the PL regime. The defining characteristic of the PL regime was near independence of x on the coverage of probe sites, despite closeness of the sites and thus compulsory presence of site-site interactions. It was argued that this independence requires that the pliable nature of the DNA layer moderate site-site interactions through a structural reorganization (e.g., through a reorientation of helices). With further decrease in probe coverage eventually a true “Langmuir” (L) regime must exist where probes are so far apart that they do not interact. Although this putative regime was not accessible to the experiments it is included in Fig. 5 as an expected limiting condition. The gray area between the L and PL regimes may consist of additional regimes, depending on which interactions between sites dominate. These interactions can comprise probe association as well as interactions involving both hybridized and unhybridized sites. This region also was not studied due to inability to quantify probe coverage at these low values.
Fig. 5.

A map of surface hybridization regimes in CB–SP space. L, Langmuir regime; PL, pseudo-Langmuir regime; SH, suppressed hybridization regime; NH, non-hybridizing regime. Points represent conditions sampled in this study. Dotted curves separate distinct regimes, with solid portions taken from experimental data.
Fig. 5 suggests directions for future inquiry. Most immediately it would be intriguing to extend measurements to lower probe coverages, down to the L regime, to characterize the onset of site-site interactions and to fill in the largely unexplored area to the left of the SH and PL regimes. As probe and target lengths vary in applications, experimental studies over ranges in strand lengths and polydispersities are also urgent and would provide valuable test of theoretical predictions (41).
Materials and Methods
Materials.
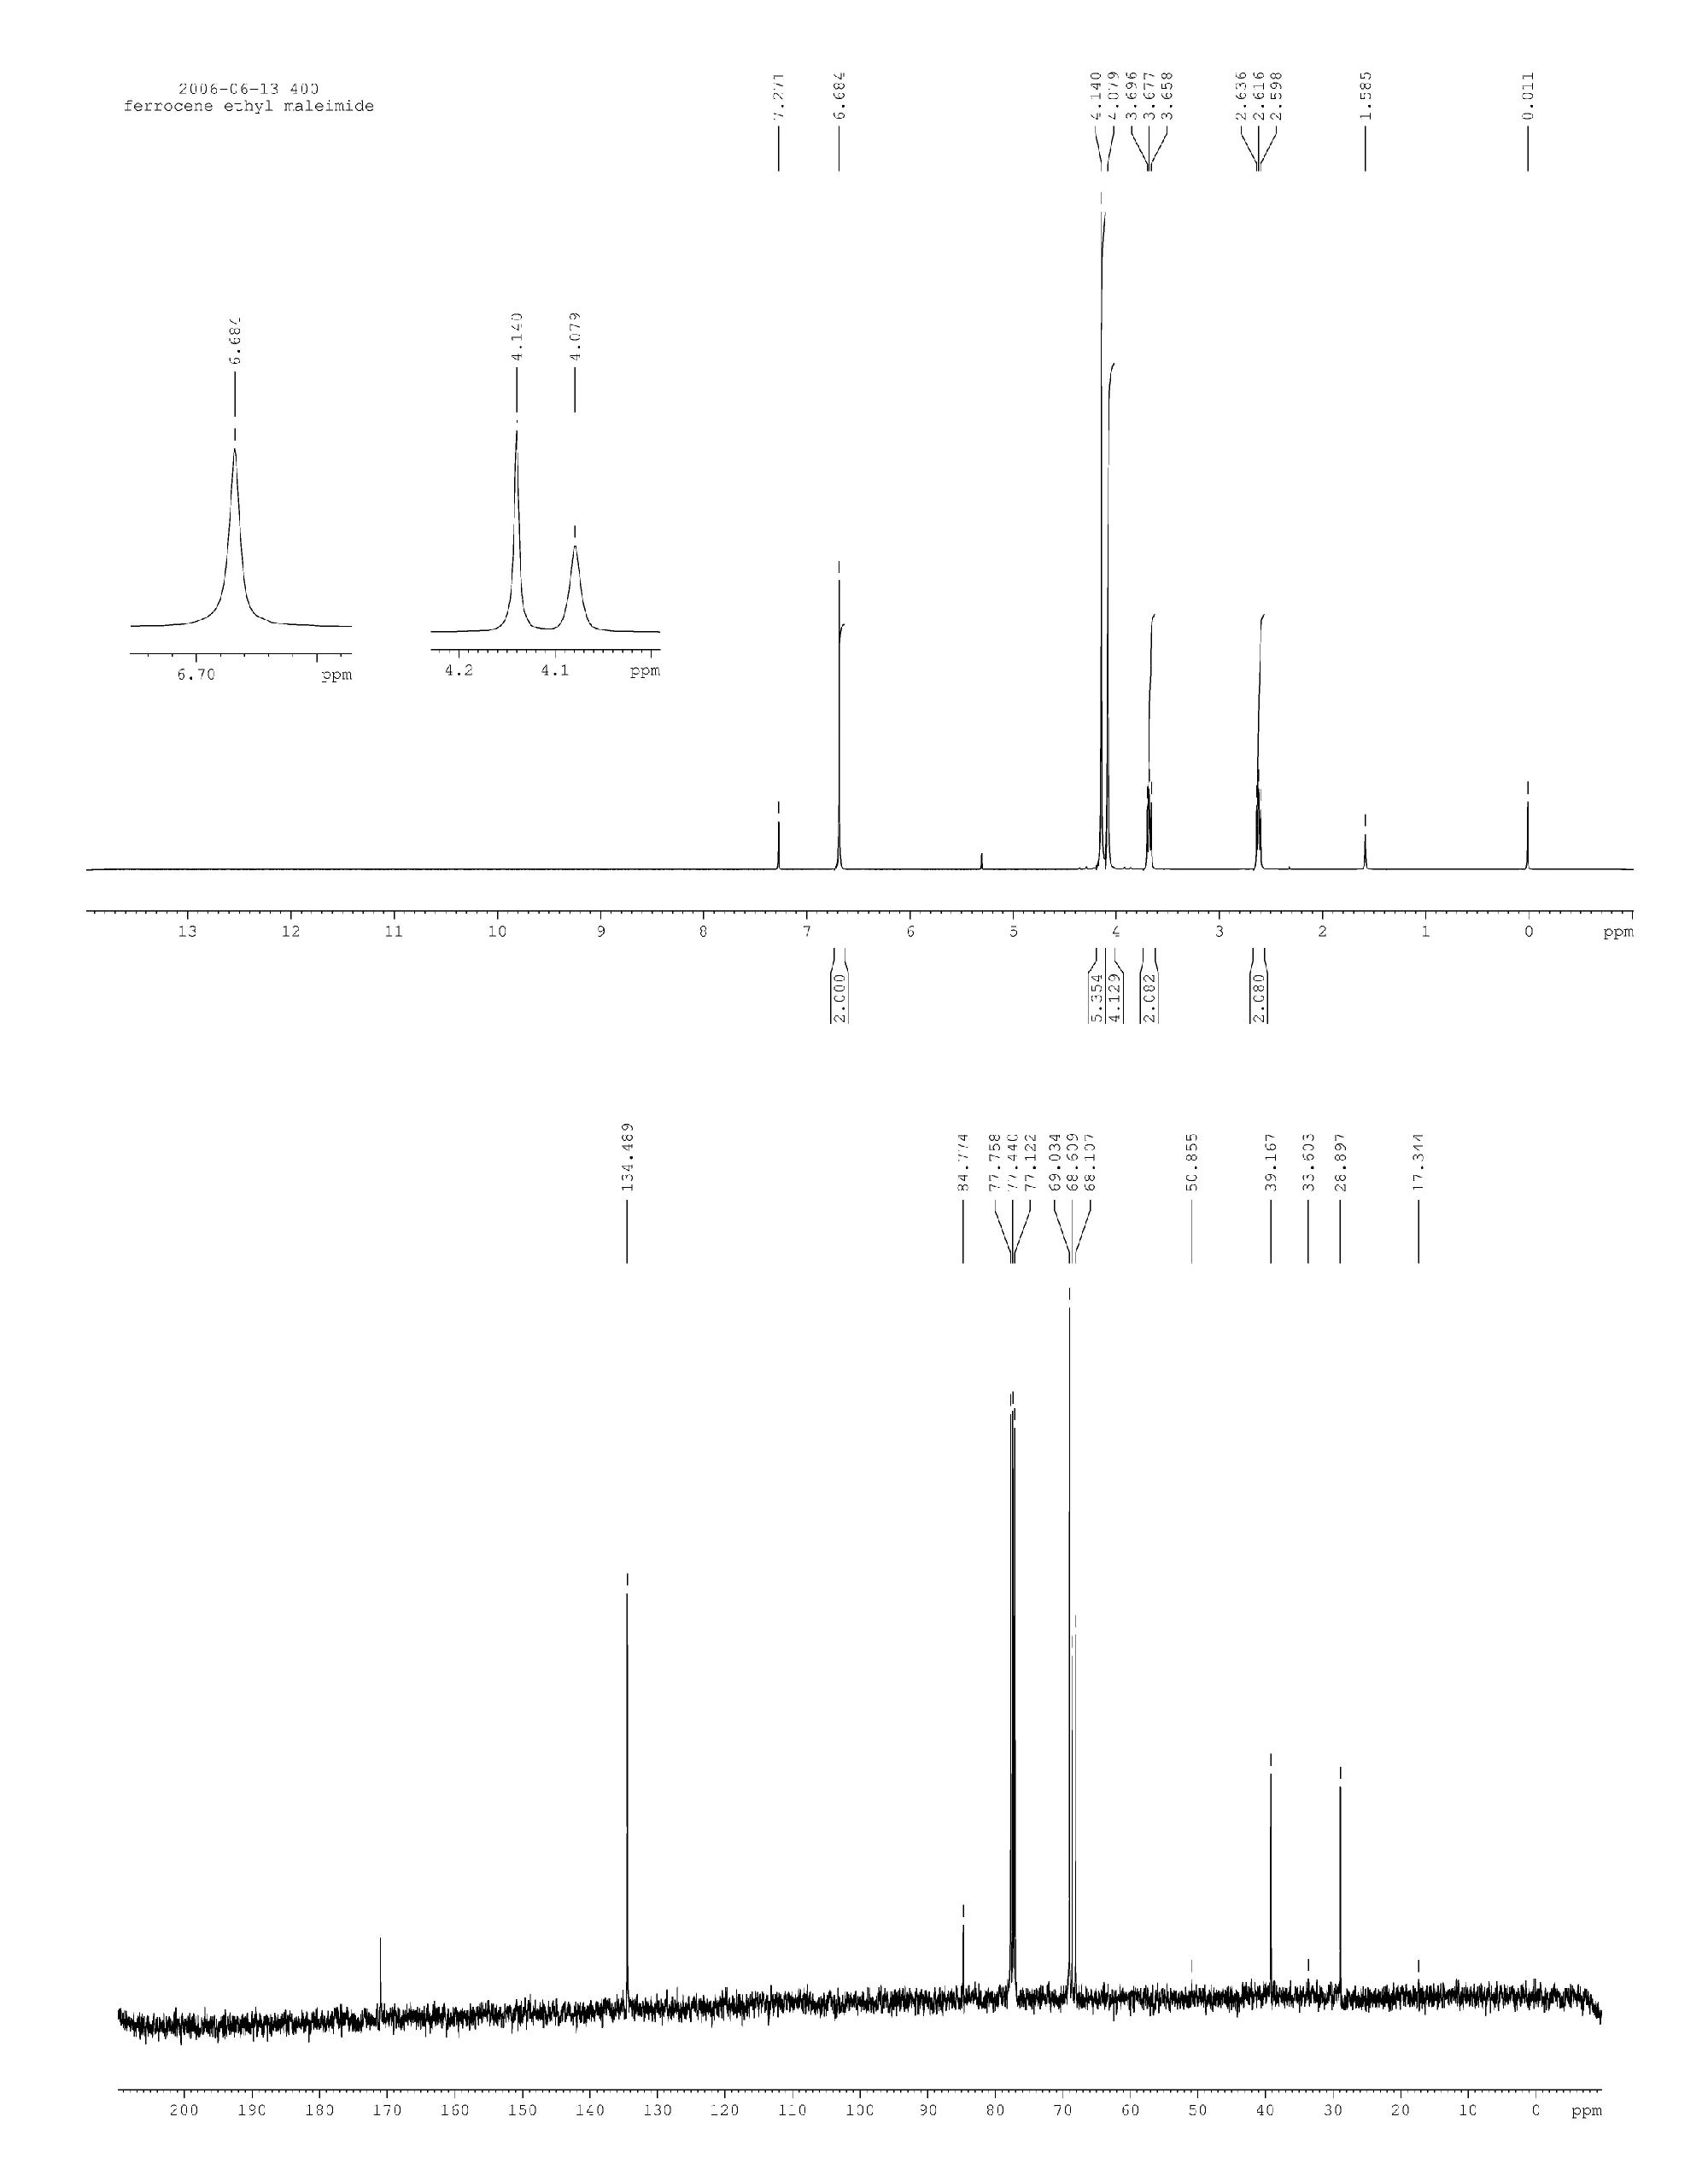
All DNA oligonucleotides were purchased from MWG Biotech and were HPLC purified. Synthesis and characterization of N-(2-ferrocene-ethyl) maleimide and its conjugation to target oligonucleotides are described in the SI.
Electrode Preparation.
The studies used a 1.6 mm diameter polycrystalline gold working electrode (WE), a platinum wire counter electrode, and a Ag/AgCl/3M NaCl reference electrode. The working electrode was mechanically and electrochemically polished as previously described (42, 43), and its roughness factor r (r = true area/geometric area; r ≥ 1) was measured from the double layer capacitance (42, 43). Values of r ranged from 1.39 to 1.69, with an average of 1.56 ± 0.09, and were used to correct probe and target coverages. Probe deposition on the WE was for 30 min from concentrations ranging from 0.05 to 1 μM probe in 1 M MgCl2, followed by 90 min immersion in 1 mM solution of MCP in deionized water. During all transfer steps the electrode remained covered by a droplet of solution to prevent ambient contact.
Determination of Probe Coverage.
Probe coverage was determined using an existing protocol (23, 43, 44). After a background cyclic voltammetry (CV) measurement at 0.08 V/s in deoxygenated 10 mM Tris base, pH 7.4, the probe layer was immersed in 1 μM hexaamine ruthenium(III) (RuHex3+) in the same electrolyte and a CV scan was repeated after 3 min of equilibration. The background was subtracted and the total charge due to reduction of RuHex3+ (RuHex3+ + e- → RuHex2+) associated with the probe layer was determined by integration. The total charge was converted to probe coverage using a previously derived calibration against coverages measured with x-ray photoelectron spectroscopy for the same probe sequence. Processing of the XPS data used photoionization cross-sections from Wagner (45) and effective attenuation lengths calculated from the NIST SRD-82 v.1.0 database (46). The analysis was as previously described (43, 47).
Hybridization and Regeneration of Probe Films.
Consecutive hybridizations to complementary target were performed for five ionic strengths of pH 7.0 sodium phosphate or, alternately, of pH 7.4 potassium phosphate buffer: 1 M, 0.33 M, 0.11 M, 0.037 M and 0.012 M, expressed in molarity of buffer phosphate. Control hybridizations to noncomplementary target were carried out at each probe coverage at 1 M and 0.012 M ionic strength. After 5 min of preconditioning in buffer a background CV was taken. Next, ferrocene-labeled target was added to a 100 nM final concentration. CV measurements were collected 5 min apart at 0.08 V/s scan rate between 0 and 0.35 V until the last several traces overlapped. During hybridizations in sodium phosphate the potential was continuously held at 0 V except during CV scans, and the target solutions were stirred at all times. For the potassium phosphate series, following each CV scan the WE potential was initialized at 0 V, and then the electrochemical cell was shut off until the next CV scan. A double liquid junction setup was used for the sodium phosphate, but not for the potassium phosphate, measurements. Between hybridizations at different ionic strengths the WE was rinsed with deionized water for 15 s to remove bound target, followed by preconditioning in fresh background electrolyte before the next hybridization.
Experimental Controls.
Control experiments were carried out to test for nonspecific adsorption of solution DNA to probe films, for stability of the probe layer over time, for effectiveness of probe layer regeneration between hybridizations at different values of CB, and for effect of the direction in which CB was varied (1 M to 0.012 M, or 0.012 M to 1 M). Exposure of probe films to solutions of noncomplementary target sequences 5′-TTT TTT TCC TTC CTT- TTT-F2-3′, under otherwise identical conditions, yielded signals below detection limit (Fig. 1, left inset). Measurement of probe coverage before and after an ionic strength series confirmed that probe coverage stayed within 12%. Effectiveness of the regeneration procedure was verified by absence of target signal after a deionized water rinse (e.g., the background trace in Fig. 1 followed regeneration after a hybridization at CB = 0.33 M). Varying CB from 1 M to 0.012 M, or from 0.012 M to 1 M, produced points that fell on the same overall trends. Data from both types of CB series were combined and presented together.
Supplementary Material
Acknowledgments.
We thank Drs. Xiang Wang and Matt Tremblay for their advice with synthesis of N-ferrocene-ethyl maleimide. Dr. Jingyue Ju is much appreciated for providing access to MALDI-TOF MS characterization and HPLC purification facilities, and we thank Drs. Zengmin Li and Xiaoxu Li for their expert technical assistance with these techniques. The project was supported by Grant Number HG003089 from the National Human Genome Research Institute.
Footnotes
The authors declare no conflict of interest.
This article is a PNAS Direct Submission.
This article contains supporting information online at www.pnas.org/cgi/content/full/0709416105/DC1.
The precise threshold value of Π is expected to vary somewhat with base sequence, temperature, and other parameters that influence hybridization equilibrium.
References
- 1.Graves DJ. Powerful tools for genetic analysis come of age. Trends Biotechnol. 1999;17:127–134. doi: 10.1016/s0167-7799(98)01241-4. [DOI] [PubMed] [Google Scholar]
- 2.Schena M, et al. Microarrays: Biotechnology's discovery platform for functional genomics. Trends Biotechnol. 1998;16:301–306. doi: 10.1016/s0167-7799(98)01219-0. [DOI] [PubMed] [Google Scholar]
- 3.Draghici S, Khatri P, Eklund AC, Szallasi Z. Reliability and reproducibility issues in DNA microarray measurements. Trends Genet. 2006;22:101–109. doi: 10.1016/j.tig.2005.12.005. [DOI] [PMC free article] [PubMed] [Google Scholar]
- 4.Bammler T, et al. Standardizing global gene expression analysis between laboratories and across platforms. Nat Methods. 2005;2:1–6. doi: 10.1038/nmeth754. [DOI] [PubMed] [Google Scholar]
- 5.Levicky R, Horgan A. Physicochemical perspectives on DNA microarray and biosensor technologies. Trends Biotechnol. 2005;23:143–149. doi: 10.1016/j.tibtech.2005.01.004. [DOI] [PubMed] [Google Scholar]
- 6.Binder H. Thermodynamics of competitive surface adsorption on DNA microarrays. J Phys Condens Matter. 2006;18:S491–S523. [Google Scholar]
- 7.Halperin A, Buhot A, Zhulina EB. On the hybridization isotherms of DNA microarrays: The Langmuir model and its extensions. J Phys Condens Matter. 2006;18:S463–S490. [Google Scholar]
- 8.Burden CJ, Pittelkow Y, Wilson SR. Adsorption models of hybridization and post-hybridization behaviour on oligonucleotide microarrays. J Phys Condens Matter. 2006;18:5545–5565. [Google Scholar]
- 9.Dandy DS, Wu P, Grainger DW. Array feature size influences nucleic acid surface capture in DNA microarrays. Proc Natl Acad Sci USA. 2007;104:8223–8228. doi: 10.1073/pnas.0606054104. [DOI] [PMC free article] [PubMed] [Google Scholar]
- 10.Glazer M, et al. Kinetics of oligonucleotide hybridization to photolithographically patterned DNA arrays. Anal Biochem. 2006;358:225–238. doi: 10.1016/j.ab.2006.07.042. [DOI] [PubMed] [Google Scholar]
- 11.Fiche JB, Buhot A, Calemczuk R, Livache T. Temperature effects on DNA chip experiments from surface plasmon resonance imaging: Isotherms and melting curves. Biophys J. 2007;92:935–946. doi: 10.1529/biophysj.106.097790. [DOI] [PMC free article] [PubMed] [Google Scholar]
- 12.Moiseev L, Unlu MS, Swan AK, Goldberg BB, Cantor CR. DNA conformation on surfaces measured by fluorescence self-interference. Proc Natl Acad Sci USA. 2006;103:2623–2628. doi: 10.1073/pnas.0511214103. [DOI] [PMC free article] [PubMed] [Google Scholar]
- 13.Yao DF, et al. Surface density dependence of PCR amplicon hybridization on PNA/DNA probe layers. Biophys J. 2005;88:2745–2751. doi: 10.1529/biophysj.104.051656. [DOI] [PMC free article] [PubMed] [Google Scholar]
- 14.Watterson JH, Piunno PAE, Wust CC, Krull UJ. Effects of oligonucleotide immobilization density on selectivity of quantitative transduction of hybridization of immobilized DNA. Langmuir. 2000;16:4984–4992. [Google Scholar]
- 15.Shchepinov MS, CaseGreen SC, Southern EM. Steric factors influencing hybridisation of nucleic acids to oligonucleotide arrays. Nucleic Acids Res. 1997;25:1155–1161. doi: 10.1093/nar/25.6.1155. [DOI] [PMC free article] [PubMed] [Google Scholar]
- 16.Wong ELS, Chow E, Gooding JJ. DNA recognition interfaces: The influence of interfacial design on the efficiency and kinetics of hybridization. Langmuir. 2005;21:6957–6965. doi: 10.1021/la050725m. [DOI] [PubMed] [Google Scholar]
- 17.Peterson AW, Heaton RJ, Georgiadis RM. The effect of surface probe density on DNA hybridization. Nucleic Acids Res. 2001;29:5163–5168. doi: 10.1093/nar/29.24.5163. [DOI] [PMC free article] [PubMed] [Google Scholar]
- 18.Peterson AW, Wolf LK, Georgiadis RM. Hybridization of mismatched or partially matched DNA at surfaces. J Am Chem Soc. 2002;124:14601–14607. doi: 10.1021/ja0279996. [DOI] [PubMed] [Google Scholar]
- 19.Gong P, Harbers GM, Grainger DW. Multi-technique comparison of immobilized and hybridized oligonucleotide surface density on commercial amine-reactive microarrays slides. Anal Chem. 2006;78:2342–2351. doi: 10.1021/ac051812m. [DOI] [PubMed] [Google Scholar]
- 20.Gong P, Lee C-Y, Gamble LJ, Castner DG, Grainger DW. Hybridization behavior of mixed DNA/alkylthiol monolayers on gold: Characterization by surface plasmon resonance and 32P radiometric assay. Anal Chem. 2006;78:3326–3334. doi: 10.1021/ac052137j. [DOI] [PMC free article] [PubMed] [Google Scholar]
- 21.Levicky R, Herne TM, Tarlov MJ, Satija SK. Using self-assembly to control the structure of DNA monolayers on gold: A neutron reflectivity study. J Am Chem Soc. 1998;120:9787–9792. [Google Scholar]
- 22.Shen G, Anand MFG, Levicky R. X-ray photoelectron spectroscopy and infrared spectroscopy study of maleimide-activated supports for immobilization of oligodeoxyribonucleotides. Nucleic Acids Res. 2004;32:5973–5980. doi: 10.1093/nar/gkh932. [DOI] [PMC free article] [PubMed] [Google Scholar]
- 23.Steel AB, Herne TM, Tarlov MJ. Electrochemical quantitation of DNA immobilized on gold. Anal Chem. 1998;70:4670–4677. doi: 10.1021/ac980037q. [DOI] [PubMed] [Google Scholar]
- 24.Forman JE, Walton ID, Stern D, Rava RP, Trulson MO. Thermodynamics of duplex formation and mismatch discrimination on photolithographically synthesized oligonucleotide arrays. ACS Symp Ser. 1998;682:206–228. [Google Scholar]
- 25.Henry MR, Stevens PW, Sun J, Kelso DM. Real-time measurements of DNA hybridization on microparticles with fluorescence resonance energy transfer. Anal Biochem. 1999;276:204–214. doi: 10.1006/abio.1999.4344. [DOI] [PubMed] [Google Scholar]
- 26.Nelson BP, Grimsrud TE, Liles MR, Goodman RM, Corn RM. Surface plasmon resonance imaging measurements of DNA and RNA hybridization adsorption onto DNA microarrays. Anal Chem. 2001;73:1–7. doi: 10.1021/ac0010431. [DOI] [PubMed] [Google Scholar]
- 27.Okahata Y, et al. Kinetic measurements of DNA hybridisation on an oligonucleotide-immobilized 27-MHz quartz crystal microbalance. Anal Chem. 1998;70:1288–1296. doi: 10.1021/ac970584w. [DOI] [PubMed] [Google Scholar]
- 28.Herne TM, Tarlov MJ. Characterization of DNA probes immobilized on gold surfaces. J Am Chem Soc. 1997;119:8916–8920. [Google Scholar]
- 29.Gleria KD, Hill HAO, Wong LL. N-(2-ferrocene-ethyl)maleimide: A new electroactive sulphydryl-specific reagent for cysteine-containing peptides and proteins. FEBS Lett. 1996;390:142–144. doi: 10.1016/0014-5793(96)00648-5. [DOI] [PubMed] [Google Scholar]
- 30.Borisov OV, Zhulina EB, Birshtein TM. Diagram of states of a grafted polyelectrolyte layer. Macromolecules. 1994;27:4795–4803. [Google Scholar]
- 31.O'Shaughnessy B, Yang Q. Strongly charged polymer brushes. Europhys Lett. 2006;75:427–433. [Google Scholar]
- 32.Halperin A, Buhot A, Zhulina EB. Sensitivity, specificity, and the hybridization isotherms of DNA chips. Biophys J. 2004;86:718–730. doi: 10.1016/S0006-3495(04)74150-8. [DOI] [PMC free article] [PubMed] [Google Scholar]
- 33.Hekstra D, Taussig AR, Magnasco M, Naef F. Absolute mRNA concentrations from sequence-specific calibration of oligonucleotide arrays. Nucleic Acids Res. 2003;31:1962–1968. doi: 10.1093/nar/gkg283. [DOI] [PMC free article] [PubMed] [Google Scholar]
- 34.Held GA, Grinstein G, Tu Y. Modeling of DNA microarray data by using physical properties of hybridization. Proc Natl Acad Sci USA. 2003;100:7575–7580. doi: 10.1073/pnas.0832500100. [DOI] [PMC free article] [PubMed] [Google Scholar]
- 35.Vainrub A, Pettitt BM. Coulomb blockage of hybridization in two-dimensional DNA arrays. Phys Rev E. 2002;66 doi: 10.1103/PhysRevE.66.041905. 041905. [DOI] [PubMed] [Google Scholar]
- 36.Vainrub A, Pettitt BM. Sensitive quantitative nucleic acid detection using oligonucleotide microarrays. J Am Chem Soc. 2003;125:7798–7799. doi: 10.1021/ja035020q. [DOI] [PubMed] [Google Scholar]
- 37.SantaLucia J., Jr A unified view of polymer, dumbbell, and oligonucleotide DNA nearest-neighbor thermodynamics. Proc Natl Acad Sci USA. 1998;95:1460–1465. doi: 10.1073/pnas.95.4.1460. [DOI] [PMC free article] [PubMed] [Google Scholar]
- 38.Manning GS. Application of polyelectrolyte limiting laws to helix-coil transition of DNA .1. Excess univalent cations. Biopolymers. 1972;11:937–949. doi: 10.1002/bip.1972.360110502. [DOI] [PubMed] [Google Scholar]
- 39.Record MT, Lohman TM. A semiempirical extension of polyelectrolyte theory to the treatment of oligoelectrolytes: Application to oligonucleotide helix-coil transitions. Biopolymers. 1978;17:159–166. [Google Scholar]
- 40.Bloomfield VA, Crothers DM, Tinoco I., Jr . Nucleic Acids: Structures, Properties, and Functions. Sausalito, CA: University Science; 2000. [Google Scholar]
- 41.Halperin A, Buhot A, Zhulina EB. Brush effects on DNA chips: Thermodynamics, kinetics and design guidelines. Biophys J. 2005;89:796–811. doi: 10.1529/biophysj.105.063479. [DOI] [PMC free article] [PubMed] [Google Scholar]
- 42.Oesch U, Janata J. Electrochemical study of gold electrodes with anodic oxide films: I. Formation and reduction behavior of anodic oxides on gold. Electrochim Acta. 1983;28:1237–1246. [Google Scholar]
- 43.Shen G, et al. Charging behavior of single-stranded DNA polyelectrolyte brushes. J Am Chem Soc. 2006;128:8427–8433. doi: 10.1021/ja0571500. [DOI] [PMC free article] [PubMed] [Google Scholar]
- 44.Yu H-Z, Luo C-Y, Sankar CG, Sen D. Voltammetric procedure for examining DNA-modified surfaces: Quantitation, cationic binding activity, and electron-transfer kinetics. Anal Chem. 2003;75:3902–3907. doi: 10.1021/ac034318w. [DOI] [PubMed] [Google Scholar]
- 45.Wagner CD, et al. Empirical atomic sensitivity factors for quantitative analysis by electron spectroscopy for chemical analysis. Surf Interface Anal. 1981;3:211–225. [Google Scholar]
- 46.Powell CJ, Jablonski A. NIST Electron Effective-Attenuation-Length Database. Gaithersburg, MD: National Institute of Standards and Technology; 2001. Version 1.0. [Google Scholar]
- 47.Petrovykh DY, Kimura-Suda H, Tarlov MJ, Whitman LJ. Quantitative characterization of DNA films by X-ray photoelectron spectroscopy. Langmuir. 2004;20:429–440. doi: 10.1021/la034944o. [DOI] [PubMed] [Google Scholar]
Associated Data
This section collects any data citations, data availability statements, or supplementary materials included in this article.