Abstract
We use a chemistry-climate model and new estimates of smoke produced by fires in contemporary cities to calculate the impact on stratospheric ozone of a regional nuclear war between developing nuclear states involving 100 Hiroshima-size bombs exploded in cities in the northern subtropics. We find column ozone losses in excess of 20% globally, 25–45% at midlatitudes, and 50–70% at northern high latitudes persisting for 5 years, with substantial losses continuing for 5 additional years. Column ozone amounts remain near or <220 Dobson units at all latitudes even after three years, constituting an extratropical “ozone hole.” The resulting increases in UV radiation could impact the biota significantly, including serious consequences for human health. The primary cause for the dramatic and persistent ozone depletion is heating of the stratosphere by smoke, which strongly absorbs solar radiation. The smoke-laden air rises to the upper stratosphere, where removal mechanisms are slow, so that much of the stratosphere is ultimately heated by the localized smoke injections. Higher stratospheric temperatures accelerate catalytic reaction cycles, particularly those of odd-nitrogen, which destroy ozone. In addition, the strong convection created by rising smoke plumes alters the stratospheric circulation, redistributing ozone and the sources of ozone-depleting gases, including N2O and chlorofluorocarbons. The ozone losses predicted here are significantly greater than previous “nuclear winter/UV spring” calculations, which did not adequately represent stratospheric plume rise. Our results point to previously unrecognized mechanisms for stratospheric ozone depletion.
Keywords: black carbon, geoengineering, nuclear winter, stratospheric ozone, atmospheric chemistry
In the early 1980s, quantitative studies of the catastrophic climactic impacts of a global nuclear war [a scenario that came to be known as “nuclear winter” (1–4)] prompted intense public debate about previous assumptions that nuclear war could be winnable, and preceded the first significant reductions in nuclear weapons stockpiles in the history of the cold war. Ensuing numerical studies of perturbations in stratospheric ozone chemistry focused on oxides of nitrogen (NOx) produced by the shock waves and fireballs of the atomic blasts and lofted into the stratosphere by the rising atomic fireballs (5, 6). Based on calculations with a one-dimensional eddy diffusion and chemical reaction model, a 1985 National Research Council report predicted that the slow upward transport of NOx generated by a global nuclear exchange of 6500 Mt would deplete a maximum of 17% of the ozone column averaged over the Northern Hemisphere after one year, with half recovery (to 8.5% loss) by year 3. Later studies showed that solar heating of smoke produced by massive fires after such a nuclear exchange would alter stratospheric circulation and chemistry, inducing rapid ozone depletion—termed “UV spring”—by both direct displacement of ozone and enhancement of catalytic ozone destruction cycles (7, 8).
Although the risk of global nuclear war has diminished since the 1980s, the proliferation of nuclear weapons has produced greater risks of a regional nuclear conflict. At the same time, global climate models have improved considerably. Toon et al. (9) recently assessed the damage that might result from the arsenals of the world's newest nuclear powers, and showed that the direct effects of even a small number of relatively low-yield nuclear weapon explosions in modern megacities could produce unexpectedly large numbers of fatalities. Their analysis shows that a nuclear attack on a single country involving 50 Hiroshima-size (15 kt) bombs could generate 1–5 Tg of black carbon aerosol particles in the upper troposphere, after an initial 20% removal in “black rains” induced by firestorms. A regional nuclear conflict between India and Pakistan, for example, in which each used 50 such weapons is estimated to produce ≈6.6 Tg of black carbon. Robock et al. (10) used these smoke estimates in a state-of-the-art general circulation model to produce the first predictions of the climatic effects of a regional nuclear exchange. Their calculations suggest aerosols would be lofted within days to the upper stratosphere. The absorption of sunlight by the stratospheric soot produces a global average surface cooling of 1.25°C persisting for several years and large reductions in precipitation associated with the Asian summer monsoon and other disruptions to the global climate system.
Here, we examine the impact on stratospheric chemistry of smoke from fires after such a regional nuclear war. Our calculations employ the Whole Atmosphere Community Climate Model 3 (WACCM3), an advanced chemistry-climate model with a well resolved stratosphere and mesosphere. We have coupled WACCM3 with the Community Aerosol and Radiation Model for Atmospheres (CARMA), a flexible three-dimensional microphysics package, that we have adapted for the treatment of black carbon aerosol. We conducted three 10-year simulations initialized with 1995 tracer-mixing ratios. Two model scenarios were run with 1 and 5 Tg of soot, respectively, initially located in the upper troposphere over Pakistan on May 15, with radiative feedback between soot absorption and dynamics. A control run was carried out under the same conditions, but without soot radiative feedback. In contrast to older simulations of ozone loss after full-scale nuclear conflicts, we did not inject any additional NOx, because we expect such injections to be relatively small for the cases considered (9). Additional model runs have shown that the calculated response does not vary significantly with the season of the initial soot injection.
Results
Here, we first discuss the results for a 5-Tg soot injection, and later compare that with the 1-Tg case. The subtropical insolation heats the injected black carbon particles, which in turn heat the ambient air, causing it to rise rapidly, even as a strong subtropical jet and eddies begin mixing the soot zonally and meridionally through the upper troposphere. In the 5-Tg soot case, 20% of the soot rains out in the troposphere within the first 10 days. We assume, perhaps conservatively, that this calculated rainout occurs after the initial “black rain” removal calculated by Toon et al. (9). The remaining 4 Tg rises to the stratosphere, where removal processes are slow (10). Within 10 days of injection, the soot reaches a maximum altitude near 80 km in the mesosphere. Gravitational settling restricts the particles from reaching higher altitudes, where low ambient air pressures fail to suspend the 0.1-μm particles. These calculations confirm the response calculated by Robock et al. (10) with an independent model.
We predict severe perturbations to stratospheric temperatures, comparable to those reported by Robock et al. (10). The extreme heating has an immediate effect on chemical reaction rates, perturbing several mechanisms that regulate odd-oxygen (O3 + O). We have examined the rates for 20 reactions controlling the major production and catalytic loss cycles that produce and destroy odd oxygen, involving the catalysts from the odd oxygen, odd nitrogen, odd hydrogen, odd chlorine, and odd bromine chemical families.
Two cycles dominate the changes in chemistry after the soot injection. The control of odd-oxygen by the Chapman mechanism is highly sensitive to temperature through the following reaction, which requires significant activation energy and becomes faster as temperature increases:
In addition, odd-nitrogen (NOx) catalyzes the following temperature-sensitive odd-oxygen loss cycle:
In the stratosphere, temperatures remain 30–60°C above normal throughout the first year after the introduction of the soot aerosol. In the 20- to 30-km altitude range, where ozone concentrations peak, the rate constant for reaction 1 increases by a factor of 3 to 6, and that for reaction 2 increases by a factor of 2 to 4. As we will demonstrate, changes in the concentrations of reactants affect the rate of these loss processes as well.
As the smoke-laden air passes through the tropopause, raising upper troposphere/lower stratosphere (UT/LS) temperatures significantly, it produces a major perturbation to stratospheric water vapor, which in turn affects odd hydrogen (HOx) and associated catalytic cycles depleting ozone. Under normal conditions, cold tropopause temperatures limit mixing ratios of water vapor entering the lower stratosphere to 3.0 to 4.5 ppmv. The 5 Tg of soot allows a pulse of additional water into the tropical UT/LS region, with typical increases of 4–5 ppmv and a short-lived local maximum of 10 ppmv additional H2O. H2O-mixing ratios at <25 km increase by factors typically ranging between 0% and 200%, with transitory local increases of up to 450% in the UT/LS region. Above 25 km, a maximum increase of 4 ppmv occurs in the tropics, with increases of 0.5 to 2.5 ppmv more typical. Above 40 km, H2O-mixing ratios increase by 0–50%. Of the HOx-catalyzed ozone loss cycles, one is important at <40 km:
The global-mean column-integrated rate for reaction 5 nearly doubles immediately after the smoke perturbation, because of increased HOx abundance, but remains more than an order of magnitude lower than that for either reaction 1 or reaction 2 throughout all model runs. All other HOx-catalyzed ozone loss cycles are significant only at >40 km, and remain relatively unperturbed by the smoke perturbation. Similarly, other ozone-destroying catalytic cycles involving odd nitrogen, chlorine, and bromine were not significantly perturbed compared with reactions 1 and 2.
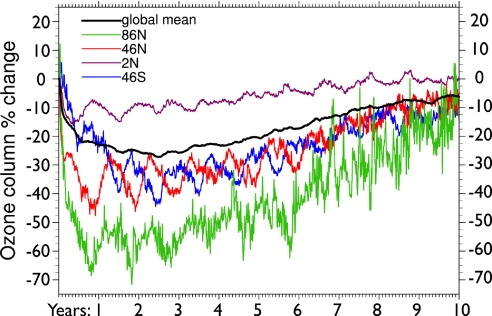
We calculate large losses in total (column) ozone that persist for years after the soot input. The global mean ozone column remains depleted by 20–25% for 5 years after the injection (Fig. 1). Catalytic destruction during the transport of air poleward compounds ozone loss at high latitudes. Throughout the first 5 years, total ozone depletions are 25–45% at midlatitudes and 50–70% at northern high latitudes.
Fig. 1.
Time evolution of the total ozone column after a 5-Tg soot injection in the upper troposphere at 30°N latitude. Changes in ozone are given as a percent deviation of the integrated column from the control run, or baseline value, as a function of time since soot injection. The global-mean total ozone variation is shown along with zonal-average changes at four specific latitudes (as labeled). Note that the seasonal signal is amplified during periods of strong smoke perturbation, especially at midlatitudes.
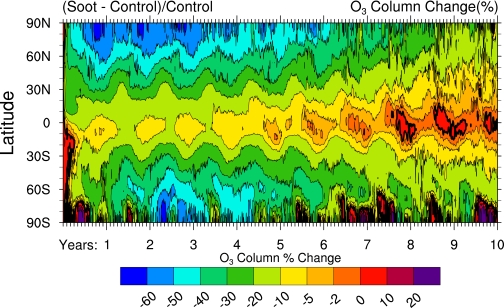
Significant ozone reductions occur at all latitudes with two minor exceptions (Fig. 2). Initially, the strong convection generated by the rising plume at 30°N disrupts the stratospheric circulation, transporting ozone to the Southern Hemisphere, where column increases occur. Within 6–8 weeks, these small increases (<10%) shift to depletions, which then grow in magnitude at all latitudes. Over Antarctica, however, the formation of the austral springtime ozone “hole” is suppressed in the first 2 years after soot injection, leading to a net ozone enhancement during those periods. Analysis shows that increased stratospheric temperatures inhibit heterogeneous activation of chlorine on polar stratospheric clouds, a requirement for producing the ozone hole. Nevertheless, by the third, fourth, and fifth years, ozone columns over Antarctica fall well below even those typical of current ozone hole conditions because of the transport of very low ozone-mixing ratios from lower latitudes.
Fig. 2.
Zonally averaged total ozone deviations from the baseline (in Dobson units) versus latitude as a function of time, for the same conditions as in Fig. 1. Note that the most rapid recovery of the ozone layer occurs at tropical latitudes.
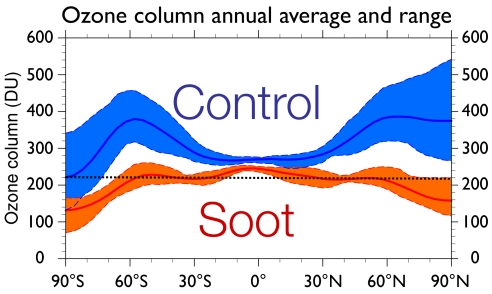
Fig. 3 presents the annual mean, zonally averaged total ozone amounts for the control and soot cases during the second calendar year after injection. The Antarctic ozone hole is commonly defined by columns of <220 Dobson units (DU) (11). By this definition, our calculations indicate an extratropical ozone hole lasting up to 5 years (cf. Fig. 1).
Fig. 3.
Annual mean values (solid lines) of the zonally averaged total ozone column amount (Dobson units, DU) are shown as a function of latitude for the control and 5-Tg soot cases during the second year of simulation. The shaded regions indicate the overall range of variation in the zonal average ozone column over the year. The dotted line at 220 DU marks the definition used to identify the current Antarctic ozone hole.
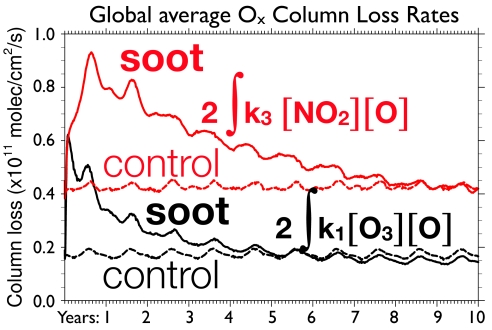
The time-dependent, globally averaged column odd-oxygen loss rates for key chemical processes are illustrated in Fig. 4. In the first months, reaction 1 (Chapman cycle) causes the greatest ozone loss, rising within weeks from 1.7 × 10¹⁰ to 6.2 × 10¹⁰ molecules per cm2/s, a factor of 3.6. However, within a year this loss rate diminishes by 50% from its peak, as the odd-oxygen reactants are depleted, and further decreases to 2.5 × 10¹⁰ molecules per cm2/s after ≈4 years. By comparison, the rate of reaction 3, the rate-limiting step for the main NOx catalytic cycle, increases from a global average of 4.0 × 10¹⁰ to 9.5 × 10¹⁰ molecules per cm2/s. The rate of the NOx loss cycle diminishes much more slowly than that of reaction 1, remaining >6 × 10¹⁰ molecules per cm2/s for several years.
Fig. 4.
Time evolution of the global-mean column ozone loss rates for the two catalytic ozone loss cycles most perturbed by the 5-Tg soot injection. Black lines compare the Chapman (odd-oxygen) cycle in the control (dashed) and 5-Tg soot (solid) cases. Red lines compare the odd-nitrogen cycle in the control (dashed) and 5-Tg soot (solid) cases. The vertical axis gives column ozone loss rates in molecules per cm2/s. Time is measured in years since soot injection.
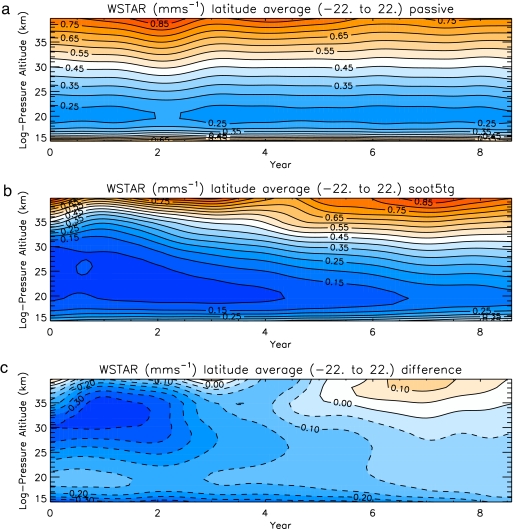
The dominance of the NOx reaction rate is caused not only by increased temperatures but also by changes in stratospheric circulation. The rising soot plume carries aloft air with enhanced mixing ratios of N2O, which is a source of stratospheric NOx through the reaction of N2O with excited oxygen atoms, O(1D), generated by ozone photolysis. This enhanced source of ozone-depleting NOx is then confined in the stratosphere longer than normal, because the Brewer–Dobson circulation is subsequently decelerated to less than half its normal rate for several years. This slowdown is consistent with the calculations of Robock et al. (10) and results from surface cooling, which leads to a reduction in wave forcing of the zonal-mean meridional circulation in the lower stratosphere. The decelerated circulation reduces the dynamical sink for stratospheric odd-nitrogen, further enhancing ozone destruction. Hence, the soot induces changes in both temperature and stratospheric circulation that couple with chemistry to destroy ozone more effectively than normal. The perturbation to the NOx cycle persists for ≈8 years after the soot injection (Fig. 4).
Our calculations show a strong “self-healing” response of the ozone layer. Because depletion of ozone allows more UV radiation to penetrate lower into the atmosphere, photolysis of O2 increases dramatically at <30 km, producing additional ozone and limiting column losses to some extent. Globally averaged column O2 photolysis rates increase by ≈60% in the first year after soot input. Despite this dramatic negative feedback, large net ozone column losses are still calculated, especially at middle and high latitudes, where the ozone is transported from the tropical source region.
Discussion
Depletion of the ozone column relative to normal conditions may impact living organisms, which are usually adapted to local UV radiation levels. Increased UV radiation is largely detrimental, damaging terrestrial and oceanic plants and producing skin cancer, ocular damage, and other health effects in humans and animals (12). Conclusive evidence shows that increased UV-B radiation damages aquatic ecosystems, including amphibians, shrimp, fish, and phytoplankton (13). The effects of sunlight on the biota are quantified as a product of the sun's spectrum at the Earth's surface and the action spectra for biologically damaging processes, such as erythema, carcinogenesis, and photoinhibition. An analysis of biological sensitivity to UV spectral changes concluded that a 40% ozone column depletion at 45°N – as computed here – would increase DNA damage (believed related to carcinogenesis) by 213%, and plant damage (e.g., photoinhibition) by 132% relative to normal conditions (14). The smallest ozone column losses are predicted to occur in the tropics, where self-healing limits depletion to ≈10% during the first 3–4 years. Although we found no studies of biological impacts of ozone loss in the tropics, the midlatitude analysis concludes that a 10% column loss would increase DNA damage by ≈28% (12, 14). Ozone losses at midlatitudes point to DNA effects in the range of 150% for five years or more. The biological implications should be further investigated. Increased UV radiation would also alter photochemistry in the lower atmosphere (e.g., smog formation), damage outdoor materials, and alter the biogeochemical cycles of nonliving matter degraded by sunlight (12). It should be noted that these UV estimates do not include the absorption of UV sunlight associated with the soot itself, which we estimate as a <10% effect.
Our 1-Tg soot calculation produces a smaller and shorter-lived ozone depletion compared with the 5-Tg case. As in the 5-Tg case, 20% of the soot is lost before reaching the stratosphere. Global mean column losses peak at 8%, with maximum losses at the poles near 40%. The perturbation to the NOx cycle lasts for up to four years, and ozone columns return to within a few percent of normal globally by the sixth year.
Our calculations show that the smoke produced by a regional nuclear exchange of 100 15-kt weapons in the subtropics would severely deplete ozone columns over populated areas. The magnitude and duration of the predicted ozone reductions are greater than those calculated in the 1980's for global thermonuclear war scenarios involving yields that exceed the ones we considered by factors of >1000. At the time, global models had limited vertical extent, and did not adequately represent the rise of the smoke plumes into the upper stratosphere, nor the consequent temperature changes. The earlier models also did not run long enough simulations to detect the effects of temperature changes on reaction rates, nor rearrangement of gases on the sources of NOx, but instead depended on NOx injections and the short term redistribution of ozone itself.
Our study has not included the production of NOx by nuclear explosions, which was the principal source of ozone depletion in previous studies. The 15-kt weapons assumed by Toon et al. (9) would not lift bomb-generated NOx into the stratosphere directly. The impact of NOx and other chemical pollutants lofted into the stratosphere by large-scale nuclear-induced fires awaits further study. We have also ignored possible heterogeneous loss of ozone catalyzed by soot, and have not considered the possible loss of soot by ozone attack. Recent data show that the reaction probability, γ, for soot decomposition is only ≈10−11, rendering this process unimportant on times scales of several years (15). Laboratory studies of ozone loss on carbon surfaces have reported γ varying between 10−3 and 10−8, because of variations in soot type, the surface area available to ozone, soot deactivation processes, and reaction with other materials (16–20). A concerted laboratory kinetics effort is required before this potential loss of ozone can be calculated with any certainty. Although previous nuclear winter studies have examined the effects of dust lofted by ground bursts, the scenario we examine involves weapons with yields too small to loft dust into the stratosphere with sufficient mass or altitude to have significant global, or even regional, radiative impacts.
Several heterogeneous reactions of nitrogen oxides and acids on soot might influence the chemistry responsible for ozone loss (17, 21). For example, reactions involving reservoir species such as N2O5 and HNO3 might release additional reactive NO and NO2, leading to greater ozone loss. Conversely, the reaction of NO2, producing HONO, might have the opposite effect. Nevertheless, studies indicate that continued exposure to NO2 deactivates soot surfaces, and reaction probabilities decrease significantly for aged soot (17, 21). Soot produced by fires from burning cities is also likely to be largely poisoned by organics and inorganic salts adsorbed on the surface by the time it reaches the upper tropopause, perhaps reducing the importance of heterogeneous reactions.
The global-scale ozone reductions predicted here for relatively small injections of sooty smoke into the upper troposphere and lower stratosphere indicate an unexpected sensitivity associated with such perturbations, and suggest that certain events—such as regional nuclear conflicts, or geoengineering schemes based on absorbing carbonaceous aerosols—might pose an unprecedented hazard to the biosphere worldwide. Our regional nuclear scenario involves <0.1% of the yield of nuclear weapons that currently exist. The current build-up of arsenals in an increasing number of states suggests scenarios in the next few decades that are even more extreme. The potential hazard to global ozone, and hence terrestrial biota, deserves careful analysis by governments worldwide advised by a broad section of the scientific community.
Methods
For the numerical calculations involved in this study, we used the recently merged WACCM/CARMA model. WACCM3 is a state-of-the-art chemistry-climate model (CCM) developed at the National Center for Atmospheric Research (22). CARMA is a flexible three-dimensional bin microphysical model developed over the past 25 years, which has been attached to WACCM3 and adapted for soot simulations.
WACCM3 is a comprehensive model that spans the range of altitude from the Earth's surface to the thermosphere. The dynamical and transport equations are solved by using the explicit flux-form semi-Lagrangian scheme of Lin and Rood (23) on a 4° × 5° latitude-by-longitude grid. Vertical resolution is ≈1 km in the lower stratosphere, 1.75 km near the stratopause, and one-half of the local scale height >65 km. Our calculations used the interactive land and ice models integrated in WACCM3 and prescribed sea surface temperatures.
The chemistry module is derived from the 3D chemical transport Model for OZone And Related chemical Tracers (MOZART) (24–26). For this study, WACCM3 utilizes a 50-species mechanism that represents chemical and physical processes in the middle atmosphere (27–30). The species included within this mechanism are contained in the Ox, NOx, HOx, ClOx, and BrOx chemical families, along with CH4 and its products.
WACCM3 takes into account forcing by subgridscale, mesoscale gravity waves, which are parameterized according to McFarlane (31) for the orographic component, plus a spectrum of nonstationary gravity waves (launched at 500 hPa) with phase velocities between −80 ms−1 and +80 ms−1 every 2.5 ms−1. Further details can be found in Sassi et al. (29). The inclusion of gravity wave driving produces realistic zonal-mean winds, including a sharp reversal of the summer stratospheric easterly jet, which gives way to strong westerlies in the mesosphere.
We use the bin microphysics of the CARMA code to represent black carbon soot in this study. This allows the soot to experience gravitational settling, and obviates the implementation of molecular diffusion, which the gas-phase tracers in WACCM3 experience at high altitudes. CARMA originated from a one-dimensional stratospheric aerosol code developed by Turco et al. (32) and Toon et al. (33) that included both gas-phase sulfur chemistry and aerosol microphysics. The model was improved and extended to three dimensions as described by Toon et al. (34). Extensive updates of the numerics continue to be made. For this study, we limit soot to one size bin of radius 0.1 μm for speed of calculation.
We do not allow calculated particle populations to change radiatively or microphysically other than by sedimentation and transport. Toon et al. (9) point out that coagulation of soot is likely to form chains or sheets, which would have the same or higher mass absorption coefficients as smaller soot particles. Drag forces would decrease sedimentation of such chains or sheets compared with the simple spheres we model, perhaps increasing the stratospheric lifetime. Toon et al. (9) also indicate that the soot is likely to become coated with sulfates, organics, and other nonabsorbing materials, which could increase absorption by ≈50%. These factors point to potentially greater impacts than those we model.
We initialized our two experiment simulations with 5 and 1 Tg of soot, respectively, placed in the upper troposphere in one vertical set of 4° × 5° model gridboxes centered at 30°N, 70°E, over Pakistan. The 1 to 5 Tg soot source term derives from a thorough study of the smoke produced by firestorms in modern megacities after an attack on individual countries with 50 weapons of 15-kT capacity (9). The soot is initially distributed with a uniform mixing ratio between 150 and 300 hPa, in the upper troposphere. Soot mass mixing ratios are coupled into the WACCM3 radiative code, which includes the optical properties of 0.1-μm black carbon soot particles derived from the OPAC project (35).
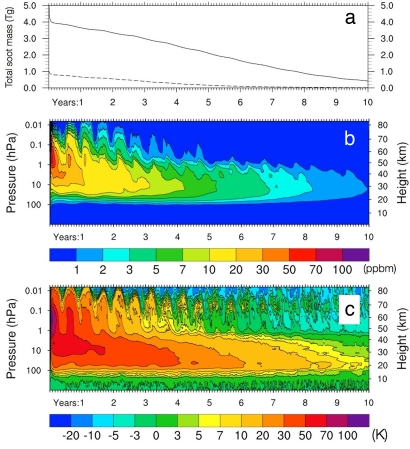
Fig. 5a shows the time evolution of total soot mass in the atmosphere over 10 years in the 5-Tg and 1-Tg cases. In both cases, 20% of soot mass is lost because of rainout in the troposphere as the soot rises initially. The remaining 80%, which reaches the stratosphere, resides there for many years because of the height to which the plume initially rises. Robock et al. (10) calculate the same long stratospheric residence time for soot, as shown in their figure 12, albeit without the initial 20% removal because of rainout.
Fig. 5.
Global mean time evolution of soot mass and temperature. (a) Time evolution of the total mass of atmospheric soot (Tg) after the injection of 5 Tg (solid line) and 1 Tg (dashed line) into the upper troposphere, with radiative feedback. (b) Time evolution of the vertical profile of calculated soot global mean mass mixing ratio (ppbm, 10−9 kg/kg of air) after the injection of 5 Tg of soot into the upper troposphere, with radiative feedback. (c) Time evolution of the vertical profile of the change in global average temperature (°C) due to the 5-Tg soot injection (soot-control).
Fig. 5b shows the time evolution of the global mean vertical profile of soot mass mixing ratio. In the first weeks after the soot injection, solar heating induces very strong convection, lifting the soot up to the stratopause. The stratospheric residence time of air reaching the upper stratosphere is much greater than the average 3–5 year residence time for all stratospheric air. In addition, surface cooling slows the Brewer–Dobson (BD) circulation in the lower stratosphere, further reducing the sink for stratospheric soot (Fig. 6). We have verified that the deceleration of the BD circulation is brought about by a decrease in the Eliassen–Palm flux emanating from the troposphere, which reduces wave driving in the lower stratosphere. The secondary circulation associated with the semiannual oscillation during the solstice in each hemisphere produces the semiannual lofting and sinking seen in Fig. 5b. These results are consistent with those shown in figure 1 from Robock et al. (10).
Fig. 6.
Time evolution of the vertical profile of calculated tropical lower stratospheric vertical wind (mm/s) averaged between 22°S and 22°N for the control run (a), the 5-Tg soot run (b), and the 5-Tg soot run minus the control run (c). In the 5-Tg soot case, vertical winds bringing air up from the tropical troposphere are reduced by more than 50% because of surface cooling.
Fig. 5c shows the time evolution of the vertical profile of the perturbation to the global mean temperature for 10 years after the 5-Tg soot injection. Temperatures in the upper stratosphere initially increase by 100°C. In the lower stratosphere, temperatures remain >30°C above normal throughout the first 4 years after the soot injection. These extreme perturbations are consistent with the calculations shown in figure 4 of Robock et al. (10). Despite these large increases in temperature, the vertical gradient of potential temperature never becomes negative in the stratosphere, indicating that the temperature profile never becomes unstable.
Acknowledgments.
We thank Dan Marsh for his assistance with WACCM3 and Charles Bardeen for WACCM-CARMA integration.
Footnotes
The authors declare no conflict of interest.
This article is a PNAS Direct Submission.
References
- 1.Crutzen PJ, Birks JW. The atmosphere after a nuclear war: Twilight at noon. Ambio. 1982;11:114–125. [Google Scholar]
- 2.Turco RP, Toon OB, Ackerman TP, Pollack JB, Sagan C. Nuclear winter—Global consequences of multiple nuclear-explosions. Science. 1983;222:1283–1292. doi: 10.1126/science.222.4630.1283. [DOI] [PubMed] [Google Scholar]
- 3.Penner JE, Haselman LC, Edwards LL. Smoke-plume distributions above large-scale fires—Implications for simulations of nuclear winter. J Climate Appl Meteorol. 1986;25:1434–1444. [Google Scholar]
- 4.Ghan SJ, MacCracken MC, Walton JJ. Climatic response to large atmospheric smoke injections - sensitivity studies with a tropospheric general-circulation model. J Geophys Res Atmos. 1988;93:8315–8337. [Google Scholar]
- 5.NRC. The Effects on the Atmosphere of a Major Nuclear Exchange. Washington, DC: Academic; 1985. [Google Scholar]
- 6.Stephens SL, Birks JW. After nuclear-war: Perturbations in atmospheric chemistry. Bioscience. 1985;35:557–562. [Google Scholar]
- 7.Malone RC, Auer LH, Glatzmaier Ga, Wood MC, Toon OB. Nuclear winter: 3-dimensional simulations including interactive transport, scavenging, and solar heating of smoke. J Geophys Res Atmos. 1986;91:1039–1053. [Google Scholar]
- 8.Kao CYJ, Glatzmaier GA, Malone RC, Turco RP. Global 3-dimensional simulations of ozone depletion under postwar conditions. J Geophys Res Atmos. 1990;95:22495–22512. [Google Scholar]
- 9.Toon OB, et al. Atmospheric effects and societal consequences of regional scale nuclear conflicts and acts of individual nuclear terrorism. Atmos Chem Phys. 2007;7:1973–2002. [Google Scholar]
- 10.Robock A, et al. Climatic consequences of regional nuclear conflicts. Atmos Chem Phys. 2007;7:2003–2012. [Google Scholar]
- 11.Herman JR, et al. Meteor-3/Total Ozone Mapping Spectrometer observations of the 1993 ozone hole. J Geophys Res Atmos. 1995;100:2973–2983. [Google Scholar]
- 12.Madronich S, McKenzie RL, Bjorn LO, Caldwell MM. Changes in biologically active ultraviolet radiation reaching the earth's surface. J Photochem Photobiol B. 1998;46:5–19. doi: 10.1016/s1011-1344(98)00182-1. [DOI] [PubMed] [Google Scholar]
- 13.Molina MJ, Molina LT, Fitzpatrick TB, Nghiem PT. Ozone depletion and human health effects. In: Möller L, editor. Environmental Medicine. Stockholm: Joint Industrial Safety Council; 2000. pp. 28–51. [Google Scholar]
- 14.Hutchinson TC, Harwell MA, Cropper WP, Grover HD. Additional potential effects of nuclear war on ecological systems. In: Harwell MA, Hutchinson TC, editors. Environmental Consequences of Nuclear War. New York: Wiley; 1985. pp. 174–184. [Google Scholar]
- 15.Kamm S, Saathoff H, Naumann KH, Mohler O, Schurath U. Gasification of a soot aerosol by O3 and NO2: temperature dependence of the reaction probability. Combust Flame. 2004;138:353–361. [Google Scholar]
- 16.Lelievre S, et al. Heterogeneous reaction of ozone with hydrocarbon flame soot. Phys Chem Chem Phys. 2004;6:1181–1191. [Google Scholar]
- 17.Nienow AM, Roberts JT. Heterogeneous chemistry of carbon aerosols. Annu Rev Phys Chem. 2006;57:105–128. doi: 10.1146/annurev.physchem.57.032905.104525. [DOI] [PubMed] [Google Scholar]
- 18.Longfellow CA, Ravishankara AR, Hanson DR. Reactive and nonreactive uptake on hydrocarbon soot: HNO3, O3, and N2O5. J Geophys Res Atmos. 2000;105:24345–24350. [Google Scholar]
- 19.Chughtai AR, Kim JM, Smith DM. The effect of temperature and humidity on the reaction of ozone with combustion soot: Implications for reactivity near the tropopause. J Atmos Chem. 2003;45:231–243. [Google Scholar]
- 20.Gao RS, Karcher B, Keim ER, Fahey DW. Constraining the heterogeneous loss of O3 on soot particles with observations in jet engine exhaust plumes. Geophys Res Lett. 1998;25:3323–3326. [Google Scholar]
- 21.Sander SP, et al. Chemical kinetics and photochemical data for use in atmospheric modeling, JPL06–02. Pasadena, CA: Jet Propulsion Laboratory; 2006. [Google Scholar]
- 22.Garcia RR, Marsh DR, Kinnison DE, Boville BA, Sassi F. Simulation of secular trends in the middle atmosphere, 1950–2003. J Geophys Res Atmos. 2007 doi: 10.1029/2006JD007485. [DOI] [Google Scholar]
- 23.Lin SJ, Rood RB. An explicit flux-form semi-Lagrangian shallow-water model on the sphere. Q J R Meteor Soc. 1997;123:2477–2498. [Google Scholar]
- 24.Brasseur GP, et al. MOZART, a global chemical transport model for ozone and related chemical tracers. 1. Model description. J Geophys Res Atmos. 1998;103:28265–28289. [Google Scholar]
- 25.Hauglustaine DA, et al. MOZART, a global chemical transport model for ozone and related chemical tracers 2. Model results and evaluation. J Geophys Res Atmos. 1998;103:28291–28335. [Google Scholar]
- 26.Horowitz LW, et al. A global simulation of tropospheric ozone and related tracers: Description and evaluation of MOZART, version 2. J Geophys Res Atmos. 2003 doi: 10.1029/2002JD002853. [DOI] [Google Scholar]
- 27.Forkman P, Eriksson P, Winnberg A, Garcia RR, Kinnison D. Longest continuous ground-based measurements of mesospheric CO. Geophys Res Lett. 2003 doi: 10.1029/2003GL016931. [DOI] [Google Scholar]
- 28.Park M, Randel WJ, Kinnison DE, Garcia RR, Choi W. Seasonal variation of methane, water vapor, and nitrogen oxides near the tropopause: Satellite observations and model simulations. J Geophys Res Atmos. 2004 doi: 10.1029/2003JD003706. [DOI] [Google Scholar]
- 29.Sassi F, Garcia RR, Boville BA, Liu H. On temperature inversions and the mesospheric surf zone. J Geophys Res Atmos. 2002 doi: 10.1029/2001JD001525. [DOI] [Google Scholar]
- 30.Gettelman A, Kinnison DE, Dunkerton TJ, Brasseur GP. Impact of monsoon circulations on the upper troposphere and lower stratosphere. J Geophys Res Atmos. 2004 doi: 10.1029/2004JD004878. [DOI] [Google Scholar]
- 31.Mcfarlane NA. The effect of orographically excited gravity-wave drag on the general-circulation of the lower stratosphere and troposphere. J Atmos Sci. 1987;44:1775–1800. [Google Scholar]
- 32.Turco RP, Hamill P, Toon OB, Whitten RC, Kiang CS. A one-dimensional model describing aerosol formation and evolution in the stratosphere. I. Physical processes and mathematical analogs. J Atmos Sci. 1979;36:699–717. [Google Scholar]
- 33.Toon OB, Turco RP, Hamill P, Kiang CS, Whitten RC. A one dimensional model describing aerosol formation and evolution in the stratosphere. II. Sensitivity studies and comparison with observations. J Atmos Sci. 1979;36:718–736. [Google Scholar]
- 34.Toon OB, Turco RP, Westphal D, Malone R, Liu MS. A multi-dimensional model for aerosols: Description of computational analogs. J Atmos Sci. 1988;45:2123–2143. [Google Scholar]
- 35.Hess M, Koepke P, Schult I. Optical properties of aerosols and clouds: The software package OPAC. Bull Am Meteor Soc. 1998;79:831–844. [Google Scholar]


