

Abstract
Aims
To determine the prevalence and usage patterns of prescription drugs according to patients' age and gender, and to identify their relative importance in the prescription costs, in primary health care within the Catalan Health Institute.
Methods
This was a cross-sectional study using computerized pharmacy dispensing records for 5 474 274 members registered, during 2002. Twenty age-gender categories were established. Use of a drug group was defined as filling at least one prescription. The variables studied were age, gender, number of prescriptions and net cost. The prevalence of use, the number of prescriptions and cost issued to each age category were reported.
Results
The overall prevalence of drug use was 74.53% (women 80.93%, men 67.84%). This was higher in the group of 0–4 year-olds, and in the ≥ 55 year-olds. Age (P < 0.001) produced a statistically more significant effect than gender (P < 0.05). The most used therapeutic groups were analgesics, nonsteroidal anti-inflammatory drugs, antiulcer drugs, anxiolytics, expectorants and mucolytics. The number of prescriptions and costs per patient rose with age and showed great variation in the use of these groups for patients in different age groups. The risk of prescription in women was 23% higher than in men (RR 1.23, 95% CI 1.11, 1.37, P < 0.001).
Conclusions
The majority of subjects were exposed to one or more drugs. The variability in the number of prescriptions and in the prescribing cost per patient between the different age groups suggests that adjustments should be made for age in practitioners' prescription evaluation processes in primary health care in Catalonia.
What is already known about this subject
Knowledge of prescription patterns in primary health care is an important tool in rational drug therapy.
Age and gender are the principal determining factors of cost variability between medical practices, due to drug prescriptions.
Age and gender are the principal determining factors of cost variability in relation to the therapeutic group.
What this study adds
This study provides specific information on the use of drugs in the primary health care environment of the Catalan Health System, and the differences observed are analyzed with respect to age and gender of the population receiving care.
The study shows that there is a high prevalence of drugs in the under 5 year old age group, and also in persons over 54 years of age.
The variability found in the cost per patient suggests that adjustment should be made for age in practitioners' prescription evaluation procedures in primary health care in Catalonia.
Keywords: age, cost, drug use, gender, prevalence, primary health care
Introduction
The result of the studies analyzing the influence of age and gender on drug prescription in primary health care show that these factors condition the prescription patterns [1–6] and, subsequently, also their cost [4–6]. Thus, prescriptions adjusted for age and gender explain around 35% of cost variations between medical practices [4], and up to 66% in the case of analysis of the therapeutic groups [4, 6].
Some very interesting research has been carried out in the United Kingdom regarding attempts made to establish a unit of measurement that would make it possible to assess the effect of age and gender on the evaluation of prescriptions for drugs in the primary health care environment, or in setting budgets for pharmacy [4–6]. In this research, the demographic weightings (age, gender and temporary residence) were evaluated with respect to the costs of the drug prescription. Its results contributed to improvements in, among other things, the analysis and comparison of prescription-derived costs between doctors and the setting of budgets for pharmacy in the health services [7].
Thus, a knowledge of prescription patterns is important for improving, evaluating, and making adjustments to drug therapies [1]. However, no recent articles in the literature describe in any detail the ways in which drugs are used differently across age groups and between genders.
In 1981, the central Spanish authorities transferred their responsibility for managing the National Health Service to the autonomous community of Catalonia, which in its turn established the Catalan Health Service in 1991. Today this acts as the public health care provider in Catalonia, guaranteeing the provision of health services to the public [8].
In October 2001, the Catalan Health Service made it obligatory to take a computerized reading of a user's personal health care card in local pharmacies when dispensing drugs prescribed by a doctor. This has enabled the Catalan Health Service, for the first time, to correlate the drugs prescribed with their users, which, among other benefits, has helped reduce the imprecision of previous methods for assigning resources to populations of medical practitioners [9].
The aims of this study were: (i) to determine the prevalence of prescription drug use according to age and gender groups, (ii) to describe the patterns of prescription drug use, and (iii) to identify the relative importance of age and gender in drug prescription costs, in the primary health care environment of Catalonia (Spain). With this information it should be possible to introduce changes aimed at improving the evaluation processes of prescription in primary health care practices within the Catalan Health Service.
Methods
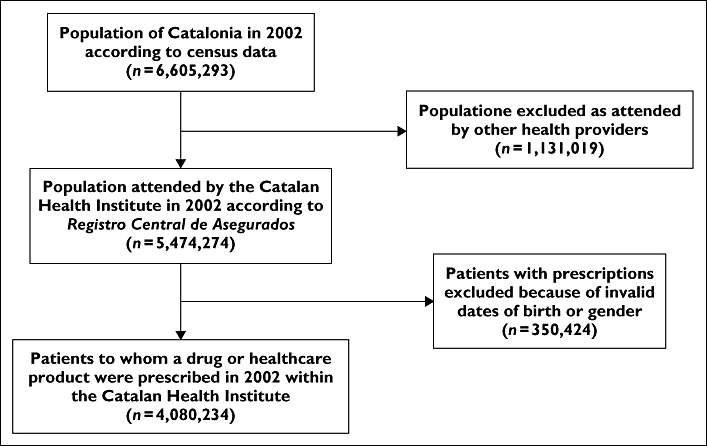
Catalonia is an autonomous region of Spain with a population of 6 605 293 inhabitants, according to the 2002 census [10]. The Catalan Health Service works with different health service providers, of which the Catalan Health Institute is the main one [11]. The Institute manages more than 78% of the Primary Health Care Teams, which deliver their services to approximately 82% of Catalan citizens, that is, more than 5.4 million people. All people registered therefore were covered by Catalan Health Service.
An observational cross-sectional study was carried out in a primary health care environment of the Catalan Health Institute. The study population comprised the registers of patients for whom a drug or product had been prescribed in the centres of the Catalan Health Institute and dispensed at the cost of the financing body, the Catalan Health Service. In this paper, the term ‘prescribed’ refers to prescriptions that have been dispensed in pharmacies.
The study period was from 1 January to 31 December 2002. Prescriptions were dispensed through community pharmacies operating within the scheme, while a computer system processed pharmacist's claims which, in addition to providing details of each prescription (name of the drug, dose, formulation), also contain demographic data on patients, including their age and gender. Patient records were linked using a single personal identification code, included in the personal health care card. The data collection procedure involved the computerized reading of the personal identification code and the digitalization of the prescription data. The data for the present analyses were obtained from two sources. One was the Catalan Health Service's pharmacy administrative database for publicly financed drugs, which holds all official information. The second, also an official information database, was the Registro Central de Asegurados provided by the Catalan Health Service.
The variables studied here were (i) patient data: age and gender; and (ii) prescription data: number of prescriptions and net cost. All data provided were in an aggregated, anonymous form. Twenty age-gender categories were defined (0–4 years, then 5–14, 15–24 and so on for 10 year intervals up to 84 years with the last group comprising those aged 85 years or older). These age groups coincided with those used in earlier studies [4–6] so that a comparative analysis of the results obtained could be undertaken. All prescriptions were coded according to the World Health Organization (WHO) Anatomical Therapeutic Chemical (ATC) classification system [12].
A flow diagram showing the population of Catalonia and its population served by the Catalan Health Institute is included in the Appendix 1. Importantly, of the total population of Catalonia in 2002 the percentage over 64 years old was 17.3% (men 14.6%, women 19.8%), most living in an urban environment.
The average number of persons registered in the Registro Central de Asegurados (including those without a prescription in 2002) was used as the estimate of the total number of persons in 2002 and was calculated according to age group and gender. Using this average, the prevalence period was defined and was calculated by age group and by gender separately [1, 4]. The population registered within the Catalan Health Institute (n = 5 474 274) was used as the denominator.
Use of a drug was defined as the invoicing for a patient for at least one drug or healthcare product during the study period. A descriptive analysis of the prescriptions was then carried out for all the patients, stratified by age and gender groups. The proportion of males and females that used each therapeutic group was calculated, and the 15 therapeutic groups used most frequently were reported for each age category [2]. The data collected from the practices were analyzed to produce the average number of prescriptions per patient and the average cost per patient.
The pharmacy administrative database included all patients to whom a drug or a healthcare product had been dispensed. The groups were compared by using analysis of variance adjusted for age and gender. Poisson regression models were used to estimate the relative risk of number of prescriptions per patients registered adjusted for gender and age. The over-dispersed Poisson regression model was fitted scaling the standard errors by the Pearson statistic. Multivariable regression analyses were used to investigate the association between the average cost per patient and age and gender. All statistical tests were two-sided at the 5% significance level. All analyses were carried out using the SPSS statistical software package, version 10.1 and Stata/SE version 9.1 (Stata Corp.).
Results
Of the 4 080 234 patients who were identified as users of drugs and healthcare products during the study period, 55.5% were women. Of the total population registered, 74.53% used at least one drug. On the whole, women used more drugs than men (80.93% vs. 67.84%), except in the 0–4 and 5–14 age bands, where the percentage use was higher in males. The age bands with the highest recorded use were the 0–4 year olds, with percentages of 84.67% for boys and 81.08% for girls, and the over 54 year old groups (55–64, 65–74, 75–84 and ≥ 85 years), which recorded percentages of 100%, with the exception of the men in the 55–64 age band, where the percentage was 85.44% and in the ≥ 85 years age group, where the percentage was 90.81%.
The prevalence of patients with one or more prescription drugs, together with the therapeutic groups most frequently used in each age group by gender, are shown in Table 1. A more statistically significant age effect (F = 15.26, P < 0.001) than gender (F = 9.78, P < 0.05) was observed on the prevalence of patients with one or more prescription drugs when considering total age-gender group.
Table 1.
Prevalence of therapeutic groups used most frequently by males and females in each age category
| Males | Females | |||
|---|---|---|---|---|
| Age group (years) | Drug group | % of patients ≥1 prescription1 | Drug group | % of patients ≥1 prescription1 |
| 0–4 | Total age-gender group§ | 84.7 | Total age-gender group§ | 81.1 |
| Other analgesics and antipyretics | 33.6 | Other analgesics and antipyretics | 32.3 | |
| Cough suppressants | 30.6 | Cough suppressants | 31.1 | |
| Amoxicillin + clavulanate | 28.9 | Amoxicillin + clavulanate | 27.3 | |
| Adrenergics, inhalants | 25.0 | Expectorants and mucolytics | 23.5 | |
| Expectorants and mucolytics | 24.6 | Penicillins | 23.3 | |
| NSAIDs2 | 24.6 | NSAIDs2 | 23.1 | |
| Penicillins | 24.1 | Adrenergics, inhalants | 21.1 | |
| Macrolides | 19.2 | Antihistamines for systemic use | 18.0 | |
| Antihistamines for systemic use | 18.2 | Macrolides | 17.9 | |
| Cephalosporins | 17.4 | Cephalosporins | 16.4 | |
| Ophthalmologicals, anti-infectives | 14.8 | Ophthalmologicals, anti-infectives | 13.8 | |
| Corticosteroids for topical use | 13.2 | Corticosteroids for topical use | 11.2 | |
| Corticosteroids for systemic use | 9.6 | Antifungals for topical use | 8.9 | |
| Antifungals for topical use | 7.1 | Corticosteroids for systemic use | 7.3 | |
| Inhaler devices | 6.3 | Inhaler devices | 5.5 | |
| 5–14 | Total age-gender group§ | 65.6 | Total age-gender group§ | 65.5 |
| NSAIDs2 | 23.2 | NSAIDs2 | 24.6 | |
| Other analgesics and antipyretics | 21.5 | Other analgesics and antipyretics | 21.5 | |
| Cough suppressants | 20.6 | Cough suppressants | 20.9 | |
| Penicillins | 15.7 | Penicillins | 16.4 | |
| Amoxicillin + clavulanate | 15.0 | Amoxicillin + clavulanate | 15.4 | |
| Expectorants and mucolytics | 13.8 | Expectorants and mucolytics | 13.6 | |
| Macrolides | 11.2 | Macrolides | 11.4 | |
| Adrenergics, inhalants | 10.4 | Antihistamines for systemic use | 10.0 | |
| Antihistamines for systemic use | 9.9 | Adrenergics, inhalants | 8.0 | |
| Cephalosporins | 6.7 | Cephalosporins | 7.5 | |
| Corticosteroids for topical use | 5.4 | Corticosteroids for topical use | 5.4 | |
| Antibiotics for topical use | 3.6 | Antifungals for topical use | 3.3 | |
| Antifungals for topical use | 3.1 | Antibiotics for topical use | 3.3 | |
| Ophthalmologicals, anti-infectives | 3.1 | Ophthalmologicals, anti-infectives | 3.0 | |
| Descongestants and other nasal preparations for topical use | 2.7 | Antiemetics and antinauseants | 2.5 | |
| 15–24 | Total age-gender group§ | 54.3 | Total age-gender group§ | 67.1 |
| Other analgesics and antipyretics | 20.9 | NSAIDs2 | 24.8 | |
| NSAIDs2 | 17.9 | Other analgesics and antipyretics | 24.3 | |
| Penicillins | 9.9 | Penicillins | 12.0 | |
| Amoxicillin + clavulanate | 9.9 | Amoxicillin + clavulanate | 11.5 | |
| Cough suppressants | 7.5 | Antihistamines for systemic use | 9.8 | |
| Expectorants and mucolytics | 7.1 | Cough suppressants | 9.6 | |
| Antihistamines for systemic use | 7.0 | Expectorants and mucolytics | 8.7 | |
| Macrolides | 6.1 | Macrolides | 7.4 | |
| Adrenergics, inhalants | 4.4 | Antiemetics and antinauseants | 5.9 | |
| Antiemetics and antinauseants | 3.4 | Anxiolytics | 5.5 | |
| Antifungals for topical use | 3.3 | Corticosteroids for topical use | 5.0 | |
| Drugs for treatment of peptic ulcer | 3.1 | Adrenergics, inhalants | 4.7 | |
| Anxiolytics | 2.9 | Iron preparations | 4.7 | |
| Corticosteroids for topical use | 2.8 | Drugs for treatment of peptic ulcer | 4.4 | |
| Descongestants and other nasal preparations for topical use | 2.8 | Antifungals for topical use | 4.3 | |
| 25–34 | Total age-gender group§ | 50.2 | Total age-gender group§ | 67.8 |
| Other analgesics and antipyretics | 17.2 | NSAIDs2 | 23.3 | |
| NSAIDs2 | 16.6 | Other analgesics and antipyretics | 22.6 | |
| Amoxicillin + clavulanate | 7.5 | Amoxicillin + clavulanate | 9.9 | |
| Penicillins | 6.8 | Penicillins | 9.8 | |
| Antihistamines for systemic use | 6.3 | Antihistamines for systemic use | 9.1 | |
| Expectorants and mucolytics | 5.2 | Anxiolytics | 9.0 | |
| Drugs for treatment of peptic ulcer | 5.2 | Iron preparations | 8.6 | |
| Cough suppressants | 5.1 | Cough suppressants | 8.0 | |
| Anxiolytics | 5.1 | Expectorants and mucolytics | 7.9 | |
| Macrolides | 4.8 | Antidepressants | 6.7 | |
| Antifungals for topical use | 3.3 | Macrolides | 6.7 | |
| Antiemetics and antinauseants | 3.3 | Folic acid and derivatives | 6.3 | |
| Adrenergics, inhalants | 3.3 | Antiemetics and antinauseants | 6.2 | |
| Antidepressants | 3.2 | Drugs for treatment of peptic ulcer | 6.1 | |
| Corticosteroids for topical use | 3.2 | Corticosteroids for topical use | 4.9 | |
| 35–44 | Total age-gender group§ | 53.1 | Total age-gender group§ | 69.1 |
| NSAIDs2 | 18.4 | NSAIDs2 | 27.5 | |
| Other analgesics and antipyretics | 17.7 | Other analgesics and antipyretics | 23.5 | |
| Amoxicillin + clavulanate | 7.7 | Anxiolytics | 14.2 | |
| Drugs for treatment of peptic ulcer | 7.6 | Antidepressants | 10.9 | |
| Anxiolytics | 7.2 | Antihistamines for systemic use | 9.7 | |
| Penicillins | 6.6 | Amoxicillin + clavulanate | 9.6 | |
| Expectorants and mucolytics | 6.2 | Expectorants and mucolytics | 9.4 | |
| Antihistamines for systemic use | 6.1 | Penicillins | 9.3 | |
| Cough suppressants | 5.6 | Drugs for treatment of peptic ulcer | 9.2 | |
| Macrolides | 5.3 | Cough suppressants | 8.8 | |
| Antidepressants | 4.5 | Iron preparations | 7.5 | |
| Corticosteroids for topical use | 3.6 | Macrolides | 7.5 | |
| Adrenergics, inhalants | 3.6 | Corticosteroids for topical use | 5.6 | |
| Antifungals for topical use | 3.4 | Adrenergics, inhalants | 5.5 | |
| NSAIDs2 for topical use | 3.2 | Muscle relaxants, centrally acting agents | 5.4 | |
| 45–54 | Total age-gender group§ | 64.5 | Total age-gender group§ | 84.2 |
| NSAIDs2 | 22.6 | NSAIDs2 | 38.2 | |
| Other analgesics and antipyretics | 21.0 | Other analgesics and antipyretics | 31.9 | |
| Drugs for treatment of peptic ulcer | 12.6 | Anxiolytics | 22.3 | |
| Anxiolytics | 10.3 | Drugs for treatment of peptic ulcer | 16.9 | |
| Cholesterol and triglyceride reducers | 8.9 | Antidepressants | 16.7 | |
| Amoxicillin + clavulanate | 8.0 | Expectorants and mucolytics | 12.0 | |
| Expectorants and mucolytics | 7.9 | Antihistamines for systemic use | 11.8 | |
| Agents acting on the renin-angiotensin system | 7.3 | Cough suppressants | 10.9 | |
| Penicillins | 7.1 | NSAIDs2 for topical use | 10.6 | |
| Antihistamines for systemic use | 6.6 | Penicillins | 10.6 | |
| Cough suppressants | 6.4 | Amoxicillin + clavulanate | 10.4 | |
| Antidepressants | 6.2 | Macrolides | 8.5 | |
| Macrolides | 5.7 | Corticosteroids for topical use | 8.2 | |
| NSAIDs2 for topical use | 5.4 | Iron preparations | 7.6 | |
| Adrenergics, inhalants | 5.1 | Antiemetics and antinauseants | 7.5 | |
| 55–64 | Total age-gender group§ | 85.4 | Total age-gender group§ | 100.0 |
| Other analgesics and antipyretics | 32.6 | NSAIDs2 | 47.4 | |
| NSAIDs2 | 31.3 | Other analgesics and antipyretics | 48.0 | |
| Drugs for treatment of peptic ulcer | 21.6 | Anxiolytics | 30.0 | |
| Cholesterol and triglyceride reducers | 18.0 | Drugs for treatment of peptic ulcer | 28.2 | |
| Agents acting on the renin-angiotensin system | 17.0 | Antidepressants | 20.5 | |
| Anxiolytics | 15.6 | NSAIDs2 for topical use | 20.1 | |
| Expectorants and mucolytics | 13.6 | Cholesterol and triglyceride reducers | 19.8 | |
| Vasodilators used in cardiac diseases and selective calcium channel blockers | 11.3 | Expectorants and mucolytics | 17.5 | |
| NSAIDs2 for topical use | 11.2 | Agents acting on the renin-angiotensin system | 17.4 | |
| Amoxicillin + clavulanate | 11.0 | Cough suppressants | 15.9 | |
| Adrenergics, inhalants | 10.6 | Calcium | 15.1 | |
| Cough suppressants | 10.3 | Antihistamines for systemic use | 13.7 | |
| Penicillins | 9.9 | Penicillins | 13.2 | |
| Antidepressants | 8.7 | Capillary stabilizing agents | 12.6 | |
| Corticosteroids for topical use | 8.6 | Amoxicillin + clavulanate | 12.6 | |
| 65–74 | Total age-gender group§ | 100.0 | Total age-gender group§ | 100.0 |
| Other analgesics and antipyretics | 48.3 | Other analgesics and antipyretics | 56.6 | |
| NSAIDs2 | 38.2 | NSAIDs2 | 48.7 | |
| Drugs for treatment of peptic ulcer | 33.1 | Drugs for treatment of peptic ulcer | 36.4 | |
| Agents acting on the renin-angiotensin system | 26.2 | Anxiolytics | 32.7 | |
| Cholesterol and triglyceride reducers | 25.1 | NSAIDs2 for topical use | 30.2 | |
| NSAIDs2 for topical use | 22.2 | Cholesterol and triglyceride reducers | 27.0 | |
| Expectorants and mucolytics | 22.1 | Agents acting on the renin-angiotensin system | 25.8 | |
| Vasodilators used in cardiac diseases and selective calcium channel blockers | 21.7 | Expectorants and mucolytics | 20.1 | |
| Anxiolytics | 21.0 | Antidepressants | 19.4 | |
| Adrenergics, inhalants | 19.6 | Vasodilators used in cardiac diseases and selective calcium channel blockers | 18.3 | |
| Platelet aggregation inhibitors excluding heparin | 17.0 | Cough suppressants | 17.5 | |
| Other urolgicals, including antispasmodics | 16.9 | Calcium | 17.2 | |
| Cough suppressants | 15.5 | Capillary stabilizing agents | 16.9 | |
| Corticosteroids for topical use | 14.0 | Corticosteroids for topical use | 15.4 | |
| Amoxicillin + clavulanate | 13.9 | Adrenergics, inhalants | 14.6 | |
| 75–84 | Total age-gender group§ | 100.0 | Total age-gender group§ | 100.0 |
| Other analgesics and antipyretics | 49.6 | Other analgesics and antipyretics | 57.2 | |
| Drugs for treatment of peptic ulcer | 37.0 | NSAIDs2 | 42.0 | |
| NSAIDs2 | 34.5 | Drugs for treatment of peptic ulcer | 38.2 | |
| Agents acting on the renin-angiotensin system | 28.0 | Anxiolytics | 33.9 | |
| Vasodilators used in cardiac diseases and selective calcium channel blockers | 27.6 | NSAIDs2 for topical use | 32.0 | |
| NSAIDs2 for topical use | 25.1 | Agents acting on the renin-angiotensin system | 30.0 | |
| Expectorants and mucolytics | 24.8 | Vasodilators used in cardiac diseases and selective calcium channel blockers | 25.0 | |
| Adrenergics, inhalants | 24.7 | Cholesterol and triglyceride reducers | 22.2 | |
| Platelet aggregation inhibitors excluding heparin | 24.4 | Antidepressants | 20.3 | |
| Anxiolytics | 23.8 | Expectorants and mucolytics | 19.5 | |
| Other urologicals, including antispasmodics | 20.6 | Capillary stabilizing agents | 17.8 | |
| Cholesterol and triglyceride reducers | 20.2 | Platelet aggregation inhibitors excluding heparin | 17.4 | |
| Peripheral vasodilators | 15.8 | Peripheral vasodilators | 16.3 | |
| High-ceiling diuretics | 14.6 | Calcium | 16.0 | |
| Cough suppressants | 14.4 | Adrenergics, inhalants | 15.9 | |
| ≥85 | Total age-gender group§ | 90.8 | Total age-gender group§ | 100.0 |
| Other analgesics and antipyretics | 44.4 | Other analgesics and antipyretics | 55.3 | |
| Drugs for treatment of peptic ulcer | 32.9 | Drugs for treatment of peptic ulcer | 36.2 | |
| Platelet aggregation inhibitors excluding heparin | 25.5 | Urinary incontinence absorbents | 34.3 | |
| NSAIDs2 | 25.0 | Anxiolytics | 31.6 | |
| Expectorants and mucolytics | 24.0 | NSAIDs2 | 30.6 | |
| Vasodilators used in cardiac diseases and selective calcium channel blockers | 23.4 | Agents acting on the renin-angiotensin system | 27.1 | |
| Adrenergics, inhalants | 22.7 | NSAIDs2 for topical use | 26.8 | |
| Anxiolytics | 21.9 | Vasodilators used in cardiac diseases and selective calcium channel blockers | 24.9 | |
| Agents acting on the renin-angiotensin system | 21.1 | Platelet aggregation inhibitors excluding heparin | 23.5 | |
| NSAIDs2 for topical use | 20.9 | High-ceiling diuretics | 23.5 | |
| High-ceiling diuretics | 20.3 | Expectorants and mucolytics | 21.0 | |
| Urine incontinence absorbents | 19.0 | Laxatives | 19.4 | |
| Peripheral vasodilators | 18.6 | Peripheral vasodilators | 19.0 | |
| Laxatives | 17.5 | Antidepressants | 17.4 | |
| Other urologicals, including antispasmodics | 17.4 | Adrenergics, inhalants | 16.7 | |
| Total male group | 67.8 | Total female group | 80.9 | |
Proportions do not add up to 100% because patients can be counted in more than one group.
NSAIDs: nonsteroidal anti-inflammatory drugs.
Total age-gender group: prevalence of patients with one or more prescription drugs of the total registered patients in each age group by gender. Two-way analyses of variance adjusted for gender and age of total age-gender group: F = 14.72, P < 0.001.
Table 2 shows the 15 most used therapeutic groups by males and females. They included analgesics, nonsteroidal anti-inflammatory drugs (NSAIDs), antiulcer drugs, anxiolytics, expectorants and mucolytics, cough suppressants, amoxicillin-clavulanate, penicillins, NSAIDs for topical use and antihistamines for systemic use. A highly significant effect of both gender (F = 22.58, P < 0.001) and therapeutic group (F = 20.04, P < 0.0001) was observed on the prevalence of patients with one or more prescriptions.
Table 2.
Prevalence of the 15 therapeutic groups used most frequently by males and females§
| Drug group | Males % of patients ≥1 prescription1 | Females % of patients ≥1 prescription1 | Total % of patients ≥1 prescription1 |
|---|---|---|---|
| Other analgesics and antipyretics | 26.19 | 34.70 | 30.54 |
| NSAIDs2 | 23.50 | 33.15 | 28.44 |
| Drugs for treatment of peptic ulcer | 12.30 | 16.40 | 14.40 |
| Anxiolytics | 9.47 | 17.84 | 13.75 |
| Expectorants and mucolytics | 11.51 | 13.58 | 12.57 |
| Cough suppressants | 10.39 | 13.30 | 11.88 |
| Amoxicillin + clavulanate | 11.02 | 11.96 | 11.50 |
| Penicillins | 9.82 | 11.66 | 10.76 |
| NSAIDs2 for topical use | 7.27 | 12.21 | 9.80 |
| Antihistamines for systemic use | 8.11 | 10.87 | 9.52 |
| Adrenergics, inhalants | 9.19 | 9.13 | 9.16 |
| Macrolides | 7.94 | 9.56 | 8.77 |
| Antidepressants | 5.15 | 11.74 | 8.52 |
| Agents acting on the renin-angiotensin system | 7.57 | 9.25 | 8.43 |
| Cholesterol and triglyceride reducers | 7.28 | 8.42 | 7.86 |
Proportions do not add up to 100% because patients can be counted in more than one group.
NSAIDs: nonsteroidal anti-inflammatory drugs.
Two-way analyses of variance adjusted for gender and therapeutic groups: F = 20.21, P < 0.0001.
Our analysis of the number of prescriptions per patient according to age during the year 2002 revealed a general increasing tendency, i.e. the older the patient, the greater the number of prescriptions. When considering the total number of prescriptions per patient, an average of 14.5 prescriptions per patient was recorded, with a range of 3.4–46.0, by age group. The number of prescriptions per patient registered, adjusting for age and gender, is shown in Table 3. The risk of prescriptions for females was significantly higher (RR 1.23, 95% CI 1.11, 1.37, P < 0.001) than males adjusting for age. The number of prescriptions per patient registered differed across the age bands with a small peak in patients under 5 years of age. The groups of 5–14 year olds and 15–24 year olds presented a significantly lower risk (43%) than the reference group (0–4 years) and after the age of 44 years the risk increased with age, presenting a substantial increase with age (from 1.96 times to 7.83 times), which was shown to be statistically significant (P < 0.001).
Table 3.
Number of prescriptions per patient registered adjusting for age and gender. Poisson regression
| Age group (years) | RR (95% CI) | P value |
|---|---|---|
| 0–4 as reference | ||
| 5–14 | 0.57 (0.33, 0.98) | 0.041 |
| 15–24 | 0.57 (0.34, 0.95) | 0.030 |
| 25–34 | 0.68 (0.43, 1.08) | 0.106 |
| 35–44 | 0.99 (0.63, 1.56) | 0.984 |
| 45–54 | 1.96 (1.27, 3.02) | 0.01 |
| 55–64 | 4.04 (2.66, 6.13) | 0.001 |
| 65–74 | 6.57 (4.36, 9.90) | 0.001 |
| 75–84 | 7.84 (5.19, 11.84) | 0.001 |
| ≥85 | 7.49 (4.84, 11.60) | 0.001 |
| Gender (male as reference) | 1.23 (1.10, 1.37) | 0.001 |
RR, Relative risk; CI, Confidence interval.
The average cost per prescription was 12.37 €, with a range from 5.51 to 13.50 €, by age group. The estimated average cost per patient was 180.45 €. The prescription cost for each patient aged 65 years or over was 6.54 times higher than that of a patient under 65 years (men: 7.59 times with respect to men <65 years, women: 5.74 times with respect to women <65 years). Costs per patient were observed to increase with age. Thus, patients in the 65–74 year, 75–84 year and over 84 year bands were found to represent costs that were 16.1, 19.7 and 18.8 times higher than those of the reference group (0–4 years).
Table 4 shows the costs per patient adjusting for age and gender. In the case of age, with the 0–4 year olds as a reference, there were no statistically significant differences between the age groups until the 35–44 year age band, while highly significant differences were found after this age group (P < 0.001). The group presenting the greatest costs with respect to those of the reference group was the 75–84 years olds (595 € more per patient). In the case of gender, there were no statistical significant differences between men and women (P = 0.37).
Table 4.
Cost per patient (€) adjusting for age and gender. Linear regression
| Age group (years) | β Coefficient (95% CI) | P value |
|---|---|---|
| 0–4 as reference | ||
| 5–14 | 0.42 (−52.43, 53.27) | 0.986 |
| 15–24 | 0.37 (−52.48, 53.22) | 0.988 |
| 25–34 | 10.49 (−42.36, 63.34) | 0.664 |
| 35–44 | 32.83 (−20.01, 85.68) | 0.193 |
| 45–54 | 90.42 (37.57, 143.27) | 0.001 |
| 55–64 | 246.71 (193.86, 299.56) | 0.001 |
| 65–74 | 476.85 (424.00, 529.70) | 0.001 |
| 75–84 | 594.99 (542.15, 647.85) | 0.001 |
| ≥85 | 555.84 (502.99, 608.69) | 0.001 |
| Gender (male as reference) | 9.95 (−13.68, 33.58) | 0.366 |
CI, Confidence interval.
In children aged 0–14 years (age bands 0–4 years and 5–14 years), anti-infectious and respiratory therapy accounted for the highest costs. However, after the age of 74 (age groups 75–84 years and ≥ 85 years), the highest costs in men were attributable to the genitourinary system and sex hormones, antineoplastic agents and treatments related to the respiratory system.
Discussion
The overall prevalence of drug use in our study was approximately 74.5% of the population registered. This is a particularly relevant piece of data, as there have been few studies within the Catalan Health Institute providing such information. Varying drug use prevalence rates have been reported in previous studies (45%, 67% and 78%) [13–15], which is partly explained by differences in the methodology adopted. Thus, the lowest rate of prevalence, reported by Del Rio et al.[13], would seem to reflect the fact that the patients surveyed were asked only about certain classes of drugs, and the fact that the study was conducted over 13 years ago. The other two studies, which report results more similar to ours, only included patients aged between 25 and 64 years [14] and aged over 64 years [15], respectively.
In our population, there was a slightly higher overall proportion of women (51.15%). This proportion was notably higher in the 65–74, 75–84 and over 84 year age bands, with respective proportions of 55.0, 60.7 and 67.9%.
In common with the other studies [13–15], a higher prevalence of drug use was observed in women, except in the 0–4 and 5–14 year bands. This result is unsurprising if we consider that a higher number of women consider themselves as suffering poor health [14, 16] and as presenting greater morbidity [13], which suggests they are likely to make more visits to their doctor and hence there is a greater probability of a diagnosis being made [14].
The therapeutic groups that were most prescribed (analgesics, NSAIDs, penicillins, antiulcer drugs and anxiolytics) were in line with descriptions elsewhere [14]. The prevalence of analgesic use with regard to gender was lower than that reported by Sans et al.[14] (men 26.19% vs. 36%, women 34.70% vs. 44%, respectively). However, the prevalence of analgesics and NSAIDs observed in our study might be lower than actual levels, as over-the-counter medication was not included [1, 17].
Similarly, the rate of coamoxyclav, as a percentage of total prescribing, was relatively high. Although our database did not include information about the indications for which these antibacterial agents were prescribed, caution should be observed when using these agents, based on increasing reports of antimicrobial resistance [18].
Overall, 13.75% of the patients registered used anxiolytics, with their use being reported as higher among women. In the age group 55–64 years and in the following age bands (65–74, 75–84 and ≥ 85 years), the prevalence of use among women was found to be over 30%, slightly lower than the result reported by van Hulten et al.[19] based on 8 years of observations (33%).
In the case of the 0–4 year age band, a high use of analgesics, penicillins, cough suppressants, expectorants and bronchodilators was found, similar to other studies [1, 20]. This could be explained by the prevalence at these ages of acute respiratory infections (59%), secretory otitis media (39%), tonsillitis (30%), and bronchiolitis (25%) [21]. The more frequent use of bronchodilators in children was associated with the higher prevalence of acute bronchiolitis [21]. In this age group, a significant feature is the high use of second-generation penicillins (amoxicillin/clavulanate), second-generation macrolides, and cephalosporins, which were reported at 28%, 19% and 17%, respectively. Very similar results were described by Sanz et al.[22] in children from Barcelona (28.9% for amoxicillin/clavulanate and 18.3% for macrolides).
The most prevalent therapeutic groups for the age group 5–14 years were the NSAIDs, analgesics, cough suppressants and penicillins. These results, comparable with those obtained by Schirm et al.[1], could be explained by the prevalence of the following pathologies in this age group: acute respiratory infection (38%), tonsillitis (23%), dental pathology (12.6%), secretory otitis media (12%) and acute bronchiolitis (8%) [21].
Up to 14 years of age, an important feature was the high use of antibiotics, which was much higher than in other countries, such as Scotland [23], which could indicate problems of overuse and of choice, which have been noted in other studies [24–26].
Our findings regarding drug use trends in children, highest among infants, decreasing until adolescence and increasing thereafter, were also comparable with reports made in other studies [1, 13]. This probably reflects the higher rates of medical visits in this age group, and the increased susceptibility to infections, the more severe course of infections, and greater parental and physician anxiety than in older children [20].
In the 15–24 year age band, it was observed that 1.4 times more women than men were prescribed an NSAID. In 4.7% of the women we recorded the use of iron supplementation, probably due to specific female conditions, such as menstruation.
Likewise, in the 25–34 year age band, the use of NSAIDs and analgesics was higher among women, as reported also by Roe et al.[2]. This is probably associated with the higher prevalence in women of disorders such as dysmenorrhoea and migraine [27]. Similarly, coinciding once more with observations made by Roe et al.[2], women in this age group used twice as many antidepressives as men.
In the 35–44 year age band, a different drug use profile was observed according to gender, which, in the case of women also occurred in the preceding age groups. A notable feature, again one reported by Roe et al.[2], was that 2 and 2.4 times more women than men were prescribed anxiolytics and antidepressives, respectively. These results are concordant with the prevalence of depressive disorders and anxiety, specifically, 2.7 and 1.6 times higher in women, compared with the previous age group [21].
Approximately 1.7 times more women than men in the 45–54 year age band were prescribed a NSAID. Furthermore, around 11% of the women were prescribed a topical-use NSAID. These data are concordant with the prevalence of pathologies of the musculoskeletal system (1.5 times more frequent in women) [21]. Men, however, were prescribed more lipid lowering drugs and hypotensive drugs acting on the renin-angiotensin system than were women. Based on epidemiological information, this finding was also expected [28, 29]. Lipid lowering drugs and hypotensive drugs acting on the renin-angiotensin-aldosterone system appear for the first time in women in the 55–64 year age band, when they consume more of these drugs than men, as was also reported by Roe et al.[2]. In this age group, total cholesterol concentrations are similar in both sexes (6.1 mmol l−1), but a higher proportion of women are hypertensive (58.7%) [28]. Likewise, calcium supplements appear for the first time in women in this age band, presumably reflecting the prevalence of osteoporosis (around 30% from the age of 50 years) [30].
Compared with the previous age group, in the 65–74 year age band men used twice as many vasodilatadors for cardiac diseases and selective calcium channel blockers, a result also reported by Roe et al.[2]. The percentage of women who used these drugs for the first time was 18.3%, probably due to the higher prevalence of defined angina (men 1.5 times; women 2.3 times), compared with the previous group [28].
In the following age band, including 75–84 years olds, the use of lipid lowering drugs was less, concordant with the reduction in the number of medical visits related to lipid metabolism, which fell from 11% to 6% [21]. The use of loop diuretics occurred in 14.6% of men and their prevalence increased with age, in line with findings reported by Roe et al.[2]. Their use among men was higher than among women (23.5% vs. 20%).
Finally, in the 85 years and over age band, the use of urinary incontinence absorbents was observed in 34% of women and 19% of men. The prevalence of urinary incontinence in the elderly was, accordingly, also observed (women 42%, men 29%) [31].
The mean prescribing cost for each patient over 65 years was 6.54 times that of a patient under 65 years. This mean cost was higher than that found by Sleator [3], who reported a value that was 4.5 times higher. This difference is probably due, among other factors, to the progressive ageing of our population, which leads to a rise in diagnoses, in the detection of pathologies [14] and in morbidity [32], and in turn to a rise in drug use, as well as to the appearance of new drugs, which in general, are always more expensive.
This study has allowed us to obtain the number of prescriptions per patient per age group and to identify how much more expensive a patient of a given age is in comparison with a patient in the 0–4 year age band. This information, which allows us to assess prescription costs by age, can be used in prescribing allocation methodology and as the appropriate denominator when comparing the number of prescriptions per patient and the costs of prescribing between practices [4]. The main therapeutic groups identified as generating the highest costs were cardiovascular, central nervous system and gastrointestinal drugs, a finding which is in line with previous reports [4]. However, the wide variability found between age bands suggests that a sophisticated method of analysis will be needed if we wish to develop an accurate model for assessing expected costs for indicative prescribing amounts.
This study has been subject to certain limitations when characterizing patterns of medication use. The database is not able to detect the loss of follow up: individuals lost to follow up still form part of the total population, and this could result in underestimations of drug use.
Moreover, in our study, approximately 8% of the registered patients who were prescribed drugs presented inconsistencies in their gender or age data. This might reflect various circumstances concerning the registration of personal identification codes, including prescriptions for immigrants who were not holders of personal health care cards. This weakness points to the need to improve current systems for registering patients, as it might contribute, for instance, to changes in the prescribing budgets of medical practitioners [14].
The failure to register over-the-counter medication is also likely to mean that this study has underestimated the use of drugs available without prescription, particularly among women [33, 34]. In addition, there is no information concerning how long the substance was used for, nor of the doses administered. Nevertheless, some of these limitations are common to other studies conducted in the general population [1, 2, 13].
Furthermore, the conclusions reported here may not be directly applicable to local family health services [3, 35], as prescriptions may be influenced by a number of factors, including, among others, local morbidity, proximity to a hospital, characteristics of the prescribing doctors, or the number of specialists per inhabitant [32]. In addition, prescribing patterns are not always easily transferable from one country to another because of variations in practice cultures and specific patient needs [18]. Likewise, the difference in the cost of prescription drugs from one country to another limits the applicability of results, especially cost information, but this is not the case within Spain where the price for each drug is fixed.
In view of these results, future research should be aimed at carrying out specific interventions in the age bands showing the highest prevalence for drug use, as well as at incorporating demographic adjustments into the processes of prescription evaluation that might allow us to validate the model at the local level.
In conclusion, this research provides results concerning the prevalence of prescription drug use, and a consolidated summary of gender- and age-related prescription drug use patterns, for the main public sector provider of health care services in Catalonia. Most of the population was exposed to one or more drugs, in particular those under 5 years of age and those over 54 years old. The variability in the number of prescriptions and in the prescribing costs per patient between the different age bands suggests that adjustments should be made for age in practitioners' prescription evaluation procedures in primary health care. This would provide a measure for assessing the costs of prescription drugs by age bands.
Acknowledgments
The authors are grateful to Fundació Jordi Gol i Gurina for PhD financial support in primary health care.
Conflict of Interest: None declared.
Appendix 1
Flow diagram of participants. All people registered were covered by the Catalan Health Service.
References
- 1.Schirm E, van den Berg P, Gebben H, Sauer P, De Jong-van den Berg L. Drug use of children in the community assessed through pharmacy dispensing data. Br J Clin Pharmacol. 2000;50:473–8. doi: 10.1046/j.1365-2125.2000.00275.x. [DOI] [PMC free article] [PubMed] [Google Scholar]
- 2.Roe CM, McNamara AM, Motheral BR. Gender and age-related prescription drug use patterns. Ann Pharmacother. 2002;36:30–9. doi: 10.1345/aph.1A113. [DOI] [PubMed] [Google Scholar]
- 3.Sleator DJD. Towards accurate prescribing analysis in general practice: accounting for the effects of practice demography. Br J Gen Pract. 1993;43:102–6. [PMC free article] [PubMed] [Google Scholar]
- 4.Prescribing Support Unit. 2001. [26 February 2007]. ASTRO-PUs. Revision report. Available at http://www.ic.nhs.uk/psu.
- 5.Lloyd DCEF, Harris CM, Roberts DJ. Specific therapeutic age-sex related prescribing units (STAR-PUs): weightings for analysing general practices' prescribing in England. BMJ. 1995;311:991–4. doi: 10.1136/bmj.311.7011.991. [DOI] [PMC free article] [PubMed] [Google Scholar]
- 6.Roberts SJ, Harris CM. Age, sex and temporary resident originated prescribing units (ASTRO-PUs): new weightings for analysing prescribing of general practices in England. BMJ. 1993;307:485–8. doi: 10.1136/bmj.307.6902.485. [DOI] [PMC free article] [PubMed] [Google Scholar]
- 7.Rice N, Dixon P, Lloyd DCEF, Roberts D. Derivation of a needs based capitation formula for allocating prescribing budgets to health authorities and primary care groups in England: regression analysis. BMJ. 2000;320:284–8. doi: 10.1136/bmj.320.7230.284. [DOI] [PMC free article] [PubMed] [Google Scholar]
- 8.Servei Català de la Salut. 2000. [27 June 2007]. Xxxxx. Available at http://www10.gencat.net/catsalut/cat/index.htm.
- 9.Scrivener G, Lloyd D. Allocating census data to general practice populations: implicatins for study of prescribing variations at practice level. BMJ. 1995;311:163–5. doi: 10.1136/bmj.311.6998.163. [DOI] [PMC free article] [PubMed] [Google Scholar]
- 10.Institut d'Estadística de Catalunya. Statistical Yearbook of Catalonia. [27 June 2007]. Available at http://www.idescat.net.
- 11.Institut Català de la Salud. What is the ICS? [27 June 2007]. Available at http://www.gencat.net/ics/infocorp/english.htm.
- 12.WHO. Collaborating Centre for Drug Statistics Methodology (ATC Index with Ddds) Oslo: World Health Organization; 2004. [Google Scholar]
- 13.del Rio MC, Prada C, Alvarez FJ. The use of medication by the Spanish population. Pharmacoepidemiol Drug Saf. 1997;6:41–8. doi: 10.1002/(SICI)1099-1557(199701)6:1<41::AID-PDS250>3.0.CO;2-6. [DOI] [PubMed] [Google Scholar]
- 14.Sans S, Paluzie G, Puig T, Balaña L, Balaguer-Vintró I. Prevalencia del consumo de medicamentos en la población adulta de Cataluña. Gac Sanit. 2002;16:121–30. doi: 10.1016/s0213-9111(02)71643-9. [DOI] [PubMed] [Google Scholar]
- 15.Jorgensen T, Johansson S, Kennerfalk A, Wallander MA, Svardsudd K. Prescription drug use, diagnoses, and healthcare utilization among the elderly. Ann Pharmacother. 2001;35:1004–9. doi: 10.1345/aph.10351. [DOI] [PubMed] [Google Scholar]
- 16.Fernández E, Schiaffino A, Rajmil L, Badía X, Segura A. Gender inequalities in health and health care services use in Catalonia (Spain) J Epidemiol Community Health. 1999;53:218–22. doi: 10.1136/jech.53.4.218. [DOI] [PMC free article] [PubMed] [Google Scholar]
- 17.Aronson JK. Over-the-counter medicines. Br J Clin Pharmacol. 2004;58:231–4. doi: 10.1111/j.1365-2125.2004.02191.x. [DOI] [PMC free article] [PubMed] [Google Scholar]
- 18.Okechukwu I, Bennett K, Feely J. General practitioners' ranking of evidence-based prescribing quality indicators: a comparative study with a prescription database. Br J Clin Pharmacol. 2006;62:218–24. doi: 10.1111/j.1365-2125.2006.02621.x. [DOI] [PMC free article] [PubMed] [Google Scholar]
- 19.van Hulten R, Isacson D, Bakker A, Leufkens HG. Comparing patterns of long-term benzodiazepine use between a Dutch and Swedish community. Pharmacoepidemiol Drug Saf. 2003;12:49–53. doi: 10.1002/pds.784. [DOI] [PubMed] [Google Scholar]
- 20.Helms PJ, Daukes SE, Taylor MW, Simpson C, McLay J. Utility of routinely acquired primary care data for paediatric disease epidemiology and pharmacoepidemiology. Br J Clin Pharmacol. 2005;59:684–90. doi: 10.1111/j.1365-2125.2005.02404.x. [DOI] [PMC free article] [PubMed] [Google Scholar]
- 21.Bolíbar B, Juncosa S, Martínez C, Pareja C, Pasarin MI, Pujol E, Rosell M. Taxes d'incidència i prevalença a l'atenció primària. Mètodes per a la seva obtenció. Fundació Jordi Gol i Gurina. CatSalut: Departament de Sanitat i Seguretat Social, Generalitat de Catalunya; 2002. [Google Scholar]
- 22.Sanz E, Hernandez MA, Kumari M, Ratchina S, Stratchounsky L, Peire MA, Lapeyre-Mestre M, Horen B, Kriska M, Krajnakova H, Momcheva H, Encheva D, Martinez-Mir I, Palop V. Pharmacological treatment of acute otitis media in children. A comparison among seven locations: Tenerife, Barcelona and Valencia (Spain), Toulouse (France), Smolensk (Russia), Bratislava (Slovakia) and Sofia (Bulgaria) Eur J Clin Pharmacol. 2004;60:37–43. doi: 10.1007/s00228-003-0720-1. [DOI] [PubMed] [Google Scholar]
- 23.Ekins-Daukes S, McLay JS, Taylor MW, Simpson CR, Helms P. Antibiotic prescribing for children. Too much and too little? Retrospective observational study in primary care. Br J Clin Pharmacol. 2003;56:92–5. doi: 10.1046/j.1365-2125.2003.01835.x. [DOI] [PMC free article] [PubMed] [Google Scholar]
- 24.Finkelstein JA, Stille C, Nordin J, Davis R, Raebel MA, Roblin D, Go AS, Smith D, Johnson CC, Kleinman K, Chan KA, Platt R. Increased use of second-generation macrolide antibiotics for children in nine health plans in the United States. Pediatrics. 2003;112:620–7. doi: 10.1542/peds.2004-0311. [DOI] [PubMed] [Google Scholar]
- 25.Quach C, Collet J-P, Lelorier J. Acute otitis media in children: a retrospective analysis of physician prescribing patterns. Br J Clin Pharmacol. 2004;57:500–5. doi: 10.1111/j.1365-2125.2003.02019.x. [DOI] [PMC free article] [PubMed] [Google Scholar]
- 26.Stille LJ, Andrade SE, Huang SS, Nordin J, Raebel MA, Go AS, Chan A, Finkelstein JA. Increased use of second-generation macrolide antibiotics for children in nine health plans in the United States. Pediatrics. 2004;114:1206–11. doi: 10.1542/peds.2004-0311. [DOI] [PubMed] [Google Scholar]
- 27.Goadsby PJ, Lipton RB, Ferrari MD. Migraine-Current understanding and treatment. N Engl J Med. 2002;346:257–70. doi: 10.1056/NEJMra010917. [DOI] [PubMed] [Google Scholar]
- 28.Masia R, Pena A, Marrugat J, Sala J, Vila J, Pavesi M, Covas M, Aubo C, Elosua R. High prevalence of cardiovascular risk factors in Gerona, Spain, a province with low myocardial infarction incidence. REGICOR Investigators. J Epidemiol Community Health. 1998;52:707–15. doi: 10.1136/jech.52.11.707. [DOI] [PMC free article] [PubMed] [Google Scholar]
- 29.Tunstall-Pedoe H, Kuulasma K, Mähönen M, Tolonen H, Ruokokoski E, Amouyel P for the WHO MONICA Project. Contribution of trends in survival and coronary-event rates to changes in coronary heart disease mortality: 10-year results from WHO MONICA Project populations. Lancet. 1999;353:1547–57. doi: 10.1016/s0140-6736(99)04021-0. [DOI] [PubMed] [Google Scholar]
- 30.National Osteoporosis Foundation. Osteoporosis: disease statistics: fast facts. 2006. [26 February 2007]. Available at http://www.nof.org/osteoporosis/stats.html.
- 31.Gavira Iglesias FJ, Caridad Ocerin JM, Perez del Molino Martin J, Valderrama Gama E, Lopez Perez M, Romero Lopez M, Pavon Aranguren MV, Guerrero Munoz JB. Prevalence and psychosocial impact of urinary incontinence in older people of a Spanish rural population. J Gerontol A Biol Sci Med Sci. 2000;55:M207–14. doi: 10.1093/gerona/55.4.m207. [DOI] [PubMed] [Google Scholar]
- 32.Starfield B, Lemke KW, Bernhardt T, Foldes SS, Forrest CB, Weiner JP. Comorbidity: implications for the importance of primary care in ‘case’ management. Ann Fam Med. 2003;1:8–14. doi: 10.1370/afm.1. [DOI] [PMC free article] [PubMed] [Google Scholar]
- 33.Bruno JJ, Ellis JJ. Herbal use among US elderly: 2002 national health interview survey. Ann Pharmacother. 2005;39:643–8. doi: 10.1345/aph.1E460. [DOI] [PubMed] [Google Scholar]
- 34.Porteous T, Bond C, Hannaford P, Sinclair H. How and why are non-prescription analgesics used in Scotland? Fam Pract. 2005;22:78–85. doi: 10.1093/fampra/cmh719. [DOI] [PubMed] [Google Scholar]
- 35.Majeed A, Head S. Capitation based prescribing budgets will not work. BMJ. 1998;316:748–50. doi: 10.1136/bmj.316.7133.748. [DOI] [PMC free article] [PubMed] [Google Scholar]