

Abstract
AIMS
To assess whether, using the current regulatory criteria, therapeutically important differences can exist between bioequivalent carbamazepine (CBZ) tablets. A secondary goal was to demonstrate quantitatively the relationship between the risk of neurological adverse effects to orally ingested CBZ and the rate of absorption.
METHODS
Results of a bioequivalence study by Olling et al. (Biopharm Drug Dispos 1999; 20: 19–28) were reanalysed. Following an exploratory data analysis step, a mixed-effect pharmacokinetic–pharmacodynamic (PK–PD) model was built to describe the dependence of adverse events on the CBZ concentration.
RESULTS
Rapid development of tolerance was demonstrated for most neurological adverse effects, with a characteristic half-life of 02.29 h and an initial EC50 of 2.33 mg l−1. The resulting tolerance PK–PD model was characterized further using the tools and terminology of sensitivity analysis. It was demonstrated that the maximum concentration (Cmax) exhibits poor PK and PD sensitivities, and that clinically significant differences can exist between formulations which otherwise comply with the bioequivalence requirements. In contrast, another PK metric, the partial AUC, was a much better marker of the early neurological adverse events observable during the absorption phase of the drug.
CONCLUSIONS
In clinical and regulatory considerations, the development of acute tolerance for adverse effects of CBZ must be taken into account. Partial AUC reflects more sensitively the risk of adverse events than Cmax. Instead of the current trend of tightening of the bioequivalence criteria for narrow therapeutic index drugs, the use of alternative, more sensitive PK metrics is proposed.
WHAT IS ALREADY KNOWN ABOUT THIS SUBJECT
The occurrence of central nervous system-related adverse effects has been apparently related to the absorption rate of carbamazepine (CBZ).
However, the differing absorption rate metrics of four carbamazepine formulations in a bioequivalence study were unclearly associated with the incidence of adverse effects.
WHAT THIS STUDY ADDS
The relationship between the incidence of most neurological adverse effects and the absorption rate of CBZ was quantitatively established.
A mixed-effect PK–PD model demonstrated the rapid development of acute tolerance to these effects.
Characterization of PD and PK–PD sensitivities showed that clinically significant differences in toxicity can exist between bioequivalent CBZ formulations.
Keywords: absorption rate metrics, bioequivalence, carbamazepine, mixed-effect model, PK and PD sensitivities, PK–PD relationship
Introduction
Carbamazepine (CBZ) is considered as the primary drug for the treatment of partial and tonic-clonic seizures. It is also the drug of choice for trigeminal neuralgia and frequently used for treating bipolar depression. The originator patent expired long ago (in 1986) and there are now several generic alternatives. However, after the introduction of the generic competitors concerns have arisen about the safety and therapeutic equivalence of generic CBZ tablets.
Several cases have been published [1] about the occurrence of adverse effects after switching from one CBZ product to another. Crawford et al.[2] have reported that approximately 10% of patients complained especially about central nervous system (CNS)-related adverse effects when they were switched to one of the generic products.
Neuvonen [3] has demonstrated that the occurrence of CNS-related adverse effects is independent of the extent of absorption, but apparently related to the rate of absorption. There were patients who tolerated high concentrations when the absorption rate was low but experienced adverse effects at low but rapidly rising concentrations. In steady-state observational studies [4–6], the fluctuation of the CBZ concentration appeared to correlate with CNS-related adverse effects. To account for these observations, Riva [6] has proposed a threshold toxicity model for characterizing the dependence of adverse effects on CBZ concentrations. Other clinical studies [7, 8] have also consistently found that adverse CNS effects depend on absorption rates, but have provided no explanation.
The reports of clinical problems with approved generic products also raised concerns of the drug regulatory agencies. In a Food and Drug Administration (FDA)-sponsored study, Meyer et al.[9] explored the relationship between the dissolution rate and concentration profiles of CBZ tablets in subjects with known clinical failures. The relationship between CBZ concentration profiles and clinical effects has been investigated in healthy volunteers [10] and patients [11]. The study of Olling et al.[10] was a four-arm bioequivalence (BE) trial. They compared three generic formulations with the brand-name product. Their goal was to determine which absorption rate-dependent BE metric had the best discriminatory power, including the prediction of adverse effects. Four BE metrics were compared: maximum concentration (Cmax), time of the peak concentration (Tmax), Cmax/AUC [12, 13] (where AUC is the area under the concentration–time curve), and the area until Tmax[partial AUC (AUCP)][14, 15]. The study was inconclusive. Although there was a tendency to have more adverse effects with the faster absorbing preparations, and the four formulations were clearly bioinequivalent, statistically significant differences of adverse effects among formulations could not be demonstrated. No statistically significant, clear relationship was found between BE metrics characterizing absorption rates and the frequency of the adverse effects.
In the present study a pharmacokinetic–pharmacodynamic (PK–PD) model is proposed to characterize acute CBZ toxicity based on the data of Olling et al.[10]. By building a PK–PD model, an attempt is made to answer the original question posed by Olling et al.[10] (‘which metric is the most sensitive indicator of toxicity?’) and also to gain insight into the occurrence and mechanism of the absorption rate-dependent pharmacological response. In addition, the relationships between the PK metrics for BE and the PD metrics of toxicity will be explored, together with their clinical consequences.
Methods
Subjects and study design
The details of this four-way, randomized BE trial have been described by Olling et al.[10] In short, 18 volunteers participated, but only 16 completed the study. Two 200-mg tablets of CBZ were administered in the morning of the first study day. Blood samples were taken just before dosing (0 h) and at 0.5, 1, 1.5, 2, 3, 4, 6, 8, 10, 12, 14, 16, 20, 24, 28, 32, 48, 56, 72, 80 and 96 h. Plasma concentrations of CBZ were determined by a validated high-performance liquid chromatography method. Throughout the study the volunteers were asked to report adverse effects such as headache, dizziness, ataxia, diplopia, fatigue, drowsiness, nausea and abdominal pain. The adverse effects were scored every hour as either clearly present, weakly present, or absent. In the following analysis this categorization is simplified by joining categories ‘clearly present’ and ‘weakly present’ into a category ‘present’.
Population PK analysis
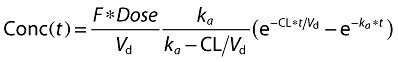
Areas under the concentration–time curve until the last measurement (AUCT) and until Tmax of the reference product (AUCP) were calculated by the trapezoidal method. A one-compartmental, linear model with first-order absorption was found satisfactory to describe the plasma concentrations:
 |
(1) |
Here, F is the fraction of drug dose reaching the systemic circulation, Vd the apparent volume of distribution,CL plasma clearance, ka absorption rate constant, and t is time.
Using the usual notations, the population kinetic model for predicting concentrations (Conc) is:
| (2) |
where the subscripts are: i = 1, …, n (subjects), j = 1, …, m (observation times), k = 1, …, 4 (formulations); and f is the model equation defined by Equation 1, tj is the j-th observation time, εikj is the observational error, and θik is the vector of PK parameters for the i-th subject taking the k-th formulation.
Furthermore:
| (3) |
where θ0 is the vector of the mean population PK parameters; Drugk is the vector of fixed effects, the difference due to the formulations. (We assumed that the CL of CBZ was independent of the formulation. Therefore, in the case of CL, the corresponding element of Drugk was set to 0.); and θi is the vector of independent random subject effects.
Population PK–PD model of adverse effects
Exploratory data analysis
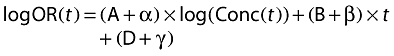
As a first step in building a PK–PD model between concentration, time and adverse effects, the data were explored using generalized additive modelling (GAM). GAM is a nonparametric ‘model-free’ procedure for developing statistical models and considered to be a useful, but mostly exploratory, graphical technique [16]. The probability of having a given adverse effect was modelled in the following form:
| (4) |
In this model s1 and s2 are coefficients of a smooth linear function that are estimated from the data, logOR(t) is the logarithm of the odds ratio of having an adverse effect at a given CBZ concentration (Conc(t)) and time (t). The level of smoothness was controlled by setting the effective degrees of freedom to 3. In one way, GAM is more flexible than the standard logistical model, but it also forces more restrictions on the structure. In particular, it requires additivity of the terms and cannot incorporate interactions between factors.
Parameter estimation for the PK–PD model
Random (mixed-effect) logistic regression was used to model the relationship between adverse effects, concentration and time. The fitted model is a generalized linear mixed-effect (also called random-logistic) model in its original domain:
 |
(5) |
where logOR(t) is the log-odds ratio for the adverse event at the time t, A, B, and D are fixed parameters, and α, β and γ are random effects.
A more familiar form can be gained from Equation 5 by taking the antilogarithm of both sides and assuming that all random effects are zero:
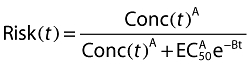 |
(6) |
where Risk(t) is the probability, the risk of having an adverse effect at time t, and EC50 is by definition the concentration which elicits adverse effects in 50% of the patients at zero time.
By comparing Equations 5 and 6, it can be seen that EC50 = e–D/A. Equation 6 defines a sigmoidal PK–PD model for tolerance where A is a sigmoidicity factor, or a steepness factor, and depending on the value of B the individual becomes either more sensitive (B > 0) or less sensitive (B < 0) to the drug effect. By substituting Conc(t) in Equation 1 into the right side of Equation 6, a direct relationship can be obtained between the pharmacokinetic parameters, like the absorption rate constant, and the probabilities (or risks) of adverse events.
Pharmacodynamic metrics
In a simulation study, Karalis and Macheras [17] introduced the concept of PD metrics and their sensitivity curves. A PD metric is a number which characterizes the relation between a drug effect and time in a similar way as PK metrics, like AUC or Cmax, do for concentration profiles.
Generally accepted PD metrics do not exist at present, even though several alternatives have been proposed [17]. Based on the simplicity and easily interpreted properties, we selected Rmax, which is the maximum risk (probability) of having an adverse effect at some time during the observation period, a close analogue of Cmax. Consequently, the ratio between the test (T) and reference (R) formulations (RmaxT/RmaxR) is a measure of relative risk due to generic switching.
The sensitivity curve of a PD metric can be obtained by recording its T/R ratio (PDT/PDR, e.g. RmaxT/RmaxR), when the analogous ratio of a PK parameter (e.g. kaT/kaR) is gradually raised. This corresponds to the definition of a PK sensitivity curve, which contrasts the T/R ratio of a PK metric (PKT/PKR, e.g. CmaxT/CmaxR) against the T/R ratio of a PK parameter [15]. The question then arises whether a PD metric responds more or less sensitively to changes of a PK parameter than does an underlying PK metric? The answer is interesting for judging the therapeutic relevance of a PK metric and is provided by studying the PD/PK sensitivity curves, the contrast of the T/R ratios of the PD and PK metrics.
Statistical analysis
S-Plus (ver. 6.1; Insightful, Seattle, WA, USA) was used for all statistical computations including GAM. For mixed logistic regression, the glmmPQL procedure was utilized from the MASS4 library of Venables and Ripley [18]. The nlme Splus library of Pinheiro and Bates [19] was used for population pharmacokinetic analyses. All computations were performed on a personal computer having a 1.7-Ghz Pentium IV processor.
Results
Population PK analysis
The purpose of the population PK analysis was to obtain the unbiased mean PK parameters of the four formulations. Figure 1 illustrates that the one-compartment population PK model characterizes the data sufficiently well. The observed average concentrations (Figure 1A) and the concentrations predicted by the mean PK parameters are very close to each other (Figure 1B), and no apparent deviation can be seen between the observed and predicted concentrations (Figure 1C). The difference between the kinetics of the four formulations is obvious even by visual inspection of the data, and the numerical entries of Table 1 support this observation. Table 1 shows the estimated mean PK parameters together with their 95% confidence intervals (CIs). The differences between absorption rates are particularly striking: the absorption rate constant of formulation C is about six times higher than that of formulation A. The CIs do not overlap, implying that the difference between absorption rate constants is statistically significant (P < 0.05). Differences in Vd/F are much less pronounced, although a statistically significant difference (P < 0.05) can be observed between the slow-absorbing (A and D) and fast-absorbing (B and C) tablets.
Figure 1.
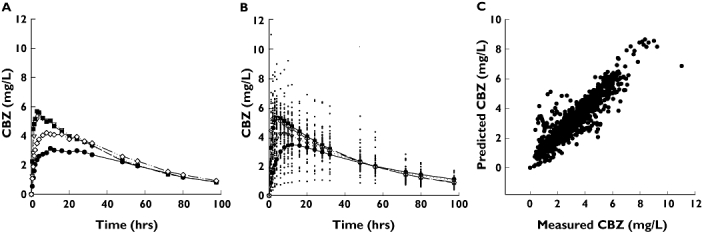
(A) Observed average carbamazepine concentrations of four formulations. (B) The pharmacokinetics (PK) of the four formulations was described with a single population PK model which assumed different absorption rate constants and biovailabilities, but the same clearance. The panel shows the observed concentrations (dots) and the predicted mean concentrations of the four formulations. Drug A, (•); Drug B, (▿); Drug C, (▪); Drug D, (◊). (C) As a diagnostic check of the assumed population model, the concentrations predicted by the model are plotted against the measured values
Table 1.
Population pharmacokinetic parameters of four carbamazepine formulations
| Formulation | ka (h−1) Mean | 95% CI | Vd/F (l) Mean | 95% CI | CL/F (l h−1) Mean | 95% CI |
|---|---|---|---|---|---|---|
| Product A | 0.240 | 0.153, 0.327 | 96.4 | 87.8, 105.7 | 1.35 | 1.23, 1.47 |
| Product B | 0.825 | 0.703, 0.947 | 68.1 | 60.7, 75.4 | ||
| Product C | 1.59 | 1.32, 1.86 | 70.8 | 63.4, 78.2 | ||
| Product D | 0.472 | 0.392, 0.552 | 83.5 | 75.1, 92.0 |
A one-compartmental model with first-order absorption was fitted assuming identical population clearances, but formulation-dependent absorption rate constants and apparent volumes of distribution. ka, Absorption rate constant; Vd, apparent volume of distribution; CL, clearance; F, bioavailability; CI, confidence interval.
The PK–PD model
The measured CBZ concentrations and the reported adverse effects are shown in Figure 2. Although it is difficult to draw general conclusions from these figures, two observations are noteworthy. First, even at the same concentration levels, there are generally more adverse effects in the first 10 h than later in their ascending and declining phases, respectively. The second point is that no clear concentration dependence can be seen for most adverse effects; for example, dizziness was reported at low and also high concentrations.
Figure 2.
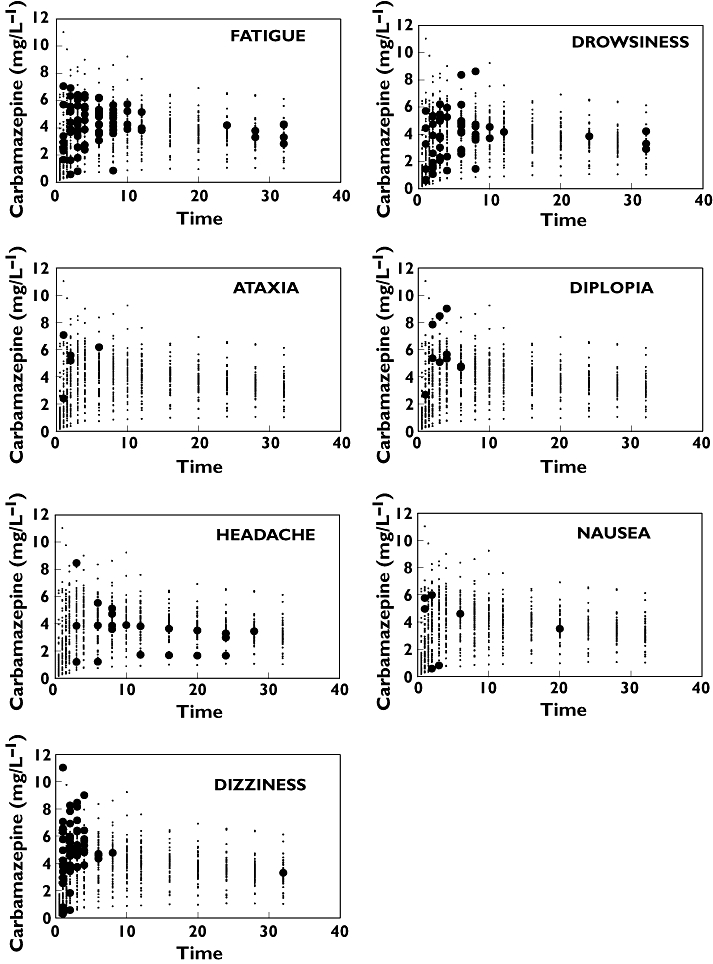
Time courses of concentrations and adverse events. In each panel, the measured carbamazepine concentration is plotted (small dots). When, at the same time, a volunteer reported an adverse effect, then instead of a small dot a black filled circle is shown
It was anticipated that by separating the effects of concentration and time, it would be possible to describe quantitatively the occurrence of adverse reactions. Therefore, initially an exploratory analysis was undertaken by applying a modelling technique called GAM as described above in Methods. The GAM-predicted probabilities are shown in Figure 3. Each panel of the figure consists of several concentration–effect curves (the concentration axis is that going ‘behind the page’), which are then shifted horizontally on the time axis. In short, each panel displays how the concentration–adverse effect relationship changes with time. Only adverse effects with a meaningful number of occurrences are illustrated. For dizziness, a strong concentration–response relationship can be discerned, which declines very rapidly. The probability of having drowsiness or fatigue seems to be related less clearly to the measured CBZ concentration. However, the pattern is the same, and the drug effect exponentially decreases with time, i.e. the probability to elicit an adverse effect at a given concentration is much less at later than at earlier times. Headache exhibits a different pattern and is a notable exception.
Figure 3.
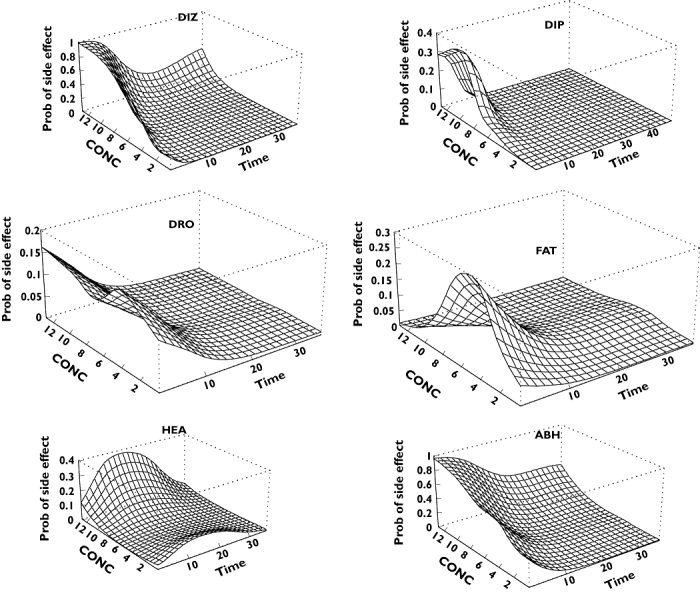
Estimated probabilities of having a particular adverse event as a function of time and carbamazepine plasma concentration. DIZ, Dizziness; DIP, diplopia; DRO, drowsiness; FAT, fatigue; HEA, headache; ABH, all adverse events but headache
Although there were obviously differences between the PK–PD characteristics of the various adverse effects, they were still pooled, with the exception of headache, for the subsequent analysis. The reasons for the pooling were as follows:
Some adverse effects tend to occur concurrently with others, and the seven measured adverse effects are not completely independent of each other. Table 2 demonstrates that when any adverse effect is reported, either dizziness or fatigue is usually also reported. The relationships between adverse effects are probably even stronger than those shown in Table 2, because the applied statistical technique detects associations when two adverse effects appear at the same time, whereas associations are not estimated when one adverse effect precedes or follows the other.
GAM, but generally any logistic regression-based analysis, can be problematic when there are only few ‘positive’ outcomes [20]. Based on this reasoning, a combination of adverse events was used in the subsequent analysis; the combined event was assumed to prevail if any of its components were present. However, headache was excluded because its time course was characteristically different from the others (Figures 2 and 3) and it was relatively weakly associated with other adverse effects (Table 2). The bottom right-hand panel of Figure 3[‘All-But-Headache’ (ABH)] shows that this pooled event has essentially the same time course as its contributing elements.
Table 2.
Temporal associations among adverse effects
| DIZ | ATA | DIP | DRO | FAT | HEA | NAU | |
|---|---|---|---|---|---|---|---|
| DIZ | 5.3% | S | S | S | S | S | |
| ATA | S | 0.44% | S | ||||
| DIP | S | 0.88% | |||||
| DRO | 4.82% | S | |||||
| FAT | S | S | S | 6.92% | S | ||
| HEA | S | S | 1.84% | ||||
| NAU | S | 0.61% |
The statistical hypothesis of simultaneous occurrences of adverse effects was checked by generating all possible 2 × 2 contingency tables and verifying significant association by Fisher's exact test. Significant associations at the 0.05 level are denoted by the symbol S. In the diagonal the total frequencies of observed side-effects (TOF) are shown which were calculated by the following formula: TOF = No. of events/(No.of subjects × No. of observations × No. of periods). DIZ, Dizziness; ATA, ataxia; DIP, diplopia; DRO, drowsiness; FAT, fatigue; HEA, headache; NAU, nausea.
Tolerance model
The initial, exploratory GAM analysis revealed the essential characteristics of the adverse effects and encouraged a more detailed, quantitative analysis. Figure 3 suggested that a tolerance model could reasonably describe the concentration and time dependence of adverse effects. The finding encouraged a more detailed, quantitative analysis.
The assumption of tolerance is supported by Figure 4, which contrasts the observed frequency of adverse effects with the corresponding mean CBZ plasma concentration. The time-course for the frequency of side-effects defines a clockwise hysteresis loop, a typical feature of tolerance (for a review of this topic see [21]).
Figure 4.
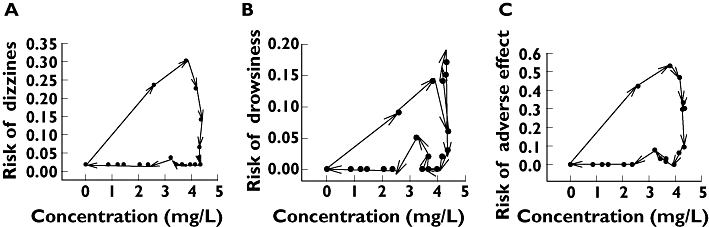
Frequency of an adverse event as a function of the mean carbamazepine concentration. Hysteresis loops are shown which demonstrate that the time courses of concentrations and of effects are not completely superimposed. The observed frequencies of the adverse effects are connected in chronological order in the direction of the arrows. The plot shows ‘clockwise’ hysteresis, meaning that the effect decreases faster than the plasma concentration. This reveals tolerance to carbamazepine either by the development of a counter-regulatory mechanism or by the desensitization of receptors. (A) Dizziness. (B) Drowsiness. (C) All adverse events but headache
A mixed-effect tolerance model (Equation 6) was fitted to the data in order to check statistically the adequacy of the model and to estimate the PD model parameters. As a first step of the model building, we checked whether a simplified form of Equation 6, where some of the terms were omitted, could still yield a statistically satisfactory fit. As Table 3 demonstrates, the answer is negative – all factors need to be included in the model. Figure 5 illustrates that the full model provides a reasonably good fit for dizziness (Figure 5A), but a not particularly good fit for drowsiness (Figure 5B). However, the overall adverse events (ABH) are predicted quite well (Figure 5C). Note that the prediction, based upon assuming zero random effects, corresponds to a volunteer with ‘average’ responsiveness. However, the participants in the study were very different in their toleration of CBZ, because the between-subject variation of responsiveness was highly significant (P < 0.001, likelihood ratio test).
Table 3.
Stepwise selection of the regression model
| Model | d.f. | AIC | logLik | Test | L. ratio | P-value | |
|---|---|---|---|---|---|---|---|
| Intercept | 0 | 2 | 949.9 | −473.0 | |||
| +Concentration | 1 | 3 | 861.1 | −427.5 | 0 vs. 1 | 90.8 | <0.0001 |
| +Time | 2 | 4 | 620.3 | −306.2 | 1 vs. 2 | 242.7 | <0.0001 |
During the model specification process three models were compared. Models are denoted with a number in the Model column. Model 0 contained only the intercept term, whereas Model 1 contained intercept and concentration. Model 2 is the full model corresponding to Equation 3 and contained all three terms in the first column. d.f., Degrees of freedom; AIC, Akaike's information criterion; logLik, log-likelihood ratio. Lower AIC and a higher logLik ratio indicate a better fitting model. The consecutive models were compared by the log-likelihood ratio test. The last column shows that Model 1 is significantly better than Model 0, and similarly Model 2 is significantly better than Model 1.
Figure 5.
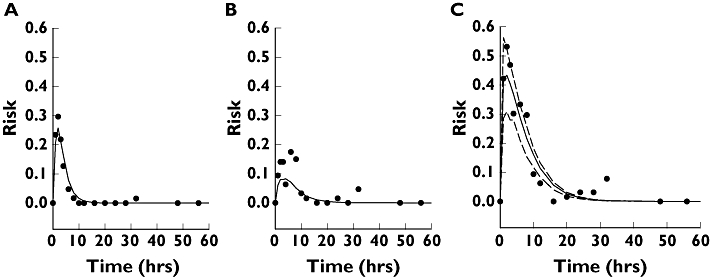
Comparison of the observed (dots) and predicted risk of adverse events. A tolerance PK–PD model (Equation 6) was fitted to the observed prevalences using mixed logistic regression. (A) Dizziness. (B) Drowsiness. (C) All adverse effects but headache. The dashed lines in (C) are the 90% confidence limits of the predicted risk. The term ‘all adverse events but headache’ means that at least one adverse event, not including headache, was recorded at the given time
The estimated parameters for ABH with their CIs are shown in Table 4. The coefficient of time (B) is significantly less than zero, and therefore the existence of tolerance is statistically well supported, with a half-life of about 2.33 h for the development of tolerance. By substituting the parameter values A and D from Table 4 into the relationship EC50 = e–D/A, an estimate of EC50 = 2.29 mg l−1 can be calculated. This is the initial sensitivity which exponentially increases with time. Solving Equation 6 at other times yields an EC50 of 7.53 mg l−1 at 4 h and 24.7 mg l−1 after 8 h.
Table 4.
Estimated parameters of the tolerance model
| Parameter | Estimate | 95% CI |
|---|---|---|
| A | 1.00 | 0.33, 1.67 |
| B | −0.29 | −0.39, −0.20 |
| D | −0.83 | −1.08, 0.15 |
For the definition of the parameters, see Equations 5 and 6 in Methods.
Adverse effects, and metrics of PD, PK and BE
Pharmacokinetic metrics are numbers which conveniently summarize essential features of plasma concentration–time curves. Two of the best-known metrics are AUC and Cmax.
When applied to the determination of BE, these metrics have primary roles in the regulatory assessment of generic drugs. Two drug formulations are accepted to be bioequivalent only if the corresponding AUC and Cmax ratios, and their 90% CIs, are in a given range, usually assumed to be between 0.80 and 1.25. As the corresponding pharmacodynamic measure, the ratio of Rmax values was investigated. The ratio reflects the relative risk of adverse events between the two drug products. The upper left panel of Figure 6 compares the early concentration profiles of four hypothetical formulations (Figure 6A). It was assumed that the four formulations differ from each other only in their absorption rates, but have common CL/F and Vd values. The ka values were set to the estimated rate constants of Products A, B, C and D, respectively (Table 1), while Vd and CL/F were those of Product D. Setting the parameters in this way, it was possible to focus only on the effect of absorption rates and eliminate the effects of the other kinetic parameters.
Figure 6.
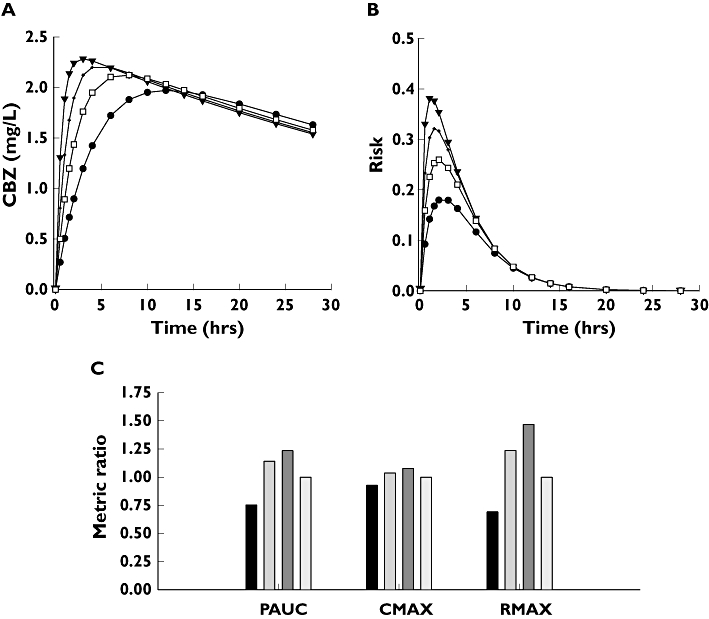
(A) Concentration profiles of four hypothetical carbamazepine tablets (A′, (•); B′, ( ); C′, (▾); D′, (□)). The concentration profiles were simulated by assuming common distribution (Vd/F) and elimination (CL) parameters, but different absorption rate constants (ka). The actual numerical parameters can be found in Table 1: CL and Vd/F, product D; ka values, products A, B, C and D, respectively. (B) Predicted probabilities of observing adverse events with the hypothetical A′ (•); B′ (
 ); C′ (▾); and the reference D′ (□) formulations. (C) Ratios of Cmax, AUCP and Rmax relative to the reference formulation. A′, (▪); B′, (
 ); C′, (
 ); D′, (
 )
)
Figure 6B shows the estimated risks of having adverse events with the four formulations. The values of Figure 6B were obtained by using Equation 6 with the parameters of Table 4. There are considerable differences among toxicities, the peak risk (Rmax) of the fastest-absorbing formulation being about twice as high as that of the slowest one.
Using the results of Figure 6A,B, the Cmax, AUCP and Rmax values, relative to reference formulation D, werecalculated. These PK and PD ratios are shown in Figure 6C. The figure reveals a serious sensitivity problem. The Cmax ratios are 0.92, 1.03 and 1.07; therefore, these formulations (with no unusually wide confidence limits) easily pass the usual BE criteria. In contrast, the corresponding Rmax ratios are 0.69, 1.23 and 1.46. Rmax = 1.46 means a 46% increase in the peak risk of toxicity relative to the reference formulation.
AUCP is a more sensitive indicator of the risk, but still not sufficiently so. The corresponding AUCP ratios at the same risk levels as above are 0.75, 1.14 and 1.22. Consequently, in theory AUCP would still allow the marketing of products with increased toxicity, but not as easily as Cmax.
Figure 7A presents both PD and PK sensitivities of metrics. They contrast the relative PK and PD metrics with the corresponding ratio of an underlying PK parameter (ka) [17]. The PD sensitivity of the Rmax ratio is still moderate: when the ka ratio is 2.0, the Rmax ratio (i.e. the relative risk of an adverse event) increases by only 22%. Note for reference that a sixfold difference was observed among the absorption rate constants (Table 1).
Figure 7.
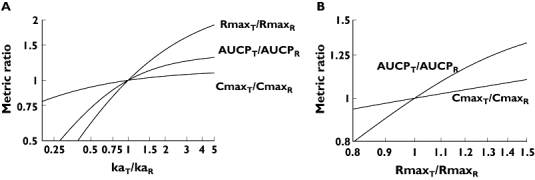
Relationships between logarithmic ratios of absorption rate constants, risks of adverse events, and bioequivalence metrics. The absorption rate constant was changed relative to the reference formulation and the corresponding AUCP, Cmax and Rmax ratios were recorded. (A) Dependence of PK and PD metric ratios on the ka ratio. (B) The relationship between PK and PD metric ratios. Ratios of PK metrics are plotted against the Rmax ratio
Figure 7A is in essence a generalization of Figure 6C. As noted above in Methods, the combination of Equations 1 and 6 makes a direct connection between the PK parameters and the risk of potential adverse events. This relationship is illustrated in Figure 7A, ina double-logarithmic representation, again using the model parameters of Tables 1 and 4. In the context of BE, the slope of 1.0 represents the full PK sensitivity of BE metrics [15]. Using this terminology, Figure 7A also shows that metrics used for the determination of BE have differing PK sensitivities. The slope of AUCP is steeper than that of Cmax, showing that AUCP is a more sensitive indicator of the difference between absorption rates than Cmax. However, Rmax ratios increase even faster, i.e. more sensitively, than either of the BE metrics, and consequently the BE metrics underestimate the relative risk due to faster absorption.
Figure 7B illustrates the PD–PK sensitivities for the two PK metrics. The figure contrasts the PD Rmax ratio with the PK Cmax and AUCP ratios. It demonstrates again that the PD response rises faster than either of the PK metrics. Figure 7B shows that a 25% change in the Rmax ratio, i.e. an increase in the relative risk, corresponds only to a 5% rise in Cmax and 13% increase in AUCP.
Discussion
Issues in statistical methodology
Olling et al.[10] tried to find possible correlations between the occurrence of adverse effects and PK characteristics, especially those reflecting the rate of absorption (Cmax, AUCP). However, although adverse effects were pooled together, Olling et al.[10] could not achieve the goal stated above, and were unable demonstrate significant relationships between adverse effects and PK metrics. We have also failed, using conventional statistical techniques such as logistic regression. However, a combination of modern exploratory data analysis such as GAM with mixed-effect PK–PD modelling has shown a highly significant relationship (Table 4) using the results of a relatively small, conventional size BE trial. The advantages of model-based drug development are well recognized by the industry [22] and model-based assessment of new drug applications is now an integral part of regulatory work [23]. Even though rigorous comparison of model-based and classical statistical analysis is lacking, our results show that a model-dependent approach may be more powerful than model-independent statistical analysis.
Issues in clinical pharmacology
Dodrill [24] carefully reviewed in 1991 the behavioural effects of antiepileptic drugs and concluded that ‘the area of behavioural effects of antiepileptic drugs is poorly defined, lacks recognized and validated methods of assessment, and has suffered from a number of methodological limitations, especially including the use of experimental designs which have led to the contamination of drug effects and subject effects’. Although there have been significant improvements since 1991 in the methodology of clinical trials, and our understanding of the molecular mode of action of CBZ has significantly improved [25], fundamental PK and PD data of such a widely used and well-known drug as CBZ are still lacking. For example, Benet [26] could find no data concerning the within-subject variation of CBZ or digoxin.
Our literature search also yielded very little quantitative information about the PK–PD properties of CBZ. It is well known [27] that slow-release CBZ formulations have fewer neurological side-effects, but this has been attributed to such a vaguely defined pharmacological term as ‘increased fluctuation’[27]. The demonstration of the development of fast tolerance has been unsuccessful [28]. We have succeeded in showing the relationship between release rates and the occurrence of adverse effects by re-evaluating the data of a carefully planned BE trial with contemporary, model-driven statistical analysis (Tables 3 and 4 and Figure 5). The strong, direct dependence of the adverse effects on the absorption rate can be explained by an examination of Figure 3. Fast absorption is unfavourable not only because it increases the concentration in the absorption phase, but also because these elevated concentrations occur earlier when the sensitivity is higher. These two factors multiply the effects of each other, and the net outcome explains the results of Figures 6 and 7.
The established tolerance model has direct clinical relevance. CBZ is one of the few drugs where therapeutic monitoring is strongly advised. However, its therapeutic range is not clearly defined [29], although the tolerance model predicts that, at least in regard to acute neurological adverse effects, such a range does not exist. The concentration data could be interpreted only by noting that subjects may complain about toxic effects at lower concentrations during the absorption phase, when PD sensitivity to the adverse effects is high, in comparison with the elimination phase, when sensitivity is low.
Drug regulatory issues
There is ongoing discussion of whether different BE regulations are needed for narrow therapeutic index drugs and, if so, which drugs belong to this category. One of the questions is whether CBZ should be considered as a narrow therapeutic index drug [30–32]. Health Canada, in its recently issued guideline [33], has set more stringent BE requirements for narrow therapeutic index drugs. For example, the 90% CI for the AUC ratio in such cases should be within the 0.90–1.12 interval. However, CBZ is not listed among the narrow therapeutic index drugs, contrary to an earlier guideline [34]. The European Guideline on BE also recommends tightening of the regulatory limits in the case of certain narrow therapeutic index drugs, but specific examples are not given [35]. The question is decided by the competent national authorities. For example, the Danish Medicines Agency asserts that if the usual acceptance limits (0.80–1.25) are applied to CBZ, then therapeutic problems could occur with substitutions of the preparations.Therefore, a generic CBZ tablet should not be substituted with the original unless the relevant confidence limits for AUC and Cmax are between the limits of 0.90 and 1.10 [36].
Figure 7A casts doubt on whether these approaches are scientifically sound and viable, showing there could be a difference in relative risk of 50% between generic products even though their Cmax ratio is still very much between the regulatory limits. A similar conclusion could be reached after considering the CIs for the metrics. Based on Figure 7A, it is suggested that, at least in the case of CBZ, instead of tightening the regulatory criterion, a more reasonable approach would be to use a PK metric which is more sensitive to possible adverse effects.
The recently introduced concept of early exposure and its suggested measure (AUCP) seem to fit this purpose [14, 15, 37]. AUCP is a more sensitive indicator of rate-dependent toxicity, particularly in the case of CBZ when development of the observed pharmacological response is much faster than the absorption process itself. The FDA observes in its current regulatory Guidance [38] that, for some drugs, comparisons of early exposure could be important, and recommends that the ratio of partial AUCs is a relevant metric in these cases. The present study of the PK–PD properties of CBZ supports the regulatory statements of the FDA.
The suggestion that partial AUC could serve as an index of early exposure in BE studies would be useful only if the corresponding regulatory limits were established. The present study intends to encourage the development of a relevant CI for the ratio of partial AUCs.
Figure 7A demonstrates that the therapeutic risk of switching (the Rmax ratio) is strongly underestimated by ratios of Cmax and, to a lesser extent, of partial AUC. Therefore the use of AUCP, while not ideal, is much preferable to indicate rate-related toxicity. It is acceptable to the FDA even if it has not been widely applied. Thus, our results suggest that more consideration should be give to using AUCP for the evaluation of BE of narrow therapeutic index drugs.
Generally, it is suggested that more consideration should be given to using AUCP for evaluating the bioequivalence of narrow therapeutic index drugs. For example, experience in renal transplantation has shown that ciclosporin exposure during the absorption phase (AUC0−4) is the critical factor for optimizing immunosuppression [39]. Thus, a partial AUC was indeed found to be a clinically relevant and useful PK metric.
Conclusions
This study has shown quantitatively the dependence of neurological adverse effects on the absorption rate of CBZ in demonstrations of the development of tolerance, and has re-evaluated the BE study of Olling et al.[10] by the exploratory data analytical technique of generalized additive modelling (GAM) followed by mixed-effect population PD–PK analysis. The development of tolerance was fast and had a characteristic half-life of 2.33 h, with an initial EC50 of 2.29 mg l−1.
The study has also explored the concepts of PD and PD–PK sensitivities of metrics using an actual clinical dataset and has demonstrated that Cmax has both poor PK and PD–PK sensitivities, whereas partial AUC exhibits better properties in this regard. Therefore, partial AUC should be applied in regulatory decisions concerning the BE of CBZ formulations.
The converse of the above conclusions is that two CBZ products can yield clinically important differences of acute toxicity even if they are declared to be bioequivalent on the basis of sufficiently similar PK metrics.
Acknowledgments
We are grateful to Dr Martin Olling and the Medicines Evaluation Board of the Netherlands for their permission and agreement to use their data (summarized in [10]).
References
- 1.Besag FM. Is generic prescribing acceptable in epilepsy? Drug Safety. 2000;23:173–82. doi: 10.2165/00002018-200023030-00001. [DOI] [PubMed] [Google Scholar]
- 2.Crawford P, Hall WW, Chappell B, Collings J, Stewart A. Generic prescribing for epilepsy. Is it safe? Seizure. 1996;5:1–5. doi: 10.1016/s1059-1311(96)80013-6. [DOI] [PubMed] [Google Scholar]
- 3.Neuvonen PJ. Bioavailability and central side effects of different carbamazepine tablets. Int J Clin Pharmacol Ther Toxicol. 1985;23:226–32. [PubMed] [Google Scholar]
- 4.Wolf P, May T, Tiska G, Schreiber G. Steady state concentrations and diurnal fluctuations of carbamazepine in patients after different slow release formulations. Arzneimittelforschung. 1992;42:284–8. [PubMed] [Google Scholar]
- 5.Hoppener RJ, Kuyer A, Meijer JW, Hulsman J. Correlation between daily fluctuations of carbamazepine serum levels and intermittent side effects. Epilepsia. 1980;21:341–50. doi: 10.1111/j.1528-1157.1980.tb04081.x. [DOI] [PubMed] [Google Scholar]
- 6.Riva R, Albani F, Ambrosetto G, Contin M, Cortelli P, Perucca B, Baruzzi A. Diurnal fluctuations in free and total steady-state plasma levels of carbamazepine and correlation with intermittent side effects. Epilepsia. 1984;25:476–81. doi: 10.1111/j.1528-1157.1984.tb03446.x. [DOI] [PubMed] [Google Scholar]
- 7.Anttila M, Kahela P, Panelius M, Yrjana T, Tikkanen R, Aaltonen R. Comparative bioavailability of two commercial preparations of carbamazepine tablets. Eur J Clin Pharmacol. 1979;15:421–5. doi: 10.1007/BF00561742. [DOI] [PubMed] [Google Scholar]
- 8.Pynnonen S, Mantyla R, Iisalo E. Bioavailability of four different pharmaceutical preparations of carbamazepine. Acta Pharmacol Toxicol (Copenh) 1978;43:306–10. doi: 10.1111/j.1600-0773.1978.tb02270.x. [DOI] [PubMed] [Google Scholar]
- 9.Meyer MC, Straughn AB, Mhatre RM, Shah VP, Williams RL, Lesko LJ. The relative bioavailability and in vivo–in vitro correlations for four marketed carbamazepine tablets. Pharm Res. 1998;15:1787–91. doi: 10.1023/a:1011929300613. [DOI] [PubMed] [Google Scholar]
- 10.Olling M, Mensinga TT, Barends DM, Groen C, Lake OA, Meulenbelt J. Bioavailability of carbamazepine from four different products and the occurrence of side effects. Biopharm Drug Dispos. 1999;20:19–28. doi: 10.1002/(sici)1099-081x(199901)20:1<19::aid-bdd152>3.0.co;2-q. [DOI] [PubMed] [Google Scholar]
- 11.Aldenkamp AP, Rentmeester T, Hulsman J, Majoie M, Doelman J, Diepman L, Schellekens A, Olling M. Pharmacokinetics and cognitive effects of carbamazepine formulations with different dissolution rates. Eur J Clin Pharmacol. 1998;54:185–92. doi: 10.1007/s002280050443. [DOI] [PubMed] [Google Scholar]
- 12.Endrenyi L, Fritsch S, Yan W. Cmax/AUC is a clearer measure than Cmax for absorption rates in investigations of bioequivalence. Int J Clin Pharmacol Ther Toxicol. 1991;29:394–9. [PubMed] [Google Scholar]
- 13.Tothfalusi L, Endrenyi L. Without extrapolation, Cmax/AUC is an effective metric in investigations of bioequivalence. Pharm Res. 1995;12:937–42. doi: 10.1023/a:1016237826520. [DOI] [PubMed] [Google Scholar]
- 14.Chen ML. An alternative approach for assessment of rate of absorption in bioequivalence studies. Pharm Res. 1992;9:1380–5. doi: 10.1023/a:1015842425553. [DOI] [PubMed] [Google Scholar]
- 15.Endrenyi L, Csizmadia F, Tothfalusi L, Balch AH, Chen ML. The duration of measuring partial AUCs for the assessment of bioequivalence. Pharm Res. 1998;15:399–404. doi: 10.1023/a:1011916113082. [DOI] [PubMed] [Google Scholar]
- 16.Ette EI, Ludden TM. Population pharmacokinetic modeling: the importance of informative graphics. Pharm Res. 1995;12:1845–55. doi: 10.1023/a:1016215116835. [DOI] [PubMed] [Google Scholar]
- 17.Karalis V, Macheras P. Pharmacodynamic considerations in bioequivalence assessment: comparison of novel and existing metrics. Eur J Pharm Sci. 2003;19:45–56. doi: 10.1016/s0928-0987(03)00064-2. [DOI] [PubMed] [Google Scholar]
- 18.Venables W, Ripley B. Modern Applied Statistics with S. New York: Springer; 2002. [Google Scholar]
- 19.Pinheiro JC, Bates DM. Mixed-Effects Models in S and S-PLUS. New York: Springer; 2000. [Google Scholar]
- 20.Hosner D, Lemeshow S. Applied Logistic Regression. New York: Wiley; 2000. [Google Scholar]
- 21.Emilien G, van Meurs W, Maloteaux JM. The dose–response relationship in phase I clinical trials and beyond: use, meaning, and assessment. Pharmacol Ther. 2000;88:33–58. doi: 10.1016/s0163-7258(00)00077-2. [DOI] [PubMed] [Google Scholar]
- 22.Miller R, Ewy W, Corrigan BW, Ouellet D, Hermann D, Kowalski KG, Lockwood P, Koup JR, Donevan S, El-Kattan A, Li CSW, Werth JL, Feltner DE, Lalonde RL. How modeling and simulation have enhanced decision making in new drug development. J Pharmacokin Pharmacodyn. 2005;32:185–97. doi: 10.1007/s10928-005-0074-7. [DOI] [PubMed] [Google Scholar]
- 23.Bhattaram VA, Booth BP, Ramchandani RP, Beasley BN, Wang Y, Tandon V, Duan JZ, Baweja RK, Marroum PJ, Uppoor RS, Rahman NA, Sahajwalla CG, Powell JR, Mehta MU, Gobburu JVS. Impact of pharmacometrics on drug approval and labeling decisions: a survey of 42 new drug applications. AAPS J. 2005;7:E503–12. doi: 10.1208/aapsj070351. [DOI] [PMC free article] [PubMed] [Google Scholar]
- 24.Dodrill C. Effects of antiepileptic drugs on behavior. In: Devinsky WT, editor. Frontiers of Clinical Neuroscience Vol. 12Epilepsy and behavior. New York: Wiley; 1991. pp. 37–46. [Google Scholar]
- 25.Czapinski P, Blaszczyk B, Czuczwar SJ. Mechanisms of action of antiepileptic drugs. Curr Top Med Chem. 2005;5:3–14. doi: 10.2174/1568026053386962. [DOI] [PubMed] [Google Scholar]
- 26.Benet LZ. Relevance of pharmacokinetics in narrow therapeutic index drugs. Transplant Proc. 1999;31:1642–4. doi: 10.1016/s0041-1345(99)00083-4. discussion 1675. 84. [DOI] [PubMed] [Google Scholar]
- 27.Miller AD, Krauss GL, Hamzeh FM. Improved CNS tolerability following conversion from immediate- to extended-release carbamazepine. Acta Neurol Scand. 2004;109:374–7. doi: 10.1111/j.1600-0404.2004.00291.x. [DOI] [PubMed] [Google Scholar]
- 28.Pieters MS, van Steveninck AF, Schoemaker RC, Kroon JM, van Gerven JM, Cohen AF. The psychomotor effects of carbamazepine in epileptic patients and healthy volunteers. J Psychopharmacol. 2003;17:269–72. doi: 10.1177/02698811030173007. [DOI] [PubMed] [Google Scholar]
- 29.Arroyo S, Sander JW. Carbamazepine in comparative trials: pharmacokinetic characteristics too often forgotten. Neurology. 1999;53:1170–4. doi: 10.1212/wnl.53.6.1170. [DOI] [PubMed] [Google Scholar]
- 30.Bialer M, Levy RH, Perucca E. Does carbamazepine have a narrow therapeutic plasma concentration range? Ther Drug Monit. 1998;20:56–9. doi: 10.1097/00007691-199802000-00010. [DOI] [PubMed] [Google Scholar]
- 31.Bialer M, Yacobi A, Moros D, Levitt B, Houle JM, Munsaka MS. Criteria to assess in vivo performance and bioequivalence of generic controlled-release formulations of carbamazepine. Epilepsia. 1998;39:513–9. doi: 10.1111/j.1528-1157.1998.tb01414.x. [DOI] [PubMed] [Google Scholar]
- 32.Yacobi A, Zlotnick S, Colaizzi JL, Moros D, Masson E, Abolfathi Z, LeBel M, Mehta R, Golander Y, Levitt B. A multiple-dose safety and bioequivalence study of a narrow therapeutic index drug: a case for carbamazepine. Clin Pharmacol Ther. 1999;65:389–94. doi: 10.1016/S0009-9236(99)70132-3. [DOI] [PubMed] [Google Scholar]
- 33.Guidance for Industry. Bioequivalence Requirements: Critical Dose Drugs. Ottawa: Health Canada; 2006. [27 March 2007]. Available at http://www.hc-sc.gc.ca/dhp-mps/alt_formats/hpfb-dgpsa/pdf/prodpharma/critical_dose_critique_e.pdf. [Google Scholar]
- 34.Bioavailability of Oral Dosage Formulations for Systemic Effects. Ottawa: Expert Advisory Committee on Bioavailability, Health and Welfare Canada; 1992. [27 March 2007]. Report C. Available at http://www.hc-sc.gc.ca/dhp-mps/alt_formats/hpfb-dgpsa/pdf/prodpharma/biorepc_biorapc_e.pdf. [Google Scholar]
- 35.The European Agency for the Evaluation of Medicinal Products, Committee for Proprietary Medicinal Products (CPMP). [27 March 2007]. Note for Guidance on the Investigation of Bioavailability and Bioequivalence. CPMP/EWP/QWP/1401/98, London Available at http://www.emea.europa.eu/pdfs/human/ewp/140198en.pdf.
- 36.Bioequivalence and Labelling of Medicinal Products with Regard to Generic Substitution. Copenhagen: The Danish Medicines Agency; 17 January 2006. [27 March 2007]. [Google Scholar]
- 37.Tozer TN, Bois FY, Hauck WW, Chen M-L, Williams R. Absorption rate vs. exposure: which is more useful for bioequivalence testing? Pharm Res. 1996;13:453–6. doi: 10.1023/a:1016061013606. [DOI] [PubMed] [Google Scholar]
- 38.Food and Drug Administration. Rockville, MD: [27 March 2007]. Guidance for Industry: Bioavailability and Bioequivalence for Orally Administered Drug Products—General Considerations. Revision 1. Available at http://www.fda.gov/cder/guidance/5356fnl.pdf. [Google Scholar]
- 39.Jaksch P, Kocher A, Neuhauser P, Sarahrudi K, Seweryn J, Wisser W, Klepetko W. Monitoring C2 level predicts exposure in maintenance lung transplant patients receiving the microemulsion formulation of cyclosporine (Neoral) J Heart Lung Transplant. 2005;24:1076–80. doi: 10.1016/j.healun.2003.05.002. [DOI] [PubMed] [Google Scholar]