

Abstract
Context
Limbic portions of cortical-subcortical circuits are likely involved in the pathogenesis of Tourette syndrome (TS). They are anatomically, developmentally, neurochemically, and functionally related to the basal ganglia, and the basal ganglia are thought to produce the symptoms of tics, obsessive-compulsive disorder, and attention-deficit/hyperactivity disorder that commonly affect persons with TS.
Objective
To study the morphologic features of the hippocampus and amygdala in children and adults with TS.
Design
A cross-sectional, case-control study using anatomical magnetic resonance imaging.
Setting
University research center.
Participants
A total of 282 individuals (154 patients with TS and 128 controls) aged 6 to 63 years.
Main Outcome Measures
Volumes and measures of surface morphologic features of the hippocampus and amygdala.
Results
The overall volumes of the hippocampus and amygdala were significantly larger in the TS group. Surface analyses suggested that the increased volumes in the TS group derived primarily from the head and medial surface of the hippocampus (over the length of the dentate gyrus) and the dorsal and ventral surfaces of the amygdala (over its basolateral and central nuclei). Volumes of these subregions declined with age in the TS group but not in controls, so the subregions were significantly larger in children with TS but significantly smaller in adults with TS than in their control counterparts. In children and adults, volumes in these subregions correlated inversely with the severity of tic, obsessive-compulsive disorder, and attention-deficit/hyperactivity disorder symptoms, suggesting that enlargement of the subregions may have a compensatory and neuromodulatory effect on tic-related symptoms.
Conclusion
These findings are consistent with the known plasticity of the dentate gyrus and with findings from previous imaging studies suggesting the presence of failed compensatory plasticity in adults with TS who have not experienced the usual decline in symptoms during adolescence.
Tourette syndrome (TS) is defined by the presence of motor and phonic tics that begin in childhood and that fluctuate in severity across time. Obsessive-compulsive disorder (OCD) and attention-deficit/hyperactivity disorder (ADHD) are commonly co-occurring conditions. Pediatric-onset OCD and TS, and possibly some forms of ADHD, are thought to represent alternative manifestations of an underlying set of vulnerability genes that predispose to semicompulsory behaviors.1 These genes are thought to produce anatomical and functional disturbances in corticostriatothalamocortical circuits.2,3 The basal ganglia are an important component of these circuits and are thought to be involved centrally in the generation of tics and other compulsory behaviors. One of these circuits projects to and from limbic regions and associated anterior cingulate cortices.4 Although no published studies thus far have assessed the morphologic features of the limbic portions of these circuits in persons with TS, considerable circumstantial evidence suggests that limbic structures are involved in the pathogenesis of TS.
Anatomical considerations, for example, suggest involvement of these regions. The hippocampus and amygdala portions of the limbic corticostriatothalamocortical circuit send dense projections directly to the ventromedial striatum,5-9 permitting the hippocampus and amygdala to affect activity in the striatum. Projections from the amygdala and hippocampus modulate dopaminergic input to the ventral striatum7,10-12 and are themselves modulated by innervation from the prefrontal cortex.8,10 So intimate are the developmental, neurochemical, and anatomical interconnections of the amygdala with the basal ganglia that the central and medial nuclei in the amygdala are considered ventral extensions of the striatum. The lateral, basal, and posterior nuclei of the amygdala, in contrast, are considered extensions of frontal and other cortical regions. Together, these cortical regions and amygdala nuclei interact with the striatum to guide motivated behavior.13,14
The functional roles of the limbic and basal ganglia portions of corticostriatothalamocortical circuits also suggest their involvement in the pathogenesis of TS. These structures, for example, have related, complementary roles in their support of learning and memory processes.15,16 The basal ganglia subserve habit learning,15 and habit learning is impaired in children and adults with TS,17 consistent with the reduced volumes and functional disturbances documented in the basal ganglia of persons with TS.3,18 The hippocampus and amygdala, in contrast, subserve declarative memory and emotional learning, respectively.19 These multiple learning and memory systems interact in complex ways,16,20 and thus disturbances in habit learning in the basal ganglia might be expected to accompany disturbances in the morphologic features and functions of the amygdala and hippocampus in people with TS.
Additional circumstantial evidence of the involvement of limbic structures in the pathogenesis of TS includes the reported sexual dimorphisms of these regions in control subjects21,22 and the prevalence differences in TS across the sexes, which is 3- to 10-fold greater in males.23 Whether male sex confers additional risk or female sex affords relative protection from TS in genetically predisposed individuals is unknown.24,25 Nevertheless, sexually dimorphic regions of the brain are thought to mediate these sex-specific differences in risk of TS,21 a possibility supported by findings that hormonal manipulations affect the severity of tic symptoms.22 In addition, the sexual and aggressive content of many complex tics and OCD symptoms suggests the involvement of limbic structures in the pathogenesis of TS.26
We report herein a high-resolution magnetic resonance imaging study of amygdala and hippocampus morphologic features in 282 patients with TS and control subjects. We examine the conventional volumes of the hippocampus and amygdala and their detailed surface morphologic features, which we presume reflect volumes of underlying subregions. On the basis of considerable circumstantial evidence of the involvement of the amygdala and hippocampus in the pathogenesis of TS, we hypothesize that these measures will differ between patients with TS and control subjects and that group differences will vary by sex and age.
METHODS
PARTICIPANTS
We acquired magnetic resonance images on 282 individuals (154 patients with TS and 128 controls) aged 6 to 63 years (Table 1). Patients with TS were recruited from the Tic Disorders Specialty Clinic at the Yale Child Study Center in New Haven, Connecticut. Control subjects were randomly recruited from a list of 10 000 names purchased from a telemarketing company who were in the age range and lived in the same zip code area as patients with TS. Written informed consent was obtained for all the participants. Approval for the study was provided by the Human Investigation Committee of the Yale School of Medicine (New Haven) and by the institutional review board of the New York State Psychiatric Institute (New York).
Table 1.
Demographic Characteristics of the 282 Study Participants
| Patients With TS (n=154)a | Controls (n=128) | P Value | |
|---|---|---|---|
| Adults (aged ≥18 y), No. | 45 | 56 | .01 (χ2=6.4) |
| Children (aged <13 y), No. | 85 | 55 | .04 (χ2=4.2) |
| Age, mean±SD, y | 18.7±13.4 | 20.2±13.2 | .34 |
| Height, mean±SD, cm | 60.3±7 | 61±7.9 | .46 |
| SES at birth, mean±SDb | 45.7±11.6 | 47.1±11.5 | .30 |
| Full-scale IQ, mean±SD | 113±16.1 | 119.5±16.9 | .003 |
| Male sex, No. | 114 | 72 | .002 (χ2=9.8) |
| Minority race, No. | 7 | 13 | .07 (χ2=3.3) |
| Right-handed, No. | 141 | 122 | .21 (χ2=1.6) |
Abbreviations: SES, socioeconomic status; TS, Tourette syndrome.
In the TS group, 48 patients (31.2%) had a comorbid lifetime diagnosis of obsessive-compulsive disorder, 42 (27.3%) had attention-deficit/hyperactivity disorder, and 10 (6.5%) had both. At the time of imaging, 72 patients with TS (46.8%) were taking psychotropic medications, including typical neuroleptics (n=19), atypical neuroleptics (n=7), stimulants (n=3), α-agonists (n=28), selective serotonin reuptake inhibitors (n=20), and tricyclic antidepressants (n=12).
Estimated at the time of the participant’s birth to avoid bias attributable to downward drift in adults with TS, whose educational and occupational opportunities are often compromised by their persistent neuropsychiatric illness.
All patients met the DSM-IV criteria for a diagnosis of TS.27 Exclusion criteria for patients with TS included movement disorders and major psychiatric disorders other than ADHD or OCD that antedated the onset of tics. Exclusion criteria for control subjects were a history of tic disorder, OCD, ADHD, or other current axis I disorders. Additional exclusion criteria for both groups included any previous seizure, head trauma with loss of consciousness, current or previous substance abuse, or IQ below 70.
Diagnoses were established through evaluation using the Schedule for Tourette Syndrome and Other Behavioral Disorders, which includes the Kiddie-Schedule for Affective Disorders and Schizophrenia28 and the Schedule for Affective Disorders and Schizophrenia for diagnoses in adults,29 and a best-estimate consensus procedure that considered all available study materials and medical records. Symptom severities were rated using the Yale Global Tic Severity Scale,30 the Yale-Brown Obsessive Compulsive Scale,31 and the DuPaul-Barkley ADHD rating scale.32 Estimates of full-scale IQs were made in children using the Kaufman Brief Intelligence Test33 and in adults using the Wechsler Adult Intelligence Scale–Revised.34 Socioeconomic status was estimated using the Hollingshead Four-Factor Index.35
MAGNETIC RESONANCE IMAGING
High-resolution magnetic resonance images were obtained using a single 1.5-T scanner (GE Signa, Milwaukee, Wisconsin). Head positioning was standardized using canthomeatal landmarks. Brain images were acquired using a sagittal 3-dimensional volume, spoiled gradient echo sequence (repetition time, 24 milliseconds; echo time, 5 milliseconds; flip angle, 45°; frequency encoding, superior to inferior; no wrap; matrix, 256 × 192; field of view, 30 cm; excitations, 2; section thickness, 1.2 mm; contiguous sections encoded for sagittal section reconstruction, 124; and voxel dimensions, 1.17 × 1.17 × 1.2 mm).
MORPHOMETRY
Morphometry was performed on computer workstations (Sun Ultra 10; Sun Microsystems Inc, Santa Clara, California) using a standard software program (ANALYZE 7.5; Biomedical Imaging Resource, Mayo Foundation, Rochester, Minnesota). All brain regions were manually traced on Sun Ultra 10 workstations using ANALYZE 7.5 software while researchers were masked to participant characteristics and hemisphere (images were randomly flipped in the transverse plane). Large-scale variations in image intensity were removed,36 and images were reformatted to a standard orientation before region definition.
Amygdala and Hippocampus
Detailed methods for definition of the amygdala and hippocampus are described elsewhere37,38 (Figure 1). Interrater reliabilities for the morphometric measurements in the left and right hemispheres, measured using an intraclass correlation coefficient on 10 images across 2 raters, were 0.94 and 0.91 for the hippocampus and 0.92 and 0.89 for the amygdala, respectively. Region definitions for all participants were reviewed for accuracy by an expert in neuroanatomy (B.S.P.).
Figure 1.
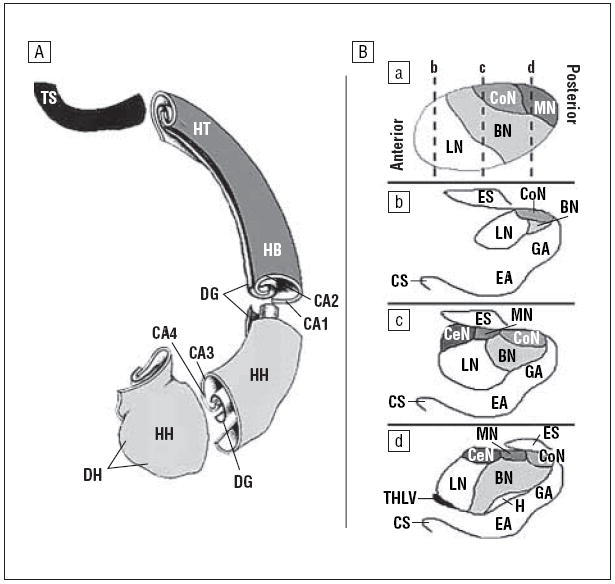
Hippocampus and amygdala morphologic features. The anteriormost slice of the amygdala was defined as the one in which the anterior commissure first crosses the midline; its posterior region was defined by the appearance of the hippocampus inferiorly and the gyrus uncinatus. The transition between the amygdala and the hippocampus was determined by drawing a line connecting the inferior horn of the lateral ventricle to the amygdaloid sulcus. When the sulcus was not obvious, a straight horizontal line connecting the inferior horn of the lateral ventricle to the surface on the uncus was used as the transition. The posteriormost slice of the hippocampus was defined as the last slice in which the crus of the fornix and the fimbria of the hippocampal formation could be delineated. A, Dorsal view of the subregions of the left hippocampus. B, Coronal sections of the subregions of the right amygdala. a, Sagittal view, with slices of the corresponding coronal views indicated (broken vertical lines). b-d, Coronal views, from anterior to posterior. BN indicates basal nucleus; CA1 to CA4, the fields of the cornu ammonis; CoN, cortical nucleus; CeN, central nucleus; CS, collateral sulcus; DG, dentate gyrus; DH, digitationes hippocampi; EA, entorhinal area; ES, endorhinal sulcus; GA, gyrus ambiens; H, hippocampus; HB, hippocampal body; HH, head of the hippocampus; HT, hippocampal tail; LN, lateral nucleus; MN, medial nucleus; THLV, temporal horn of the lateral ventricle; TS, terminal segment of the hippocampal tail.
Whole-Brain Volume
To control for generalized scaling effects in the brain, whole-brain volume (WBV) was calculated for use as a covariate in the statistical analysis.
Surface Morphometry
Detailed descriptions of the procedures used to analyze surface morphologic features of the hippocampus and amygdala,39 and related validation studies,40 are provided elsewhere. Briefly, however, we first used a rigid-body similarity transformation to register each participant’s brain with a template brain (the appropriate template brain was selected using procedures described elsewhere39). We then used these estimated parameters, including global scaling, to adjust regional volumes for overall brain size, to transform the manually defined hippocampus and amygdala from each participant into this common template space. The transformed hippocampus and amygdala of each participant were then individually and rigidly coregistered to the corresponding structure of the template brain to further refine their registrations before being warped to the corresponding structures of the reference brain using a high-dimensional, nonrigid warping algorithm based on the dynamics of fluid flow. Structures were warped to be exactly the same size and shape as the template structures, permitting precise identification of corresponding points on the surfaces of the amygdala and hippocampus in each participant’s brain with those in the reference brain. The warped hippocampus and amygdala were then unwarped into the refined template space identified before the high-dimensional warp while maintaining the labels for corresponding points on the surfaces of the participant and reference structures. The distances of each of the labels from the corresponding labels of the reference structure in this template space were subjected to statistical modeling. These methods, combined with the large sample of participants examined, provide considerable sensitivity and specificity40 for detecting morphologic abnormalities in the surfaces of the amygdala and hippocampus compared with previous global analyses of brain morphologic features using voxel-based morphometry in small samples.41,42
STATISTICAL ANALYSIS
Conventional Volumes
Statistical procedures were performed using a commercially available software program (SAS version 9.0; SAS Institute Inc, Cary, North Carolina). A priori hypotheses were tested using a mixed-models analysis (PROC MIXED; SAS Institute Inc) with repeated measures over a spatial domain (the amygdala and hippocampus). The model included the within-subjects factors of hemisphere with 2 levels (left and right) and region with 2 levels (amygdala and hippocampus). Diagnosis (TS vs controls) was a between-subjects factor. Covariates included age, sex, lifetime diagnoses of ADHD or OCD, and WBV to control for scaling effects.
In addition to main effects, we considered for inclusion in the model all 2- and 3-way interactions of TS, sex, hemisphere, region, and age and the 2-way interactions of WBV with hemisphere or region. Insignificant terms were eliminated via backward stepwise regression, with the constraint that the model at each step was hierarchically well formulated (all lower-order component terms were included in the model, regardless of statistical significance).
The a priori hypotheses concerning the effects of diagnosis, as well as age- and sex-specific effects, were tested according to the statistical significance of the main effect of diagnosis and its interactions with region, age, sex, age × region, and sex × region, thus requiring 6 statistical tests. To correct for this number of comparisons, the threshold for significance was set at P<.05/6, or P<.008. All P values were 2-sided.
Surface Morphometry
The signed euclidean distances between points on the surfaces of the amygdala and hippocampus for each participant and corresponding points on the respective reference structures were compared statistically between groups using linear regression at each voxel on the surface while covarying for age, sex, and lifetime diagnoses of OCD and ADHD. Interactions were hierarchically modeled. We used the theory of gaussian random fields to correct P values appropriately for multiple comparisons in the presence of intercorrelated measures of distance.43 Probability values were color-coded at each voxel and were displayed across the surface of the reference structures at P<.05. Similar maps were constructed for P values associated with partial correlations of surface measures with symptom severity while covarying for sex and age. Results were plotted for analyses of all the participants and for children alone who were younger than 13 years. This cutoff age was selected because it represents the usual plateau in the severity of tic symptoms during development, after which severity typically declines.44 Analysis of children younger than this age should therefore minimize ascertainment bias that attends the study of still-symptomatic individuals at ages when severity usually attenuates.
Associations With Symptom Severity
In the TS group, we explored the associations of amygdala and hippocampus volumes or surface measures with symptom severity. Correlations were performed using the general linear model, with age and sex as covariates (and in analyses of conventional volumes, with WBV as a covariate as well).
Medication and Comorbidity Effects
The effects of comorbid illnesses and medication on these findings were evaluated in 2 complementary ways: by assessing their effects as statistical covariates in the final model for hypothesis testing and by assessing the stability of findings in analyses of patients with pure TS only (ie, without OCD or ADHD) or patients with TS who were not taking any medications.
RESULTS
Results are described herein for conventional volumes (Table 2). Those for surface morphometry are presented in Figures 2, 3, 4, and 5 and in the “Comment” section. The main effect of diagnosis for overall volumes of the amygdala and hippocampus was significant (F1,275=7.67; P=.006), confirming the first hypothesis. Least squares means indicated larger mean±SD volumes in the TS group for the hippocampus (3225.2±40.9 vs 3127.3±53.0 mm3) and amygdala (2189.8±36.4 vs 2069.3±49.4 mm3). The interactions of diagnosis with region, age, sex, age × region, and sex × region did not confirm the other hypotheses for conventional volumes, although surface analyses indicated strong local interactions with age and sex in both regions (Figures 2-5). The mean±SD WBV did not differ appreciably across groups (patients with TS: 1308.2±124.4 cm3; controls: 1318.8±129.3 cm3; t280=0.49; P =.49).
Table 2.
Final Model for Conventional Volumesa
| Variable | df | F Score | P Value |
|---|---|---|---|
| TS | 1,275 | 7.67 | .006 |
| OCD | 1,275 | 0.11 | .74 |
| ADHD | 1,275 | 0.01 | .91 |
| Age | 1,275 | 0.06 | .81 |
| Sex | 1,275 | 1.63 | .20 |
| Region | 1,280 | 884.88 | <.001 |
| Hemisphere | 1,281 | 4.68 | .03 |
| WBV | 1,275 | 89.59 | <.001 |
| Sex × region | 1,280 | 9.80 | .001 |
Abbreviations: ADHD, attention-deficit/hyperactivity disorder; df, degrees of freedom; OCD, obsessive-compulsive disorder; TS, Tourette syndrome; WBV, whole-brain volume.
The model was determined through a procedure in which all main effects were forced into the model and higher-order terms were removed via backward stepwise selection with the constraint that the model was hierarchically well-formulated at each step. The significant main effect of TS indicated differences in volume across diagnostic groups (TS vs controls). Additional significant terms included region, indicating that the amygdala and hippocampus, on average, differed significantly from one another in their volumes; WBV, indicating the presence of scaling effects in the data (the larger the brain, the larger the amygdala and hippocampus); and the sex × region interaction, indicating that a difference in volume across sexes varied by brain subregion (amygdala or hippocampus). This regional specificity of sex differences did not vary by diagnosis, however (ie, the sex × region × TS interaction was not significant).
Figure 2.
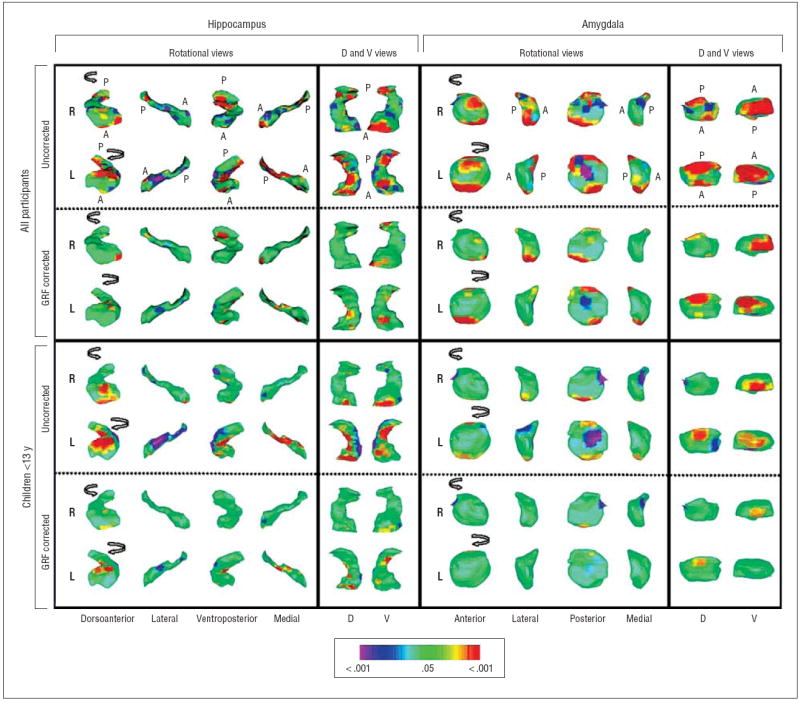
Diagnosis main effects in surface morphologic features. The right (R) and left (L) hippocampus and amygdala are shown in rotating views and in their dorsal (D) and ventral (V) perspectives. Anterior (A) and posterior (P) directions are indicated in the top 2 rows. Arrows in the rotational views show the direction of rotation. The statistical model included the main effect of diagnosis and the covariates of age, sex, and lifetime diagnoses of obsessive-compulsive disorder and attention-deficit/hyperactivity disorder. The color bar indicates the color coding for P values associated with the main effect of diagnosis, with warmer colors (yellow and red) indicating protruding surfaces, presumably from larger underlying volumes, and cooler colors (blue and purple) indicating indented surfaces and presumably smaller underlying volumes in those regions. The gaussian random field (GRF)–corrected images tell us which voxels in the image survive rigorous correction for multiple comparisons. Because the corrections are so rigorous, they may not inform us completely about the underlying spatial or anatomical configuration of the statistical effects being modeled (because the anatomical location of the voxels identified in this map are vulnerable to the effects of statistical thresholding that can cause them to shift in location). For accurately identifying anatomical subregions that carry the effect being modeled, GRF-uncorrected images are preferred; for identifying voxels involved in the effect with the greatest statistical certainty, GRF-corrected images are preferred.
Figure 3.
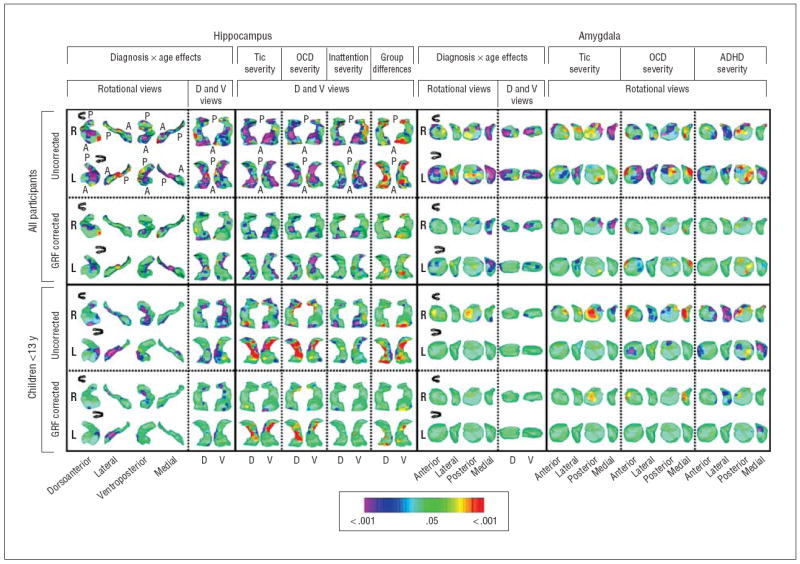
Diagnosis × age interactions and symptom correlates in surface morphologic features. Orientations and abbreviations are as described in Figure 2. The statistical model for the diagnosis × age interaction included the main effect of diagnosis and the covariates of age, sex, and lifetime diagnoses of obsessive-compulsive disorder (OCD) and attention-deficit/hyperactivity disorder (ADHD). The color bar indicates the color coding for P values associated with the interaction term for symptom severity calculated at each point on the surfaces of the hippocampus and amygdala. In the hippocampus, age × diagnosis effects were detected over the head and medial surface in all participants bilaterally, whereas in the children they were detected only over the lateral surface. Scatterplots of these effects indicated that the head and medial surfaces were larger in children with Tourette syndrome (TS) but declined with age, so they were substantially smaller in adults with TS (Figure 4). The larger sizes of these regions, detected as a significant main effect (Figure 2), were carried by the disproportionate number of children in the sample. Scatterplots also indicated that the lateral aspect of the hippocampus increased with age in controls but declined with age in children with TS (Figure 4). Similar age × diagnosis interactions were detected over the medial surface of the amygdala bilaterally, again with a decline with age in patients with TS, particularly in adults, compared with controls. The statistical models for assessment of the morphologic correlates of symptom severity included the main effect of severity in a single domain (ie, tics, OCD, or ADHD) and age as a covariate. For ease of comparison of findings in the hippocampus with the regions of significant group differences, the dorsal and ventral views of the main effect of diagnosis are also shown. Tic severity correlated significantly and inversely with morphologic abnormalities over the head and medial border of the hippocampus bilaterally and over the lateral surface of the left amygdala and medial surface of the right amygdala in an analysis of all the participants. In an analysis of children only, a similar pattern of correlations was detected, although with statistically weaker effects. In addition, the children exhibited strong positive correlations with tic severity over the medial body of the left hippocampus and over the posterior surface of the right amygdala. The severity of OCD symptoms correlated inversely with morphologic abnormalities of the medial border of the tail of the hippocampus bilaterally and inversely with the lateral surface of the amygdala in analyses of all the participants. In analyses of children only, positive correlations were detected over much of the medial body of the left hippocampus and medial tail of the right amygdala. The severity of ADHD symptoms correlated inversely with the morphologic features of the head of the hippocampus bilaterally with the lateral and medial borders of the amygdala.
Figure 4.
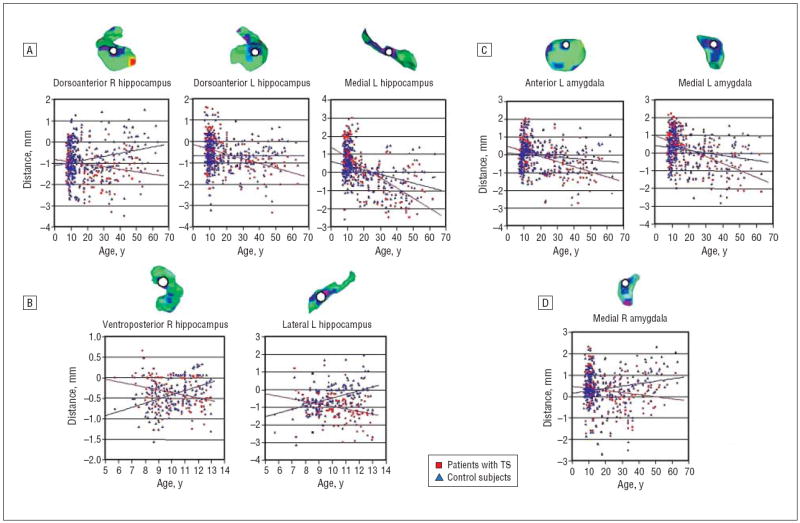
Scatterplots for diagnosis × age interactions. Regions where this interaction survived gaussian random field correction are probed (white circles). A, Scatterplots for diagnosis × age interactions. Regions where this interaction survived gaussian random field correction are probed (white circles). Distance is calculated as millimeters from the surface of the template hippocampus or amygdala. A, Effects in the hippocampus for all participants. B, Effects in the hippocampus of children younger than 13 years. C, Effects in the amygdala of all participants. D, Effects in the amygdala of children younger than 13 years. L indicates left, R, right; TS, Tourette syndrome. In all analyses, older participants, on average, have reduced local volumes compared with control subjects of comparable ages.
Figure 5.
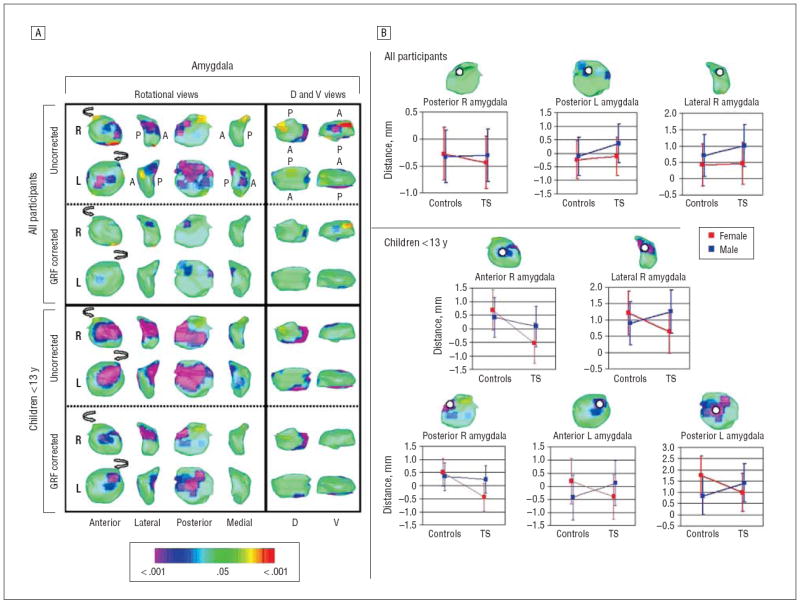
Diagnosis × sex interactions in surface morphologic features. Orientations and abbreviations are as described in Figures 2 and 4. A, The statistical model included the main effect of diagnosis; the covariates of age, sex, and lifetime diagnoses of obsessive-compulsive disorder and attention-deficit/hyperactivity disorder; and the interaction of diagnosis × sex. The color bar indicates the color coding for P values associated with the interaction term calculated at each point on the surface of the amygdala. No significant interaction effects were detected in the hippocampus (not shown). The maps for the amygdala were unchanged when including the diagnosis × age interaction. Significant diagnosis × sex effects that survived gaussian random field correction were not detected in the hippocampus but were prominent in the amygdala, particularly in its posterior and lateral surfaces and in children. B, Scatterplots indicated that these sex-specific group differences were driven by local volumes in males with Tourette syndrome (TS) that were either similar to or larger than those in control males and by volumes in females with TS that were smaller than those in control females. These tended to reverse in the TS group the direction of sex differences present in controls. Error bars represent SD.
We did not discern appreciable effects of either medication or comorbid OCD or ADHD on these findings (data not shown), except for the correlates of selective serotonin reuptake inhibitor (SSRI) use with morphologic featuresof the hippocampus and amygdala, which were similar to the correlates of OCD symptom severity with morphologic features of these structures. Almost all participants taking SSRIs were taking these medications to treat comorbid OCD. When excluding individuals taking SSRIs, however, we still detected the correlations of OCD severity with regional morphologic features (data not shown), suggesting that the morphologic correlates of SSRI exposure were driven by the presence of OCD, not by the use of SSRIs.
COMMENT
Overall hippocampus volumes were 3.1% larger in the TS group. Surface analyses of the hippocampus demonstrated that the enlargement was localized to the head and distal tail bilaterally and to the medial border of the left hippocampus in analyses of all participants and children alone (Figure 2). These findings suggest that enlargement in the TS group involved primarily the dentate gyrus and the cornu ammonis (CA) 3 subfield. In addition, reduced regional volumes were identified over the lateral aspect of the hippocampus, corresponding to the CA1 subfield, an effect that likely attenuated the magnitude of increased overall volume.
Overall volumes of the amygdala were 5.8% larger in the TS group. Amygdala enlargement derived primarily from local increases in the volume of its inferiormost and dorsalmost aspects bilaterally, corresponding approximately to the locations of the lateral, cortical, and centromedian nuclei of the amygdala (Figure 2). In addition, significantly reduced volumes were detected over the anterior surface, approximating the location of the basal nuclei.
AGE-SPECIFIC EFFECTS
In many regions of the hippocampus where volumes differed across groups, scatterplots demonstrated that age correlates differed in the TS group compared with controls (ie, we detected a significant diagnosis × age interaction), and in all instances regional volumes declined with age faster in the TS group than in controls, so volumes were considerably smaller in adults with TS than in their control counterparts (Figures 3 and 4). The locally increased volumes in the TS group derived from the children in the cohort, and adults with TS actually had reduced volumes in these same hippocampal subregions.
Inverse correlations with age in the TS group were significantly more prominent than in controls over the medial surfaces of the amygdala bilaterally (Figures 3 and 4). Similar to the age effects in the hippocampus, those in the amygdala extended into the regions where the main effects of group differences were detected, indicating that the locally increased volumes in the TS group derived primarily from children in the cohort and that adults with TS tended to have reduced volumes in these amygdala subregions.
SEX-SPECIFIC EFFECTS
Sex-specific differences between groups were detected over the anterior, posterior, and lateral surfaces of the amygdala, and they were particularly prominent in children (Figure 5). These sex-specific group differences were driven by local volumes in males with TS that were either similar to or larger than those in control males and by volumes in females with TS that were smaller than those in control females. These effects tended to reverse in the TS group the direction of sex differences present in controls. Although the mechanism producing this sex difference and its pathophysiologic significance are unclear, the finding is consistent with the general hypothesis that disturbances in sexually dimorphic brain regions contribute to the pathogenesis of TS.
CORRELATIONS WITH SYMPTOM SEVERITY
In the areas of localized hippocampal hypertrophy in patients with TS, including the head and medial border of the hippocampus over the dentate gyrus and CA3 subfields bilaterally, the magnitude of the protrusion invariably correlated inversely with the severity of tic, OCD, and ADHD symptoms (Figure 3). These findings suggest that the localized hypertrophy in each structure may be compensatory, helping to reduce the severity not only of tics but also of OCD and ADHD symptoms.
In the amygdala, volumes correlated inversely with the severity of tic symptoms over the right medial and left lateral surfaces, corresponding to the lateral and basal nuclei (Figure 3). Inverse correlations with the severity of OCD symptoms were greatest over the anterior, lateral, and dorsoposterior surfaces, and with ADHD symptoms they were greatest over the lateral and medial surfaces. These findings suggest that severity in all 3 symptom domains correlated inversely with morphologic abnormalities of the amygdala over its lateral surface and that relative hypertrophy in this region may help reduce symptom severity in a nonspecific manner.
In addition, in children with TS, positive correlations of volumes with the severity of tic and OCD symptoms were identified in the medial body of the right hippocampus and the medial tail of the left hippocampus. In the amygdala, positive correlations of volume with tic and ADHD severity were detected over the posterior surface, and with OCD severity over the medial surface. Taken together, correlations with symptom severity suggest that some portion of the enlargement in overall volumes of the hippocampus (particularly in the dentate and CA3 subfields) and amygdala (especially the lateral nucleus) was compensatory, whereas some portion of hypertrophy of the hippocampus (especially the medial body) and amygdala (particularly the posterior surface) may have exacerbated illness severity. These generalizations seemed to apply across tic, OCD, and ADHD symptom domains, suggesting that these subregions in the hippocampus and amygdala serve a general neuromodulatory function, at least with respect to these symptoms, which are thought to share elements of a common neurobiologic substrate.45
HIPPOCAMPUS SUBFIELDS IN THE PATHOGENESIS OF TS
Although we cannot infer causation from these cross-sectional, correlational findings,46 the prominent enlargement of the dentate gyrus and CA3 subfields in the hippocampus and the proportional attenuation of tic, OCD, and ADHD symptoms with increasing size suggests that the enlargement was compensatory. This interpretation is consistent with extensive evidence that synaptic remodeling and increased neurogenesis47-51 in response to experiential demands52,53 occur primarily in the dentate gyrus, which consequently increases in volume and thickness.52,53 A subsequent increase in the number of mossy fibers, which project from granule cells in the dentate to pyramidal cells in CA3, increases activity in CA3 neurons, which can induce nonassociative long-term potentiation and hypertrophy in the CA3 subfield.54 Hypertrophy in these regions could represent a localized compensatory response of neural processes to the presence of functional disturbances in these or other portions of the hippocampus,50 or it could represent a compensatory response, possibly as a consequence of cognitive or behavioral strategies to cope with the presence of tics, that helps to attenuate or control symptoms that are generated primarily in other neural systems.
Alternative explanations for hypertrophy of the dentate should be considered. First, given that stimulus-enriched environments52,55 and physical activity49,56-58 potently enhance neurogenesis in the dentate, the anterior hippocampal hypertrophy detected in persons with TS conceivably could be a neuronal consequence of the exaggerated motor activity associated with tics. If that were true, however, then we would expect greater enlargement with more symptoms, and in fact we found the opposite: more enlargement accompanied fewer symptoms, at least in the analysis of all the participants. We did detect positive correlations with tic severity in children over the dentate gyrus, primarily in the left hippocampus, which could be interpreted as either a cause or consequence of motor activity associated with tics or compulsions. Second, disturbances in striatal functioning could induce activation in and subsequent hypertrophy of the hippocampus to compensate for impairments in habit learning.59 Because impaired striatal functioning and habit learning have been associated with more severe symptoms, however, this account would predict that more severe symptoms would accompany more hippocampal hypertrophy, and again we found the opposite to be true. Third, increased cortisol levels have been associated with increased volumes over the head of the hippocampus in healthy children,60 suggesting that perhaps patients with TS who had larger volumes in this region may have had higher cortisol levels; this seems unlikely, however, given the fewer symptoms in those individuals and, as a consequence, the lower levels of emotional stress they would have experienced.
The CA3 neurons project via Schaeffer collaterals to pyramidal cells in CA1, the locus of associative long-term potentiation in the hippocampus. It is also the region where we detected volume decrements and strong inverse correlations with age in children and adults and modest inverse correlations with tic severity in children with TS. The inverse correlations with symptom severity in children in the CA1 region suggest that these morphologic differences from control subjects may be compensatory. These could represent the morphologic correlates of associative learning–based strategies that attenuate symptoms. Alternatively, they could represent some type of neurotoxic effect associated with use of this compensatory strategy, given that CA1 neurons are selectively more sensitive to the toxic effects of glutamate than are other hippocampal subregions.61,62 Finally, volume reduction in CA1 could represent an epiphenomenal, or downstream, effect of the connectivity of CA1 with other brain regions, which includes the basolateral complex in the amygdala and the nucleus accumbens.63
In general, the hippocampus is thought to encode the spatial and temporal relationships between sensory experiences.64-67 Most commonly, this encoding is regarded as supporting spatial memory functions. However, in a much more widely distributed network for learning and memory that includes multiple cortical regions, the basal ganglia, and brainstem, the hippocampus likely supports a much wider range of associative learning.16 This learning, and the neural systems that support it, may include the compensatory responses in brain structure and function that have been documented in the frontal cortices of persons with TS and that are thought to attenuate the severity of tic symptoms.2,18,68-72 The well-documented intimate connections and functional interactions of the hippocampus and frontal cortex suggest that the enlarged dentate gyrus and frontal cortex in persons with TS likely represents the participation of these regions in an extended network of neural compensation and learning that hypertrophies are part of an activity-dependent, neuroplastic response to the chronic need to modulate tic-related symptoms.
AMYGDALA NUCLEI IN THE PATHOGENESIS OF TS
The regional protrusion noted in the amygdala in patients with TS corresponded approximately to the basolateral and centromedian nuclei. The morphologic abnormalities of the lateral aspect of the amygdala, in general, correlated inversely with the severity of tic, OCD, and ADHD symptoms, suggesting that hypertrophy of the basolateral nuclei may serve a generalized compensatory and neuromodulatory function in TS.
The basolateral complex is thought to be a specialized extension of the frontal and temporal cortices.13 With its prominent afferents from the orbitofrontal cortex and its efferent connections to the nucleus accumbens, putamen, and hippocampus, it is thought to assign emotional valence to sensory stimuli73-76 and to play an important role in emotional, aversive, and discriminative learning.76 Its neurons signal the value of specific reinforcers, information that is used subsequently by neurons in the orbitofrontal cortex when firing in anticipation of behavioral reward to guide and reinforce behavior.77 Interaction of the orbitofrontal cortex with the basolateral nucleus is therefore needed to learn reinforcements and to suppress unwanted behaviors.78 Perhaps hypertrophy of the basolateral region reinforces its role in the suppression of these behaviors in persons with TS, thereby helping to modulate their diverse array of tic, OCD, and ADHD symptoms. Although speculative, the role of the basolateral complex in assigning valence to sensory stimuli, together with the importance of sensory stimuli as triggers for the motor behaviors associated with tics and compulsions, suggests that the compensatory hypertrophy of the basolateral complex may help modulate the emotional valence assigned to the somatosensory stimuli that antecede and trigger tics and compulsions.
The central nucleus of the amygdala, in contrast, is thought to be a specialized extension of the striatum. On the basis of its bidirectional connections to autonomic centers in the brainstem, as well as its input from prefrontal, insular, temporal, and olfactory cortices and from almost all other parts of the amygdala and portions of the somatosensory thalamus, one function of the central nucleus14 is thought primarily to be the modulation of emotional and autonomic motor behavior, just as one function of the striatum is to modulate somatic motor behavior.13 Its hypertrophy may complement that of the basolateral nucleus by helping to gate autonomic motor behavior in persons with TS.
WHEN NEURAL COMPENSATION AND PROTECTION FAIL
The reversal in adults with TS of the pattern of compensatory responses in the hippocampus and amygdala detected in children suggests that compensatory responses may have failed in the adults. Recent natural history studies have shown that tic symptoms usually either attenuate substantially or fully remit by early adulthood,44 and the adults in this study, who on average were highly symptomatic, were not representative of the general population of persons who have a lifetime history of TS. Thus, smaller volumes in hippocampal and amygdala subregions in adults with TS are consistent with the persistence of clinically significant tic symptoms, as well as with previous imaging studies that have demonstrated conclusively that symptomatic adults with TS differ prominently in the structure and function of their brains compared with children who have TS.2,3,68,71
Similarly, the smaller regional volumes in the amygdala of females with TS (Figure 5) may represent a failure of this compensatory hypertrophy even in young girls, thereby contributing to their development of clinically significant tic symptoms, unlike most genetically predisposed females whose sex confers relative protection from developing tic disorders.25 The protective effect of female sex could conceivably be mediated by the larger volumes in these same regions detected in control females (Figure 5), normal sex differences that we predict will be seen also in unaffected but genetically predisposed girls. Indeed, local volumes for females in the amygdala were more similar to those of healthy males than they were to volumes of control females, suggesting that the brains of these females with TS may have been relatively masculinized,24 a possibility consistent with previous findings of behavioral and cognitive masculinization in girls and women with TS.79
LIMITATIONS
A limitation of this study is its interpretation of compensatory responses in the context of a cross-sectional design. A longitudinal study of children at high risk for TS is needed to determine whether the identified group differences represent trait or state abnormalities, epiphenomena, or compensatory responses.46 In addition, we did not identify the ultrastructural features of the hippocampus and amygdala that produced the group differences. Postmortem and other in vivo imaging methods, such as magnetic resonance spectroscopy and diffusion tensor imaging, are needed to determine those ultrastructural underpinnings. Furthermore, the correlations of surface morphologic abnormalities with clinical symptoms should be interpreted with caution because they were exploratory and not hypothesis driven. Finally, we cannot discount entirely the possibility that medications or comorbid illnesses contributed to our findings. To account for these possible effects, we included as covariates in the statistical models the diagnoses of ADHD or OCD and various medication classes. In separate analyses, we excluded persons with these comorbid diagnoses or medications and found that neither comorbid diagnoses nor medications appreciably affected our findings.
Acknowledgments
Funding/Support: This work was supported in part by grants MH01232, MH59139, MH068318-01, MH-K02-74677, and MH36197 from the National Institute of Mental Health and by grants from the Tourette Syndrome Association and the National Alliance for Research in Schizophrenia and Affective Disorders, the Suzanne Crosby Murphy Endowment at Columbia University, and the Stanley Scholar Foundation at the New York State Psychiatric Institute.
Footnotes
Financial Disclosure: None reported.
References
- 1.Pauls DL. An update on the genetics of Gilles de la Tourette syndrome. J Psychosom Res. 2003;55(1):7–12. doi: 10.1016/s0022-3999(02)00586-x. [DOI] [PubMed] [Google Scholar]
- 2.Peterson BS, Staib L, Scahill L, Zhang H, Anderson C, Leckman JF, Cohen DJ, Gore JC, Albert J, Webster R. Regional brain and ventricular volumes in Tourette syndrome. Arch Gen Psychiatry. 2001;58(5):427–440. doi: 10.1001/archpsyc.58.5.427. [DOI] [PubMed] [Google Scholar]
- 3.Peterson BS, Thomas P, Kane MJ, Scahill L, Zhang H, Bronen R, King RA, Leckman JF, Staib L. Basal ganglia volumes in patients with Gilles de la Tourette syndrome. Arch Gen Psychiatry. 2003;60(4):415–424. doi: 10.1001/archpsyc.60.4.415. [DOI] [PubMed] [Google Scholar]
- 4.Parent A, Hazrati LN. Functional anatomy of the basal ganglia, I: the corticobasal ganglia-thalamo-cortical loop. Brain Res Brain Res Rev. 1995;20(1):91–127. doi: 10.1016/0165-0173(94)00007-c. [DOI] [PubMed] [Google Scholar]
- 5.Fudge JL, Kunishio K, Walsh P, Richard C, Haber SN. Amygdaloid projections to ventromedial striatal subterritories in the primate. Neuroscience. 2002;110(2):257–275. doi: 10.1016/s0306-4522(01)00546-2. [DOI] [PubMed] [Google Scholar]
- 6.Russchen FT, Bakst I, Amaral DG, Price JL. The amygdalostriatal projections in the monkey: an anterograde tracing study. Brain Res. 1985;329(12):241–257. doi: 10.1016/0006-8993(85)90530-x. [DOI] [PubMed] [Google Scholar]
- 7.Floresco SB, Todd CL, Grace AA. Glutamatergic afferents from the hippocampus to the nucleus accumbens regulate activity of ventral tegmental area dopamine neurons. J Neurosci. 2001;21(13):4915–4922. doi: 10.1523/JNEUROSCI.21-13-04915.2001. [DOI] [PMC free article] [PubMed] [Google Scholar]
- 8.O’Donnell P, Grace AA. Synaptic interactions among excitatory afferents to nucleus accumbens neurons: hippocampal gating of prefrontal cortical input. J Neurosci. 1995;15(5 pt 1):3622–3639. doi: 10.1523/JNEUROSCI.15-05-03622.1995. [DOI] [PMC free article] [PubMed] [Google Scholar]
- 9.Ishikawa A, Nakamura S. Convergence and interaction of hippocampal and amygdalar projections within the prefrontal cortex in the rat. J Neurosci. 2003;23(31):9987–9995. doi: 10.1523/JNEUROSCI.23-31-09987.2003. [DOI] [PMC free article] [PubMed] [Google Scholar]
- 10.Charara A, Grace AA. Dopamine receptor subtypes selectively modulate excitatory afferents from the hippocampus and amygdala to rat nucleus accumbens neurons. Neuropsychopharmacology. 2003;28(8):1412–1421. doi: 10.1038/sj.npp.1300220. [DOI] [PubMed] [Google Scholar]
- 11.West AR, Floresco SB, Charara A, Rosenkranz JA, Grace AA. Electrophysiological interactions between striatal glutamatergic and dopaminergic systems. Ann N Y Acad Sci. 2003;1003:53–74. doi: 10.1196/annals.1300.004. [DOI] [PubMed] [Google Scholar]
- 12.Jackson ME, Moghaddam B. Amygdala regulation of nucleus accumbens dopamine output is governed by the prefrontal cortex. J Neurosci. 2001;21(2):676–681. doi: 10.1523/JNEUROSCI.21-02-00676.2001. [DOI] [PMC free article] [PubMed] [Google Scholar]
- 13.Swanson LW, Petrovich GD. What is the amygdala? Trends Neurosci. 1998;21(8):323–331. doi: 10.1016/s0166-2236(98)01265-x. [DOI] [PubMed] [Google Scholar]
- 14.Balleine BW, Killcross S. Parallel incentive processing: an integrated view of amygdala function. Trends Neurosci. 2006;29(5):272–279. doi: 10.1016/j.tins.2006.03.002. [DOI] [PubMed] [Google Scholar]
- 15.Packard MG, Knowlton BJ. Learning and memory functions of the basal ganglia. Annu Rev Neurosci. 2002;25:563–593. doi: 10.1146/annurev.neuro.25.112701.142937. [DOI] [PubMed] [Google Scholar]
- 16.Atallah HE, Frank MJ, O’Reilly RC. Hippocampus, cortex, and basal ganglia: insights from computational models of complementary learning systems. Neurobiol Learn Mem. 2004;82(3):253–267. doi: 10.1016/j.nlm.2004.06.004. [DOI] [PubMed] [Google Scholar]
- 17.Marsh R, Alexander GM, Packard MG, Zhu H, Wingard JC, Quackenbush G, Peterson BS. Habit learning in Tourette syndrome: a translational neuroscience approach to a developmental psychopathology. Arch Gen Psychiatry. 2004;61(12):1259–1268. doi: 10.1001/archpsyc.61.12.1259. [DOI] [PubMed] [Google Scholar]
- 18.Peterson BS, Skudlarski P, Anderson AW, Zhang H, Gatenby JC, Lacadie CM, Leckman JF, Gore JC. A functional magnetic resonance imaging study of tic suppression in Tourette syndrome. Arch Gen Psychiatry. 1998;55(4):326–333. doi: 10.1001/archpsyc.55.4.326. [DOI] [PubMed] [Google Scholar]
- 19.Baxter MG, Murray EA. The amygdala and reward. Nat Rev Neurosci. 2002;3(7):563–573. doi: 10.1038/nrn875. [DOI] [PubMed] [Google Scholar]
- 20.Poldrack RA, Packard MG. Competition among multiple memory systems: converging evidence from animal and human brain studies. Neuropsychologia. 2003;41(3):245–251. doi: 10.1016/s0028-3932(02)00157-4. [DOI] [PubMed] [Google Scholar]
- 21.Peterson BS, Leckman JF, Scahill L, Naftolin F, Keefe D, Charest NJ, Cohen DJ. Steroid hormones and CNS sexual dimorphisms modulate symptom expression in Tourette’s syndrome. Psychoneuroendocrinology. 1992;17(6):553–563. doi: 10.1016/0306-4530(92)90015-y. [DOI] [PubMed] [Google Scholar]
- 22.Peterson BS, Zhang H, Anderson GM, Leckman JF. A double-blind, placebo-controlled, crossover trial of an antiandrogen in the treatment of Tourette’s syndrome. J Clin Psychopharmacol. 1998;18(4):324–331. doi: 10.1097/00004714-199808000-00013. [DOI] [PubMed] [Google Scholar]
- 23.Burd L, Kerbeshian J, Wikenheiser M, Fisher W. A prevalence study of Gilles de la Tourette syndrome in North Dakota school-age children. J Am Acad Child Psychiatry. 1986;25(4):552–553. doi: 10.1016/s0002-7138(10)60016-7. [DOI] [PubMed] [Google Scholar]
- 24.Alexander GM, Peterson BS. Sex steroids and human behavior: implications for developmental psychopathology. CNS Spectr. 2001;6(1):75–88. doi: 10.1017/s1092852900022896. [DOI] [PubMed] [Google Scholar]
- 25.Spessot AL, Peterson BS. Tourette syndrome: a multifactorial, developmental pychopathology. In: Cicchetti D, Cohen DJ, editors. Manual of Developmental Psychopathology. 2. Vol. 3. New York, NY: John Wiley & Sons; 2006. pp. 436–469. [Google Scholar]
- 26.Peterson BS. Neuroimaging studies of Tourette syndrome: a decade of progress. Adv Neurol. 2001;85:179–196. [PubMed] [Google Scholar]
- 27.American Psychiatric Association. Diagnostic and Statistical Manual of Mental Disorders. 4. Washington, DC: American Psychiatric Association; 2000. text rev. [Google Scholar]
- 28.Kaufman J, Birmaher B, Brent D, Rao U, Flynn C, Moreci P, Williamson D, Ryan N. Schedule for Affective Disorders and Schizophrenia for School-Age Children–Present and Lifetime Version (K-SADS-PL): initial reliability and validity data. J Am Acad Child Adolesc Psychiatry. 1997;36(7):980–988. doi: 10.1097/00004583-199707000-00021. [DOI] [PubMed] [Google Scholar]
- 29.Endicott J, Spitzer RL. A diagnostic interview: the Schedule for Affective Disorders and Schizophrenia. Arch Gen Psychiatry. 1978;35(7):837–844. doi: 10.1001/archpsyc.1978.01770310043002. [DOI] [PubMed] [Google Scholar]
- 30.Leckman JF, Riddle MA, Hardin MT, Ort SI, Swartz KL, Stevenson J, Cohen DJ. The Yale Global Tic Severity Scale: initial testing of a clinician-rated scale of tic severity. J Am Acad Child Adolesc Psychiatry. 1989;28(4):566–573. doi: 10.1097/00004583-198907000-00015. [DOI] [PubMed] [Google Scholar]
- 31.Scahill L, Riddle MA, McSwiggin-Hardin M, Ort SI, King RA, Goodman WK, Cicchetti D, Leckman JF. Children’s Yale-Brown Obsessive Compulsive Scale: reliability and validity. J Am Acad Child Adolesc Psychiatry. 1997;36(6):844–852. doi: 10.1097/00004583-199706000-00023. [DOI] [PubMed] [Google Scholar]
- 32.DuPaul GJ. Parent and teacher ratings of ADHD symptoms: psychometric properties in a community-based sample. J Clin Child Psychol. 1991;20:245–253. [Google Scholar]
- 33.Kaufman AS, Kaufman NL. Kaufman Brief Intelligence Test Manual. Circle Pines, MN: American Guidance Service; 1990. [Google Scholar]
- 34.Wechsler D. WAIS-R Manual: Wechsler Adult Intelligence Scale–Revised. San Antonio, TX: Psychological Corp; 1981. [Google Scholar]
- 35.Hollinghead A. Four-Factor Index of Social Status. New Haven, CT: Yale University Press; 1975. [Google Scholar]
- 36.Sled JG, Zijdenbos AP, Evans AC. A nonparametric method for automatic correction of intensity nonuniformity in MRI data. IEEE Trans Med Imaging. 1998;17(1):87–97. doi: 10.1109/42.668698. [DOI] [PubMed] [Google Scholar]
- 37.Kates WR, Abrams MT, Kaufmann WE, Breiter SN, Reiss AL. Reliability and validity of MRI measurement of the amygdala and hippocampus in children with fragile X syndrome. Psychiatry Res. 1997;75(1):31–48. doi: 10.1016/s0925-4927(97)00019-x. [DOI] [PubMed] [Google Scholar]
- 38.Watson C, Andermann F, Gloor P, Jones-Gotman M, Peters T, Evans A, Olivier A, Melanson D, Leroux G. Anatomic basis of amygdaloid and hippocampal volume measurement by magnetic resonance imaging. Neurology. 1992;42(9):1743–1750. doi: 10.1212/wnl.42.9.1743. [DOI] [PubMed] [Google Scholar]
- 39.Plessen KJ, Bansal R, Zhu H, Whiteman R, Amat J, Quackenbush GA, Martin L, Durkin K, Blair C, Royal J, Hugdahl K, Peterson BS. Hippocampus and amygdala morphology in attention-deficit/hyperactivity disorder. Arch Gen Psychiatry. 2006;63(7):795–807. doi: 10.1001/archpsyc.63.7.795. [DOI] [PMC free article] [PubMed] [Google Scholar]
- 40.Bansal R, Staib LH, Whiteman R, Wang YM, Peterson BS. ROC-based assessments of 3D cortical surface-matching algorithms. Neuroimage. 2005;24(1):150–162. doi: 10.1016/j.neuroimage.2004.08.054. [DOI] [PubMed] [Google Scholar]
- 41.Ludolph AG, Juengling FD, Libal G, Ludolph AC, Fegert JM, Kassubek J. Grey-matter abnormalities in boys with Tourette syndrome: magnetic resonance imaging study using optimised voxel-based morphometry. Br J Psychiatry. 2006;188:484–485. doi: 10.1192/bjp.bp.105.008813. [DOI] [PubMed] [Google Scholar]
- 42.Garraux G, Goldfine A, Bohlhalter S, Lerner A, Hanakawa T, Hallett M. Increased midbrain gray matter in Tourette’s syndrome. Ann Neurol. 2006;59(2):381–385. doi: 10.1002/ana.20765. [DOI] [PubMed] [Google Scholar]
- 43.Bansal R, Staib LH, Xu D, Zhu H, Peterson BS. Statistical analyses of brain surfaces using Gaussian random fields on 2-D manifolds. IEEE Trans Med Imaging. 2007;26(1):46–57. doi: 10.1109/TMI.2006.884187. [DOI] [PMC free article] [PubMed] [Google Scholar]
- 44.Leckman JF, Zhang H, Vitale A, Lahnin F, Lynch K, Bondi C, Kim YS, Peterson BS. Course of tic severity in Tourette syndrome: the first two decades. Pediatrics. 1998;102(1 pt 1):14–19. doi: 10.1542/peds.102.1.14. [DOI] [PubMed] [Google Scholar]
- 45.Peterson BS, Leckman JF, Arnsten A, Anderson G, Staib LH, Gore JC, Bronen RA, Malison R, Scahill L, Cohen DJ. Neuroanatomical circuitry. In: Leckman JF, Cohen DJ, editors. Tourette Syndrome: Tics, Obsessions, Compulsions: Developmental Psychopathology and Clinical Care. New York, NY: John Wiley & Sons; 1999. pp. 230–260. [Google Scholar]
- 46.Peterson BS. Conceptual, methodological, and statistical challenges in brain imaging studies of developmentally based psychopathologies. Dev Psychopathol. 2003;15(3):811–832. doi: 10.1017/s0954579403000385. [DOI] [PubMed] [Google Scholar]
- 47.Eriksson PS, Perfilieva E, Bjork-Eriksson T, Alborn AM, Nordborg C, Peterson DA, Gage FH. Neurogenesis in the adult human hippocampus. Nat Med. 1998;4(11):1313–1317. doi: 10.1038/3305. [DOI] [PubMed] [Google Scholar]
- 48.Christie BR, Cameron HA. Neurogenesis in the adult hippocampus. Hippocampus. 2006;16(3):199–207. doi: 10.1002/hipo.20151. [DOI] [PubMed] [Google Scholar]
- 49.van Praag H, Shubert T, Zhao C, Gage FH. Exercise enhances learning and hippocampal neurogenesis in aged mice. J Neurosci. 2005;25(38):8680–8685. doi: 10.1523/JNEUROSCI.1731-05.2005. [DOI] [PMC free article] [PubMed] [Google Scholar]
- 50.Bruel-Jungerman E, Davis S, Rampon C, Laroche S. Long-term potentiation enhances neurogenesis in the adult dentate gyrus. J Neurosci. 2006;26(22):5888–5893. doi: 10.1523/JNEUROSCI.0782-06.2006. [DOI] [PMC free article] [PubMed] [Google Scholar]
- 51.Kempermann G, Gage FH. Neurogenesis in the adult hippocampus. Novartis Found Symp. 2000;231:220–235. [PubMed] [Google Scholar]
- 52.Kempermann G, Kuhn HG, Gage FH. More hippocampal neurons in adult mice living in an enriched environment. Nature. 1997;386(6624):493–495. doi: 10.1038/386493a0. [DOI] [PubMed] [Google Scholar]
- 53.Cameron HA, McKay RD. Adult neurogenesis produces a large pool of new granule cells in the dentate gyrus. J Comp Neurol. 2001;435(4):406–417. doi: 10.1002/cne.1040. [DOI] [PubMed] [Google Scholar]
- 54.Nicoll RA, Schmitz D. Synaptic plasticity at hippocampal mossy fibre synapses. Nat Rev Neurosci. 2005;6(11):863–876. doi: 10.1038/nrn1786. [DOI] [PubMed] [Google Scholar]
- 55.Segovia G, Yague AG, Garcia-Verdugo JM, Mora F. Environmental enrichment promotes neurogenesis and changes the extracellular concentrations of glutamate and GABA in the hippocampus of aged rats. Brain Res Bull. 2006;70(1):8–14. doi: 10.1016/j.brainresbull.2005.11.005. [DOI] [PubMed] [Google Scholar]
- 56.van Praag H, Kempermann G, Gage FH. Running increases cell proliferation and neurogenesis in the adult mouse dentate gyrus. Nat Neurosci. 1999;2(3):266–270. doi: 10.1038/6368. [DOI] [PubMed] [Google Scholar]
- 57.Ge S, Pradhan DA, Ming GL, Song H. GABA sets the tempo for activity-dependent adult neurogenesis. Trends Neurosci. 2007;30(1):1–8. doi: 10.1016/j.tins.2006.11.001. [DOI] [PubMed] [Google Scholar]
- 58.Uda M, Ishido M, Kami K, Masuhara M. Effects of chronic treadmill running on neurogenesis in the dentate gyrus of the hippocampus of adult rat. Brain Res. 2006;1104(1):64–72. doi: 10.1016/j.brainres.2006.05.066. [DOI] [PubMed] [Google Scholar]
- 59.Voermans NC, Petersson KM, Daudey L, Weber B, Van Spaendonck KP, Kremer HP, Fernandez G. Interaction between the human hippocampus and the caudate nucleus during route recognition. Neuron. 2004;43(3):427–435. doi: 10.1016/j.neuron.2004.07.009. [DOI] [PubMed] [Google Scholar]
- 60.Wiedenmayer CP, Bansal R, Anderson GM, Zhu H, Amat J, Whiteman R, Peterson BS. Cortisol levels and hippocampus volumes in healthy preadolescent children. Biol Psychiatry. 2006;60(8):856–861. doi: 10.1016/j.biopsych.2006.02.011. [DOI] [PMC free article] [PubMed] [Google Scholar]
- 61.Ritchie LJ, De Butte M, Pappas BA. Chronic mild stress exacerbates the effects of permanent bilateral common carotid artery occlusion on CA1 neurons. Brain Res. 2004;1014(12):228–235. doi: 10.1016/j.brainres.2004.04.036. [DOI] [PubMed] [Google Scholar]
- 62.Katsuta K, Umemura K, Ueyama N, Matsuoka N. Pharmacological evidence for a correlation between hippocampal CA1 cell damage and hyperlocomotion following global cerebral ischemia in gerbils. Eur J Pharmacol. 2003;467(13):103–109. doi: 10.1016/s0014-2999(03)01573-5. [DOI] [PubMed] [Google Scholar]
- 63.Patton PE, McNaughton B. Connection matrix of the hippocampal formation, I: the dentate gyrus. Hippocampus. 1995;5(4):245–286. doi: 10.1002/hipo.450050402. [DOI] [PubMed] [Google Scholar]
- 64.Bast T, Feldon J. Hippocampal modulation of sensorimotor processes. Prog Neurobiol. 2003;70(4):319–345. doi: 10.1016/s0301-0082(03)00112-6. [DOI] [PubMed] [Google Scholar]
- 65.Shors TJ. Memory traces of trace memories: neurogenesis, synaptogenesis and awareness. Trends Neurosci. 2004;27(5):250–256. doi: 10.1016/j.tins.2004.03.007. [DOI] [PMC free article] [PubMed] [Google Scholar]
- 66.Agster KL, Fortin NJ, Eichenbaum H. The hippocampus and disambiguation of overlapping sequences. J Neurosci. 2002;22(13):5760–5768. doi: 10.1523/JNEUROSCI.22-13-05760.2002. [DOI] [PMC free article] [PubMed] [Google Scholar]
- 67.Moser MB, Moser EI. Functional differentiation in the hippocampus. Hippocampus. 1998;8(6):608–619. doi: 10.1002/(SICI)1098-1063(1998)8:6<608::AID-HIPO3>3.0.CO;2-7. [DOI] [PubMed] [Google Scholar]
- 68.Plessen KJ, Wentzel-Larsen T, Hugdahl K, Feineigle P, Klein J, Staib LH, Leckman JF, Bansal R, Peterson BS. Altered interhemispheric connectivity in individuals with Tourette’s Disorder. Am J Psychiatry. 2004;161(11):2028–2037. doi: 10.1176/appi.ajp.161.11.2028. [DOI] [PubMed] [Google Scholar]
- 69.Plessen KJ, Gruner R, Lundervold A, Hirsch JG, Xu D, Bansal R, Hammar A, Lundervold AJ, Wentzel-Larsen T, Lie SA, Gass A, Peterson BS, Hugdahl K. Reduced white matter connectivity in the corpus callosum of children with Tourette syndrome. J Child Psychol Psychiatry. 2006;47(10):1013–1022. doi: 10.1111/j.1469-7610.2006.01639.x. [DOI] [PMC free article] [PubMed] [Google Scholar]
- 70.Fredericksen KA, Cutting LE, Kates WR, Mostofsky SH, Singer HS, Cooper KL, Lanham DC, Denckla MB, Kaufmann WE. Disproportionate increases of white matter in right frontal lobe in Tourette syndrome. Neurology. 2002;58(1):85–89. doi: 10.1212/wnl.58.1.85. [DOI] [PubMed] [Google Scholar]
- 71.Marsh R, Zhu H, Wang Z, Skudlarski P, Peterson BS. A developmental fMRI study of self-regulatory control in Tourette’s syndrome. Am J Psychiatry. 2007;164(6):955–966. doi: 10.1176/appi.ajp.164.6.955. [DOI] [PMC free article] [PubMed] [Google Scholar]
- 72.Spessot AL, Plessen KJ, Peterson BS. Neuroimaging of developmental psychopathologies: the importance of self-regulatory and neuroplastic processes in adolescence. Ann N Y Acad Sci. 2004;1021:86–104. doi: 10.1196/annals.1308.010. [DOI] [PubMed] [Google Scholar]
- 73.Winstanley CA, Theobald DE, Cardinal RN, Robbins TW. Contrasting roles of basolateral amygdala and orbitofrontal cortex in impulsive choice. J Neurosci. 2004;24(20):4718–4722. doi: 10.1523/JNEUROSCI.5606-03.2004. [DOI] [PMC free article] [PubMed] [Google Scholar]
- 74.Bechara A, Damasio H, Damasio AR, Lee GP. Different contributions of the human amygdala and ventromedial prefrontal cortex to decision-making. J Neurosci. 1999;19(13):5473–5481. doi: 10.1523/JNEUROSCI.19-13-05473.1999. [DOI] [PMC free article] [PubMed] [Google Scholar]
- 75.Bechara A, Damasio H, Damasio AR. Role of the amygdala in decision-making. Ann N Y Acad Sci. 2003;985:356–369. doi: 10.1111/j.1749-6632.2003.tb07094.x. [DOI] [PubMed] [Google Scholar]
- 76.Cardinal RN, Parkinson JA, Hall J, Everitt BJ. Emotion and motivation: the role of the amygdala, ventral striatum, and prefrontal cortex. Neurosci Biobehav Rev. 2002;26(3):321–352. doi: 10.1016/s0149-7634(02)00007-6. [DOI] [PubMed] [Google Scholar]
- 77.Pickens CL, Saddoris MP, Setlow B, Gallagher M, Holland PC, Schoenbaum G. Different roles for orbitofrontal cortex and basolateral amygdala in a reinforcer devaluation task. J Neurosci. 2003;23(35):11078–11084. doi: 10.1523/JNEUROSCI.23-35-11078.2003. [DOI] [PMC free article] [PubMed] [Google Scholar]
- 78.Elliott R, Dolan RJ, Frith CD. Dissociable functions in the medial and lateral orbitofrontal cortex: evidence from human neuroimaging studies. Cereb Cortex. 2000;10(3):308–317. doi: 10.1093/cercor/10.3.308. [DOI] [PubMed] [Google Scholar]
- 79.Alexander GM, Peterson BS. Testing the prenatal hormone hypothesis of tic-related disorders: gender identity and gender role behavior. Dev Psychopathol. 2004;16(2):407–420. doi: 10.1017/s095457940404458x. [DOI] [PubMed] [Google Scholar]