Abstract
The emu is a large, (bipedal) flightless bird that potentially can be used to study various orthopaedic disorders in which load protection of the experimental limb is a limitation of quadrupedal models. An anatomy-based analysis of normal emu walking gait was undertaken to determine hip contact forces for comparison with human data. Kinematic and kinetic data captured for two laboratory-habituated emus were used to drive the model. Muscle attachment data were obtained by dissection, and bony geometries were obtained by CT scan. Inverse dynamics calculations at all major lower-limb joints were used in conjunction with optimization of muscle forces to determine hip contact forces. Like human walking gait, emu ground reaction forces showed a bimodal distribution over the course of the stance phase. Two-bird averaged maximum hip contact force was approximately 5.5 times body weight, directed nominally axially along the femur. This value is only modestly larger than optimization-based hip contact forces reported in literature for humans. The interspecies similarity in hip contact forces makes the emu a biomechanically attractive animal in which to model loading-dependent human orthopaedic hip disorders.
Keywords: Emu, Gait Analysis, Kinematics, Contact Forces
Introduction
Appropriately conceived animal models can replicate the development, progression, and natural history of human health disorders, thus enabling systematic, controlled study of pathogenesis and treatment options. In many orthopaedic conditions, mechanical demand is intimately linked to disease development and outcome. Therefore, besides modeling the biological progression of a disease, animal models of loading-influenced orthopaedic conditions ideally should mimic the mechanical demand present in the human. Any appreciable differences from the human loading environment should be taken into account when interpreting results from the model.
Species traditionally used for modeling orthopaedic disorders (commonly mice, rats, rabbits, cats, dogs, goats, sheep, swine, and cattle) have the obvious drawback of being quadrupedal. Quadrupeds have the option to load-protect a (painful) study limb, to variable degrees that are difficult to reliably assess. Primates have only rarely been used for modeling orthopaedic disorders because of ethical concerns and prohibitive expense. They also require substantial training to make their bipedal locomotion resemble that of humans, and they tend to revert to quadrupedal or tripedal (addition of one arm) locomotion in stressful situations (D’Aout et al. 2004; Hirasaki et al. 2004). Various quadrupeds can be constrained to bipedal locomotion (e.g. hindlimb unloading or forelimb removal rodent models), but this involves non-physiologic joint loading and can induce confounding systemic changes (Bailey et al. 2001; Morey-Holton and Globus 2002).
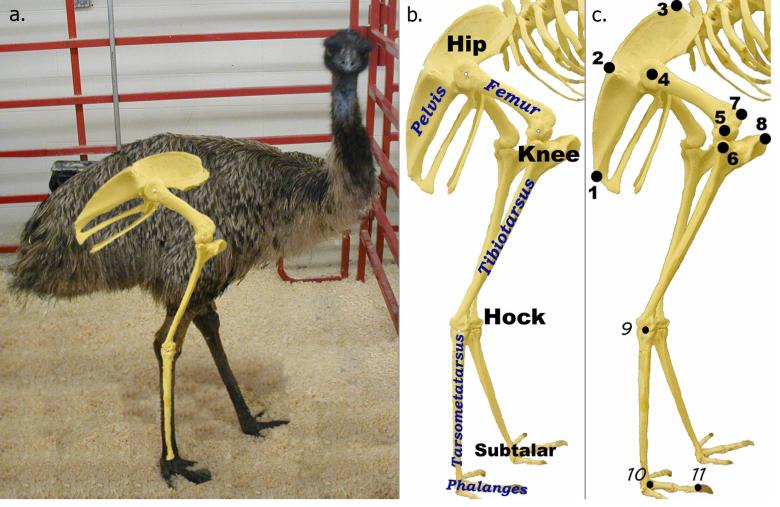
The need for a bipedal animal model in orthopaedic research is such that non-traditional species merit exploration. Emus (Figure 1a) are large (∼40kg) migratory flightless birds originating from the more arid regions of Australia. As large bipeds, emus are attractive for modeling weight-bearing orthopaedic disease conditions because of easy availability (commercially farmed for their meat and oils) and predisposition to persistent joint loading, even in the case of pathological challenge (Troy et al. 2007).
Figure 1.
a.) Photograph of an emu with the lower limb bones superimposed for reference. b.) Emu lower limb bony anatomy. c.) Locations of kinematic data capture markers with respect to the bony anatomy. Locations 9-11 were easily visualized and did not receive an external marker.
While the emu’s bipedality is appealing, its femur is relatively short, its (fused) tarsometatarsus is relatively long, and all of its lower extremity joints operate in a higher degree of flexion (albeit in a less flexed orientation than most quadrupedal and other avian species) than do human joints (Figure 1). Such anatomic differences potentially involve appreciably different effective joint loading (Alexander 2004). While joint contact forces have been extensively investigated in various traditional quadrupedal animal models of orthopaedic disorders (Page et al. 1993; Rumph et al. 1995; Bergmann et al. 1999), biomechanical investigations of avian species have focused more on comparative kinematics, energetics, and bone development (Carrano and Biewener 1999; Main and Biewener 2007). Therefore, an anatomy-based model of normal emu walking gait was developed to determine emu hip contact forces for comparison to those of the human.
Methods
All emus used in this work were handled according to IACUC-approved procedures. Farm-raised emus are semi-domesticated animals that tend to be apprehensive of humans, thus posing difficulties for laboratory gait analysis. To overcome that problem, two hatchlings - Emu #1 (adult size: 30kg) and Emu #2 (adult size: 36kg) - were reared to skeletal maturity while being habituated to a gait laboratory setting by daily, leashed training walks and frequent caretaker handling. Four additional emus habituated during the same time period unfortunately died just prior to data collection. Due to the amount of training required to habituate emus and the extended time to skeletal maturity (1 year), kinematic and kinetic data collection was limited to the two surviving animals.
Kinematic and kinetic data capture was performed on the right legs of these two habituated emus during normal level walking. Eight retro-reflective markers were attached with double-sided tape to the (locally) plucked skin of each animal (Figure 1c): three on the pelvis, three on the femur and two on the tibiotarsus. The hock, subtalar, and distal second interphalangeal joint centers were readily visible discrete locations, digitizable without need for reflective markers.
Three video cameras were used to image the emus as they walked at a self-selected speed across a carpet-covered force platform. When the force platform sensed 10 N of vertical force, a synchronization box triggered two light emitting diodes in the camera field of view. Video frames were split so that markers were digitized at 60Hz and the marker trajectories were Butterworth filtered using a 6 Hz low pass cutoff frequency. Force data were sampled at 600 Hz, Butterworth filtered at 15 Hz, and down-sampled to match the kinematic sampling rate. Three-dimensional marker trajectories were obtained by direct linear transform, and hip and knee angles were obtained by calculating Cardan angles using flexion→adduction→endorotation ordering of the distal segment with respect to the proximal. Flexion angles for the hock and subtalar joint were calculated in the plane of progression as defined by the pelvis.
Based on anatomic dissections (see below), the hip center was found to be coincident with moving the coordinates of the trochanter surface marker (#4) inward a distance equal to the depth of the femoral head within the body plus ½ the surface marker diameter (6.5 and 7.5 centimeters for Emu #1 and Emu #2 respectively). The knee center was defined as the average (in the vertical and A-P directions) of the distal femoral and proximal tibiotarsal markers and as the M-L coordinate of the patellar tuberosity marker (in the M-L direction) during the standing trial when the limb is assumed to be aligned in the global coordinate system’s sagittal plane. This location was transformed into the local tibiotarsal reference system creating a virtual point that was assumed to remain stationary within this coordinate system during dynamic activity.
To determine the locations of muscle attachment with respect to the bones, a detailed dissection was performed on a sacrificial bird (Emu #3) of similar size to those used for kinematic data capture. The dissection was performed immediately after sacrifice with the limbs oriented in an unconstrained, naturally flexed position. Following an established naming convention for emu lower limb musculature (Patak and Baldwin 1998), each identified muscle was tagged with color-coded metallic screws at its origin, at its insertion, and at any wrapping points of tendon around a joint or muscle around a bone. Muscle (belly and tendon) length and fiber pennation angle were measured in situ, and muscle mass was determined by weighing following excision. Thirty-three individual muscles originating from the pelvis or from further distally were thus identified, measured, and marked during the dissection. Based on the size of the muscle origin, eleven muscles were later subdivided and analyzed as separate segments (total of 50 muscle segments). After dissection, additional markers were added to the pelvis, femur, and tibiotarsus for definition of bony coordinate systems (detailed description included in the Appendix). No additional markers were added to the tarsometatarsus or to the foot.
Because the majority of the muscle mass attaching to the tarsometatarsus and the foot attached through a few large tendons, coordinates of muscle insertions on these bones were determined by direct physical measurement of the screw markers in relation to bony anatomy. Coordinates for the proximal segments were obtained by using a biplanar radiography method (Conzemius et al. 1994). The screw-marked pelvis, femur, and tibia were mounted in a wire calibration cage for orthogonal biplanar radiography. Resulting radiographs of the screw-marked pelvis and lower limb bones were digitized on a large-format x-ray scanner (CobraScan CX-612T). On the two matching orthogonal views of each lower limb bone and of the pelvis, screw marker locations were identified and the corresponding 2D coordinates were obtained (Pedersen et al. 1991). Coordinates of the markers for the centers of the acetabulum, femoral head, plateau markers, and condyle markers were also identified on these matching films to establish origins of local bony coordinate systems. Three-dimensional coordinates of muscle origins, insertions, and wrapping points were calculated from the 2D coordinates of matching screw marker sets using the fiducial markings on the calibration cage (Brand et al. 1982; Pedersen et al. 1991). Coordinates of muscles originating from the pelvis were referenced to an acetabulum-based coordinate system. Muscles with attachments to the femur, tibiotarsus, tarsometatarsus, and phalanges were referenced to coordinate systems centered at the femoral head center, knee center, hock center, and midpoint (of the 3) phangeal joint centers, respectively.
Following muscle coordinate determination, all bones were individually CT scanned to obtain bony geometry. Triangulated representations of bony surfaces were imported into SIMM (MusculoGraphics, Inc., Santa Rosa, CA). Physiologic cross sectional areas (PCSA) were calculated for each muscle by dividing muscle volume by optimal fiber length (approximated as the fiber length during stance), and used to estimate maximal possible isometric forces by multiplying each muscle’s PCSA by 30 N/cm2 (Nelson et al. 2004). These maximal forces, muscle pennation angles, optimal fiber lengths, tendon slack lengths (measured tendon length at rest in situ), and three-dimensional muscle coordinates relative to the bones were also input to SIMM. Motion data used to drive the model came from the kinematic data collection. Invoking the Wrapping Objects and Wrapping Points options in SIMM, lines of muscle action were constrained to wrap around all bones, joints, and deep muscle layers.
Output from the SIMM model included length-velocity-adjusted maximal dynamic muscle forces (MDMF), muscle moment arms, and muscle orientations at each 1% of stance. Sagittal, frontal and transverse plane moment arms were exported for each muscle crossing the hip. Sagittal plane moment arms were exported for the knee, hock, and subtalar joints. Values of MDMF were determined using the standard SIMM length-tension and force-velocity curves with the maximal velocity set to 15 muscle lengths/sec, based on values measured for turkeys (Hill 1925; Nelson et al. 2004).
Lower limb segment centers of mass and moments of inertia were measured experimentally. Lower limbs were harvested from two additional sacrificial birds (Emus #4 & #5), also of comparable size to the two habituated emus (#1 & #2) used for the gait analysis. The individual limb segments (femoral, tibiotarsal, tarsometatarsal, phalangeal) were disarticulated and immediately frozen. Each frozen segment was balanced on a sharp edge, and the intersection of three orthogonal balancing axes determined the center of mass location. Center of mass location was normalized to segment length for future scaling to other subjects. Moments of inertia were determined around the three principal anatomic axes for the frozen segments using a custom-built torsional pendulum. The segment center of mass was positioned under the monofilament wire of the torsional pendulum, the construct was perturbed, and the oscillation period was timed. Five replicate trials were run with each segment, after which it was removed from the pendulum and reoriented for testing around the next axis. Inertial values were used to calculate radii of gyration for each limb segment, which were averaged between emus #4 and #5 so as to obtain a single value for each segment (around each of 3 axes).
Inverse dynamics calculations were then performed to determine overall intersegmental reaction forces and moments at each of the lower limb joints. Calculation of the 50 individual muscle forces (Fm) from the statically indeterminate problem was carried out by a constrained, nonlinear optimization method (fmincon in MATLAB). Muscle forces were required to satisfy all components of moment equilibrium at the hip. At the knee, hock, and subtalar joints, the flexion/extension axes tend to be externally rotated relative to the sagittal plane, causing the majority of out-of-plane movement to be attributed to flexion extension around that rotated axis (Rubenson et al. 2007). For the purposes of optimization, it was assumed that ligaments, joint geometry, and rotated functional axes satisfied abduction/adduction and internal/external rotational equlibrium, so the muscles were required only to equillibrate the dominant flexion/extension moment. Tendon strain was automatically incorporated within SIMM for calculations of MDMF, and was not explicitly addressed during the remainder of the optimization procedure.
For the optimization, the imposed linear equality was , where is the muscle forces, is the moment arms, and b is the joint moment. Muscle forces were initialized to have a lower bound of 0 and an upper bound of the length-velocity-based MDMF (output previously from SIMM). Subsequent iterations adjusted the upper and lower bounds to prevent non-physiological increases or decreases in muscle force. Based on equations described by Pierrynowski and Morrison (1985) for physiologically realistic speeds of muscle activation, the lower bound was constrained by q - (1 - e-dt / tdown)* q and the upper bound was constrained by q + (1 - e-dt / tup)*(1 - q), where , dt is the time step, tup=0.003 sec, and tdown=0.034 sec. The cost function minimized was the sum of muscle stresses squared , which maximized muscle endurance (Pedersen et al. 1987). This criterion included synergistic and antagonistic muscle activity.
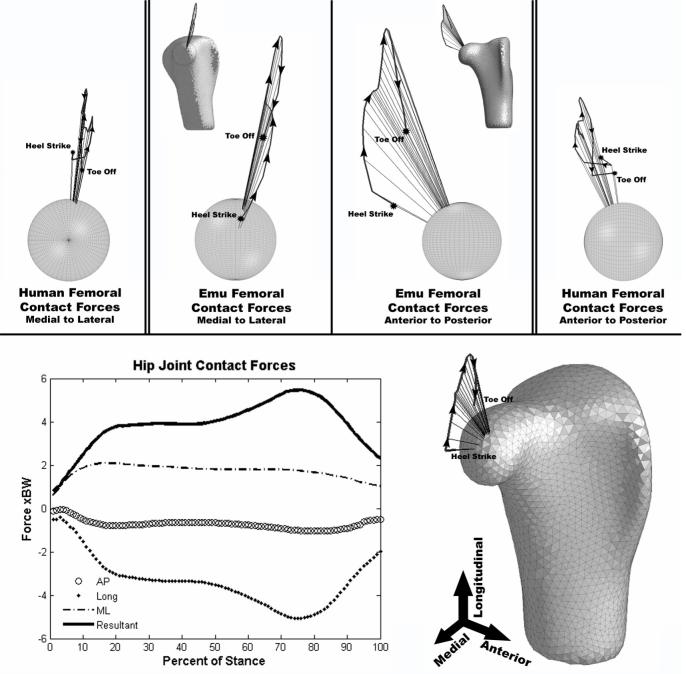
Hip joint contact forces were determined by (vectorially) summing joint reaction forces with individual muscle forces in those muscle segments crossing the hip joint. Contact forces were decomposed into longitudinal, anterior-posterior, and medial-lateral components.
Results
Average velocities of five trials for the two individual (trained) emus walking at self-selected speeds were 1.14 ± 0.27 m/s and 1.34 ± 0.26 m/s respectively. The average stance time was 0.86 ± 0.10 seconds for Emu #1 and 0.67 ± 0.15 seconds for Emu #2. Vertical ground reaction forces of both animals demonstrated a bimodal time variation (Figure 2), with peaks equal to approximately two times body weight. For Emu #1, the first peak was moderately larger than the second, and conversely for Emu #2.
Figure 2.
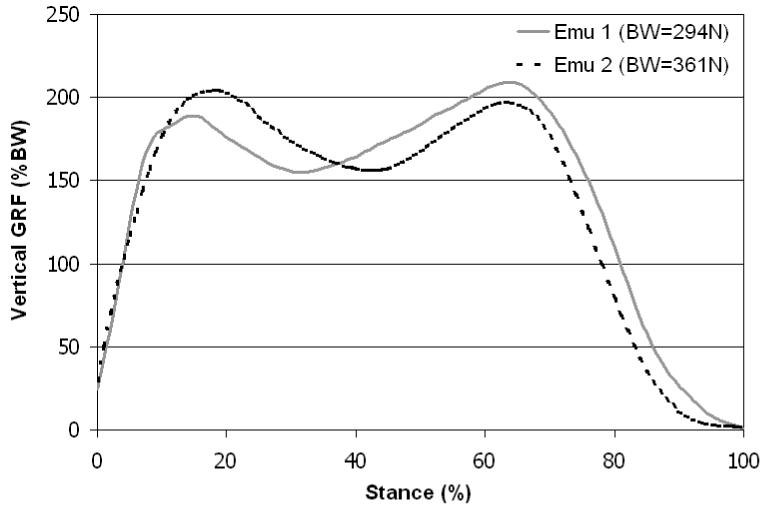
Ground reaction forces of two emus normalized by body weight. Curves are averages of 5 walking trials. Velocity of Emu #1 was 1.14 ± 0.27 m/s, and velocity of Emu #2 was 1.34 ± 0.26 m/s.
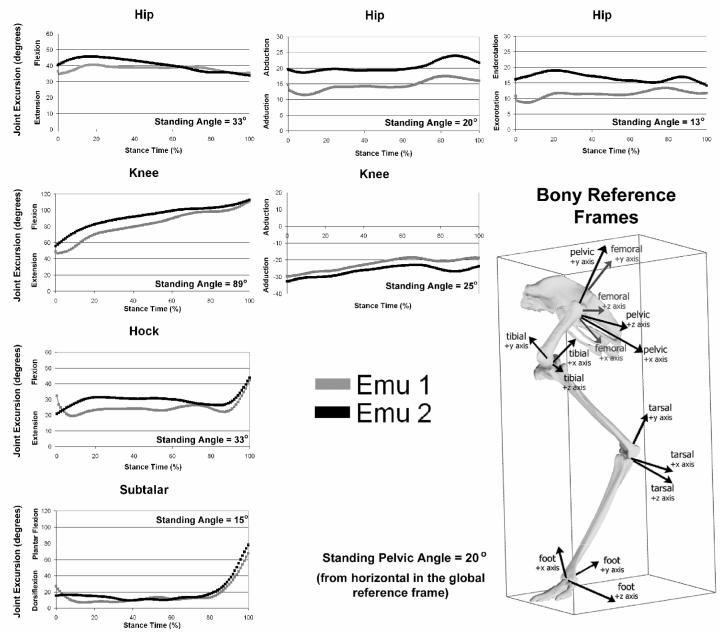
Joint excursion angles for the major lower limb joints are shown in Figure 3. During stance phase, the vast majority of lower limb motion was in the sagittal plane. There was a small range of flexion/extension excursion (9 degrees total) at the hip and substantially more at the knee (60 degrees total). Significant flexion/extension excursion ranges occurred at both the hock (23 degrees) and the subtalar joint (65 degrees). Non-sagittal-plane motion excursions at the hip were relatively small, with an average range of 6 degrees abduction/adduction motion and 5 degrees of internal/external rotation.
Figure 3.
Joint excursion angles at the hip and the knee for the two habituated emus. Each curve represents the average of the 5 walking trials for the given bird. All angles are relative to the proximal segment, and the pelvis sits at an angle of 20° from horizontal. Flexion angles are rotations about the z-axes, abduction angles are rotations about the x axes, and long-axis rotation angles are about the y-axes. Standing trial angles are averages from the two birds.
Three-dimensional coordinates of individual muscle origins and insertions relative to local bony reference frames, MDMFs, and maximum average moment arms are listed in the Appendix. Segmental inertial properties are summarized in Tables 1 and 2. Propagation of inertial property errors (e.g. those resulting from decisions about which muscles to include in each segment) through intersegmental force calculations was likely negligible, due to the small excursion angles made by the more muscular proximal segments. In the tarsometatarsus and phalanges, the small amount of muscle mass consisted predominately of tendinous extensions of more proximal muscles, so inertial errors resulting from decisions about which tissues to include in a given distal segment were likely small.
Table 1.
Locations of the center of mass of individual limb segments relative to the proximal joint center. The center of mass is expressed as a percentage of the limb length along each segment’s local anatomic axes
| Segment | Axis Direction | Distance | Location |
|---|---|---|---|
| Femoral | Longitudinal | 33 % | Distal to femoral head |
| Anterior - Posterior | 0 % | Anterior to femoral head | |
| Medial - Lateral | 34 % | Lateral to femoral head | |
| Tibiotarsal | Longitudinal | 29 % | Distal to knee center |
| Anterior - Posterior | 6 % | Anterior to knee center | |
| Medial - Lateral | 24 % | Lateral to knee center | |
| Tarsometatarsal | Longitudinal | 38 % | Distal to hock center |
| Anterior - Posterior | 32 % | Posterior to hock center | |
| Medial - Lateral | 2 % | Medial to hock center | |
| Phalangeal | Longitudinal | 30 % | Anterior to joint center |
| Superior - Interior | 33 % | Superior to bottom of foot | |
| Medial - Lateral | 7 % | Medial to joint center |
Table 2.
Inertial data of individual limb segments around local (segmental) axes. The moments of inertia are taken around the segmental center of mass
| Length | Weight | Moment of Inertia (Kg/m^2) | |||
|---|---|---|---|---|---|
| Segment | cm | kg | Med/Lat | Sup/Inf | Ant/Post |
| Femoral | 25 | 2.7 | 0.0166 | 0.0090 | 0.0096 |
| Tibiotarsal | 42 | 3.0 | 0.0306 | 0.0076 | 0.0271 |
| Tarsometatarsal | 41 | 0.7 | 0.0093 | 0.0002 | 0.0093 |
| Phalangeal | 19 | 0.3 | 0.0004 | 0.0001 | 0.0005 |
Average time-variations of force for all 50 lower extremity muscle segments throughout the stance portion of gait are shown in Figure 5. In muscles spanning the hip, those that worked to extend the hip and pull the femoral head into the acetabulum (e.g. FCRLP, IFB, ITBL) had the predominant forces calculated by optimization. Muscles functioning to flex the knee and the hock (e.g. FTI, EDL, FCRM) were generally the lowest force producers. Calculated emu muscle forces compared favorably with EMG data collected for guinea fowl (Gatesy 1999; Marsh et al. 2004), except for some muscles known to be substantial contributors to the swing phase (ITBCR, ITRCR, IFB) in the guinea fowl, in which greater than expected forces were calculated for the emu.
Figure 5.
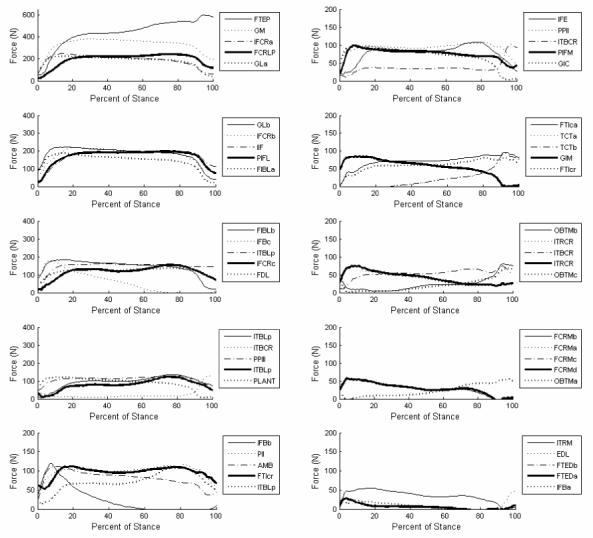
Average time histories of the 50 muscle forces during the stance phase of gait. Muscle name abbreviations are defined in Table 3 (Patak and Baldwin). Small variations in individual gait led to the optimization routine calculating somewhat different individual muscle forces for the two individual emus. For example, in Emu #1, but not in Emu #2, the gastrocnemius muscles were responsible for large force generation over the duration of the stance phase.
The average maximum resultant hip contact force (Figure 6) was found to be approximately 5.5 times body weight (BW = 294N for Emu #1, BW = 361N for Emu #2). Despite the significant flexion angle maintained by the femur throughout the stance phase of gait, the contact force was primarily directed longitudinally down the shaft of the femur. The medial/lateral and anterior/posterior components of contact force were generally less than 2 times body weight.
Figure 6.
Two-bird average hip contact force vectors plotted on a triangulated proximal emu femur surface, and the associated forces in the three principal planes of motion. Human hip contact force vectors are shown on the far left and far right for comparison (Pedersen et al. 1997).
Discussion
Although emus per se have been the subject of only limited research, the occurrence of human-important orthopaedic disorders in avian species is very well established. Osteoarthritis, for example, as identified by the existence of osteophytes in the peri-articular joint space, has been found in up to 9.8% of pigeons and 3% of hawks (Rothschild and Panza 2006). Overweight turkeys, overweight chickens, and ostriches kept in small enclosures have been found to develop degenerative joint disease (cartilage fibrillation, fissuring, chondrocyte clustering, changes in proteoglycan content, and cartilage thinning) in both the hip and hock joints (Duff 1985; Duncan et al. 1991; Anderson-Mackenzie et al. 1997; Venkatesan et al. 1999; Anderson-MacKenzie et al. 2001; Tomiosso et al. 2005). Genetic, environmental, and nutritional factors contribute to the development of osteoporosis in laying hens, with a 30% incidence of fracture reported for these animals (Fleming et al. 2000). Osteonecrosis of the femoral head, including both the biological progression and the structural collapse, can be replicated in the emu hip by means of cryoinsult (Conzemius et al. 2002). While avian species obviously are not full physiological counterparts of mammals, these many occurrences of familiar clinical disorders suggest potential utility of the emu in appropriately targeted experimental designs.
The kinematics observed for the emu in this work were generally comparable to those reported in other avian gait studies. During normal walking, avian species demonstrate relatively modest flexion excursions at the hip, with motion at the distal joints accounting for the majority of sagittal plane movement (Maloiy et al. 1979; Abourachid 1991). For example, hip flexion excursions are limited in ostriches (12.7 degrees, guinea fowl (5-10 degrees) and quail (nearly zero), while knee, hock, and subtalar joints each experience 45-80 degrees of flexion excursion during normal slow walking (Gatesy and Biewener 1991; Gatesy 1999; Reilly 2000; Rubenson et al. 2007). In addition to modest sagittal plane motion of the femur in favor of more significant motion at the more distal joints, avian species generally demonstrate a significantly abducted femur, and a considerable amount of lateral ground reaction force during gait (Corr et al. 2007). Similar gait characteristics were observed in the emu.
Comparable kinetics and joint contact force data for the human and the emu indicate a similarity that goes beyond the basic kinematics. The bimodal distribution of the vertical ground reaction force in the emu correlates well with that seen in the human, despite the slightly larger (relative) values of reaction force for the emu and the lack of a pronounced force peak at initial foot contact. Optimization calculations of hip contact forces in the human have suggested values of 4.3 times body weight for a 69 kg male walking at a velocity 0.95-1.05 m/s, and 3.6-4.0 times body weight for a 67 kg male walking at 1.11-1.36 m/s (Crowninshield et al. 1978; Brand et al. 1994). Human hip contact forces measured directly from telemetrized total hip replacements have consistently been somewhat lower (2.3-2.7 times body weight) than those calculated by optimization techniques (Kotzar et al. 1991; Bergmann et al. 1993; Bergmann et al. 2001). By implication, the presently calculated contact force at the hip (∼5.5 times body weight) may similarly be a high-range estimate.
Humans walk with both the trunk and the lower limb oriented mostly vertically, a posture not replicated in any other bipedal animal (Alexander 2004). The highly flexed and abducted orientation of the emu femur likely contributes to the emu’s somewhat higher hip joint contact forces, because of the increased muscle forces required to equilibrate torso “overhang”(Gatesy and Biewener 1991). Another factor plausibly contributing to the higher-than-human hip contact forces is that more of the emu body mass (∼77%) is located above the hip than in the human (68%) (Clauser et al. 1969).
When modeling loading-dependent disorders, knowledge of the mechanical environment throughout the study region is necessary. The forces calculated in this study are specific to the emu hip; the effects of such loading on the mechanical environment in other regions of the femur or lower extremity were not addressed. While the majority of the femoral head load is directed longitudinally along the femur, the non-axial loading components (up to 2x BW) in combination with the flexed femur orientation could lead to significant torsional strains such as those measured in the shafts of avian lower-limb long bones (Carrano and Biewener 1999; Main and Biewener 2007). So, while the human-comparable contact forces determined here may indicate the emu hip to be appropriate for study of specific human disorders, homology of the mechanical environment other than at the hip per se requires further investigation. Another limitation to using the emu as a generalized model of human orthopaedic disorders, despite the comparable mechanical environment in the hip, is that potential biochemical/physiologic/metabolic differences between avian and mammalian species may need to be accounted for when drawing conclusions from an avian model.
In summary, the present gait analysis results indicate that despite various anatomic differences, body weight-normalized hip joint contact forces in the emu reasonably replicate those in humans. This suggests that at least in terms of biomechanical functional demand, the emu can potentially serve as a reasonable surrogate for bipedal studies of human hip joint disorders.
Supplementary Material
Figure 4.
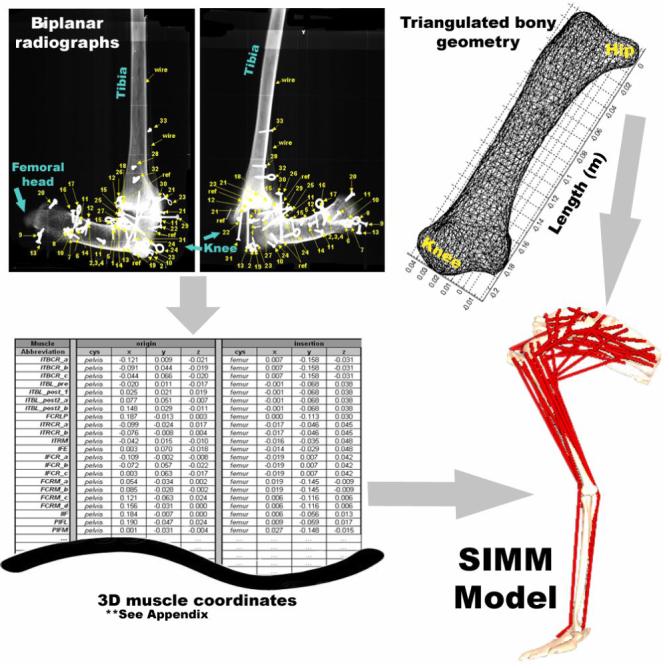
Pictorial summary of SIMM model generation. Biplanar radiographs yielded three dimensional muscle attachment data with respect to local bony geometry. Segmented CT scans of individual lower limb bones provided triangulated surfaces of emu bony geometry for SIMM.
Acknowledgements
Financial support provided by NIH grant #AR 049919. The authors would like to thank Dr. Matthew Frank for assistance with CT data processing, Dr. David Wilder for analysis of model accuracy, and Ms. Tiffaney Hammer for assistance in digitizing the kinematic data.
Footnotes
Publisher's Disclaimer: This is a PDF file of an unedited manuscript that has been accepted for publication. As a service to our customers we are providing this early version of the manuscript. The manuscript will undergo copyediting, typesetting, and review of the resulting proof before it is published in its final citable form. Please note that during the production process errors may be discovered which could affect the content, and all legal disclaimers that apply to the journal pertain.
References
- Abourachid A. Comparative gait analysis of two strains of turkey, Meleagris gallopavo. British Poultry Science. 1991;32(2):271–7. doi: 10.1080/00071669108417350. [DOI] [PubMed] [Google Scholar]
- Alexander RM. Bipedal animals, and their differences from humans. Journal of Anatomy. 2004;204(5):321–30. doi: 10.1111/j.0021-8782.2004.00289.x. [DOI] [PMC free article] [PubMed] [Google Scholar]
- Anderson-Mackenzie JM, Hulmes DJ, Thorp BH. Degenerative joint disease in poultry--differences in composition and morphology of articular cartilage are associated with strain susceptibility. Research in Veterinary Science. 1997;63(1):29–33. doi: 10.1016/s0034-5288(97)90154-5. [DOI] [PubMed] [Google Scholar]
- Anderson-MacKenzie JM, Robins SP, Thorp BH, Hulmes DJ. Changes in proteoglycan content of articular cartilage during avian degenerative joint disease. Clinical and Experimental Rheumatology. 2001;19(2):159–64. [PubMed] [Google Scholar]
- Bailey AS, Adler F, Min Lai S, Asher MA. A comparison between bipedal and quadrupedal rats: do bipedal rats actually assume an upright posture? Spine. 2001;26(14):E308–13. doi: 10.1097/00007632-200107150-00006. [DOI] [PubMed] [Google Scholar]
- Bergmann G, Deuretzbacher G, Heller M, Graichen F, Rohlmann A, Strauss J, Duda GN. Hip contact forces and gait patterns from routine activities. Journal of Biomechanics. 2001;34(7):859–71. doi: 10.1016/s0021-9290(01)00040-9. [DOI] [PubMed] [Google Scholar]
- Bergmann G, Graichen F, Rohlmann A. Hip joint loading during walking and running, measured in two patients. Journal of Biomechanics. 1993;26(8):969–90. doi: 10.1016/0021-9290(93)90058-m. [DOI] [PubMed] [Google Scholar]
- Bergmann G, Graichen F, Rohlmann A. Hip joint forces in sheep. Journal of Biomechanics. 1999;32(8):769–77. doi: 10.1016/s0021-9290(99)00068-8. [DOI] [PubMed] [Google Scholar]
- Brand RA, Crowninshield RD, Wittstock CE, Pedersen DR, Clark CR, van Krieken FM. A model of lower extremity muscular anatomy. Journal of Biomechanical Engineering. 1982;104(4):304–10. doi: 10.1115/1.3138363. [DOI] [PubMed] [Google Scholar]
- Brand RA, Pedersen DR, Davy DT, Kotzar GM, Heiple KG, Goldberg VM. Comparison of hip force calculations and measurements in the same patient. Journal of Arthroplasty. 1994;9(1):45–51. doi: 10.1016/0883-5403(94)90136-8. [DOI] [PubMed] [Google Scholar]
- Carrano MT, Biewener AA. Experimental alteration of limb posture in the chicken (Gallus gallus) and its bearing on the use of birds as analogs for dinosaur locomotion. Journal of Morphology. 1999;240(3):237–49. doi: 10.1002/(SICI)1097-4687(199906)240:3<237::AID-JMOR3>3.0.CO;2-N. [DOI] [PubMed] [Google Scholar]
- Clauser CE, McConville JT, Young JW. Weight, volume, and center of mass segments of the human body. Aerospace Medical Research Laboratory; Wright-Patterson Air Force Base, OH: 1969. pp. 42–59. [Google Scholar]
- Conzemius MG, Brown TD, Zhang Y, Robinson RA. A new animal model of femoral head osteonecrosis: one that progresses to human-like mechanical failure. Journal of Orthopaedic Research. 2002;20(2):303–9. doi: 10.1016/S0736-0266(01)00108-5. [DOI] [PubMed] [Google Scholar]
- Conzemius MG, Smith GK, Brighton CT, Marion MJ, Gregor TP. Analysis of physeal growth in dogs, using biplanar radiography. American Journal of Veterinary Research. 1994;55(1):22–7. [PubMed] [Google Scholar]
- Corr SA, McCorquodale C, McDonald J, Gentle M, McGovern R. A force plate study of avian gait. Journal of Biomechanics. 2007;40(9):2037–43. doi: 10.1016/j.jbiomech.2006.09.014. [DOI] [PubMed] [Google Scholar]
- Crowninshield RD, Johnston RC, Andrews JG, Brand RA. A biomechanical investigation of the human hip. Journal of Biomechanics. 1978;11(12):75–85. doi: 10.1016/0021-9290(78)90045-3. [DOI] [PubMed] [Google Scholar]
- D’Aout K, Vereecke E, Schoonaert K, De Clercq D, Van Elsacker L, Aerts P. Locomotion in bonobos (Pan paniscus): differences and similarities between bipedal and quadrupedal terrestrial walking, and a comparison with other locomotor modes. Journal of Anatomy. 2004;204(5):353–61. doi: 10.1111/j.0021-8782.2004.00292.x. [DOI] [PMC free article] [PubMed] [Google Scholar]
- Duff SR. Further studies of degenerative hip disease; antitrochanteric degeneration in turkeys and broiler type chickens. Journal of Comparative Pathology. 1985;95(1):113–22. doi: 10.1016/0021-9975(85)90083-0. [DOI] [PubMed] [Google Scholar]
- Duncan IJ, Beatty ER, Hocking PM, Duff SR. Assessment of pain associated with degenerative hip disorders in adult male turkeys. Research in Veterinary Science. 1991;50(2):200–3. doi: 10.1016/0034-5288(91)90106-x. [DOI] [PubMed] [Google Scholar]
- Fleming RH, McCormack HA, Whitehead CC. Prediction of breaking strength in osteoporotic avian bone using digitized fluoroscopy, a low cost radiographic technique. Calcified Tissue International. 2000;67(4):309–13. doi: 10.1007/s002230001120. [DOI] [PubMed] [Google Scholar]
- Gatesy SM. Guineafowl hind limb function. I: Cineradiographic analysis and speed effects. Journal of Morphology. 1999;240:115–125. doi: 10.1002/(SICI)1097-4687(199905)240:2<115::AID-JMOR3>3.0.CO;2-Y. [DOI] [PubMed] [Google Scholar]
- Gatesy SM. Guineafowl hind limb function. II: Electromyographic analsysis and motor pattern evolution. Journal of Morphology. 1999;240:127–142. doi: 10.1002/(SICI)1097-4687(199905)240:2<127::AID-JMOR4>3.0.CO;2-Q. [DOI] [PubMed] [Google Scholar]
- Gatesy SM, Biewener AA. Bipedal locomotion: Effects of speed, size and limb posture in birds and humans. Journal of Zoology. 1991;224:127–147. [Google Scholar]
- Hill AV. Length of muscle, and the heat and tension developed in an isometric contraction. Journal of Physiology. 1925;60(4):237–63. doi: 10.1113/jphysiol.1925.sp002242. [DOI] [PMC free article] [PubMed] [Google Scholar]
- Hirasaki E, Ogihara N, Hamada Y, Kumakura H, Nakatsukasa M. Do highly trained monkeys walk like humans? A kinematic study of bipedal locomotion in bipedally trained Japanese macaques. Journal of Human Evolution. 2004;46(6):739–50. doi: 10.1016/j.jhevol.2004.04.004. [DOI] [PubMed] [Google Scholar]
- Kotzar GM, Davy DT, Goldberg VM, Heiple KG, Berilla J, Heiple KG, Jr., Brown RH, Burstein AH. Telemeterized in vivo hip joint force data: a report on two patients after total hip surgery. Journal of Orthopaedic Research. 1991;9(5):621–33. doi: 10.1002/jor.1100090502. [DOI] [PubMed] [Google Scholar]
- Main RP, Biewener AA. Skeletal strain patterns and growth in the emu hindlimb during ontogeny. Journal of Experimental Biology. 2007;210(Pt 15):2676–90. doi: 10.1242/jeb.004580. [DOI] [PubMed] [Google Scholar]
- Maloiy GMO, Alexander RM, Njau R, Jayes AS. Allometry of the legs of running birds. Journal of Zoology. 1979;187:161–167. [Google Scholar]
- Marsh RL, Ellerby DJ, Carr JA, Henry HT, Buchanan CI. Partitioning the energetics of walking and running: swinging the limbs is expensive. Science. 2004;303(5654):80–3. doi: 10.1126/science.1090704. [DOI] [PubMed] [Google Scholar]
- Morey-Holton ER, Globus RK. Hindlimb unloading rodent model: technical aspects. Journal of Applied Physiology. 2002;92(4):1367–77. doi: 10.1152/japplphysiol.00969.2001. [DOI] [PubMed] [Google Scholar]
- Nelson FE, Gabaldon AM, Roberts TJ. Force-velocity properties of two avian hindlimb muscles. Comparative Biochemistry and Physiology. Part A, Molecular and Integrative Physiology. 2004;137(4):711–21. doi: 10.1016/j.cbpb.2004.02.004. [DOI] [PubMed] [Google Scholar]
- Page AE, Allan C, Jasty M, Harrigan TP, Bragdon CR, Harris WH. Determination of loading parameters in the canine hip in vivo. Journal of Biomechanics. 1993;26(45):571–9. doi: 10.1016/0021-9290(93)90018-a. [DOI] [PubMed] [Google Scholar]
- Patak AE, Baldwin J. Pelvic limb musculature in the emu Dromaius novaehollandiae (Aves: Struthioniformes: Dromaiidae): adaptations to high-speed running. Journal of Morphology. 1998;238(1):23–37. doi: 10.1002/(SICI)1097-4687(199810)238:1<23::AID-JMOR2>3.0.CO;2-O. [DOI] [PubMed] [Google Scholar]
- Pedersen DR, Brand RA, Cheng C, Arora JS. Direct comparison of muscle force predictions using linear and nonlinear programming. Journal of Biomechanical Engineering. 1987;109(3):192–9. doi: 10.1115/1.3138669. [DOI] [PubMed] [Google Scholar]
- Pedersen DR, Feinberg JH, Brand RA. A model to predict canine pelvic limb musculoskeletal geometry. Acta Anatomica. 1991;140(2):139–45. doi: 10.1159/000147050. [DOI] [PubMed] [Google Scholar]
- Pierrynowski MR, Morrison JB. A physiological model for the evaluation of muscular forces in human locomotion: Theoretical aspects. Mathematical Biosciences. 1985;75(1):69–101. [Google Scholar]
- Reilly SM. Locomotion in the quail (Coturnix japonica): the kinematics of walking and increasing speed. Journal of Morphology. 2000;243(2):173–85. doi: 10.1002/(SICI)1097-4687(200002)243:2<173::AID-JMOR6>3.0.CO;2-E. [DOI] [PubMed] [Google Scholar]
- Rothschild BM, Panza R. Osteoarthritis is for the birds. Clinical Rheumatology. 2006;25(5):645–7. doi: 10.1007/s10067-005-0141-x. [DOI] [PubMed] [Google Scholar]
- Rubenson J, Lloyd DG, Besier TF, Heliams DB, Fournier PA. Running in ostriches (Struthio camelus): three-dimensional joint axes alignment and joint kinematics. Journal of Experimental Biology. 2007;210(Pt 14):2548–62. doi: 10.1242/jeb.02792. [DOI] [PubMed] [Google Scholar]
- Rumph PF, Kincaid SA, Visco DM, Baird DK, Kammermann JR, West MS. Redistribution of vertical ground reaction force in dogs with experimentally induced chronic hindlimb lameness. Veterinary Surgery. 1995;24(5):384–9. doi: 10.1111/j.1532-950x.1995.tb01348.x. [DOI] [PubMed] [Google Scholar]
- Tomiosso TC, Gomes L, de Campos Vidal B, Pimentel ER. Extracellular matrix of ostrich articular cartilage. Biocell. 2005;29(1):47–54. [PubMed] [Google Scholar]
- Troy KL, Lundberg HJ, Conzemius MG, Brown TD. Habitual hip joint activity level of the penned emu (Dromaius novaehollandie) Iowa Orthopaedic Journal. 2007;27:17–23. [PMC free article] [PubMed] [Google Scholar]
- Venkatesan N, Thorp BH, Hulmes DJ. Articular cartilage proteoglycan metabolism in avian degenerative joint disease: effects of strain selection and body weight. Connective Tissue Research. 1999;40(3):199–208. doi: 10.3109/03008209909005283. [DOI] [PubMed] [Google Scholar]
Associated Data
This section collects any data citations, data availability statements, or supplementary materials included in this article.


