Abstract
AIMS
To model the pharmacokinetics and pharmacodynamics of ifosfamide and its key metabolites. The pharmacodynamic parameters included were renal toxicity and myelosuppression measured using urinary β2-microglobulin (BMG) and absolute neutrophil count (ANC), respectively.
METHODS
Seventeen patients were enrolled into an n = 1 randomized trial during two consecutive cycles of ifosfamide 9 g m−2 during each cycle given by a 3 h or 72 h infusion. Data were analyzed using NONMEM.
RESULTS
Ifosfamide and metabolite concentration–time profiles were described by a one-compartment open-model with auto-induction of clearance. BMG and ANC time-courses were related to ifosfamide concentration via indirect response models.
CONCLUSIONS
This modelling allowed the simulation of weekly schedules of flat doses with favourable myelotoxic profiles.
WHAT IS ALREADY KNOWN ABOUT THIS SUBJECT
The optimal infusion duration for ifosfamide remains to be determined.
No differences according to time of infusion have been identified in traditional pharmacokinetic endpoints, such as area under the curve.
The impact on pharmacodynamics has never been modelled or correlated with pharmacokinetics.
WHAT THIS STUDY ADDS
The pharmacokinetics and pharmacodynamics of ifosfamide and its main metabolites can both be modelled with no influence of infusion duration.
Pharmacodynamic modelling (renal and haematological toxicity) allows further simulations of new schedules with favourable toxicity profiles.
Keywords: alkylating agents, drug metabolism, ifosfamide, pharmacodynamics, pharmacokinetics, population
Introduction
The aim of this study was to investigate the population pharmacokinetics-pharmacodynamics of ifosfamide and its main metabolites, allowing the simulation of new schedules of administration (for a review, see [1]). Data collected in a study comparing two schedules of administration for ifosfamide [2] were used. Pharmacodynamic issues included renal tubular toxicity and myelosuppression measured, respectively, by the urinary β2-microglobulin (BMG) [3] and the absolute neutrophil count (ANC).
Methods
Patients were treated for advanced solid tumours with ifosfamide single-agent in an open randomized crossover pharmacokinetic phase II study. Study approval was given by the ethics committee of Saint-Germain en Laye and of the institution. All patients provided written informed consent. Patients were randomly assigned to receive ifosfamide 3 g m−2 for 3 days (total dose 9 g m−2 for each cycle) as either a daily 3 h infusion dose or a 72 h continuous infusion for the first cycle. Three weeks later, they were crossed over to the alternative schedule. Blood sampling and bioanalysis were conducted as previously published [2].
Ifosfamide pharmacokinetics were described by a one-compartment model with auto-induction of clearance (CL). Ifosfamide CL (CLIF) was related to ifosfamide concentration (CIF) by an indirect response model previously described [4]:
where CLINIT is the initial CLIF, KTR is the time rate constant for transit kinetics and EC50 is the ifosfamide concentration that produces 50% of maximal effect. To improve interpretation, mean transit time (MTT) was used: MTT = 2/KTR here.
The pharmacokinetic equations for the metabolites were:
where V and f stand for distribution volume and metabolized fraction, and the subscripts IF and m denote ifosfamide and metabolite, respectively. Only the apparent fraction of ifosfamide metabolized and metabolite elimination rate constant were identifiable:  and
and  , respectively.
The urinary BMG increase was described by an indirect response model with a stimulation of the response (R) production according to:
The myelosuppression effect was measured by the ANC after a previously described model [5], including five connected transit compartments. The first compartment (R1, PROL) stands for the proliferation compartment and the last one (R5, CIRC) for the circulation compartment where the observation (ANC) takes place. The PROL and CIRC compartments are separated by three transit effect compartments (R2, R3, R4). A feedback loop quantified by (CIRC0/CIRC)γ describes the rebound of cells according to the baseline value CIRC0, with γ representing a sigmoidal constant. The differential equations connected to this model are:
 |
The drug concentration is assumed to inhibit the cell proliferation rate via a linear model. The MTT of the system is 6/KTR.
Data were analyzed using NONMEM (version VI, double precision) with the DIGITAL FORTRAN compiler. The FOCE method with INTERACTION was always used. The pharmacokinetics of ifosfamide and its metabolites were studied sequentially using molar concentrations. Bayesian estimates (POSTHOC) of pharmacokinetic parameters were included in the metabolite and pharmacodynamic datasets and served to calculate ifosfamide concentrations. Covariates were selected in the model if their effect was biologically plausible, they reduced the objective function value (OFV) by 11 units and the intersubject variability (ISV) of the corresponding pharmacokinetic parameter, and the relative standard error of covariate parameter was lower than 50%.
All estimates are presented as mean (%CV, coefficient of variation) for all results. Variabilities were expressed as the square root of the variances, ω2 or σ2. When ISV was not given for a parameter, it meant that it was not statistically significant and its deletion did not alter the fit and OFV.
Diagnostic graphics and visual predictive checks (VPC, 1000 simulations) were obtained using the R program.
Results
A total of nine male and eight female patients, aged 35–68 years, height 1.39–1.89 m were included with 12 complete pharmacokinetic evaluations (two sets). The total dose of ifosfamide per cycle ranged from 12.6 g to 16.8 g.
Pharmacokinetic data included 572, 513 and 572 concentrations for ifosfamide, 4-hydroxy-ifosfamide and dechloroethylated metabolites, respectively. ISV and residual variabilities were modelled as exponential errors. The auto-induction model described ifosfamide pharmacokinetics, whatever the infusion duration. Only the drug interaction with carbamazepine was significant (OFV drop of 106 units), resulting in an eight-fold increase of CLINIT. Because this was an isolated observation, this patient was deleted from the final analyses. The final parameter estimates were V 46 l (6%), CLINIT 3.44 l h−1 (4%), EC50 22 μmoll−1 (4%) and MTT 62 h (6%). The ISVs were 0.14 (35%) and 0.18 (35%) for V and CLINIT, respectively and the residual variability was 0.22 (25%). Given these estimates, 8% (6–11%, exact binomial test) of observations were outside the VPC 90% interval. The metabolites parameter estimates were fm/Vm 0.0019 (9%) [ISV 0.42 (40%)], 0.0063 (8%) [ISV 0.21 (34%)], 0.0043 (7%) [ISV 0.26 (33%)] l−1 and Km 0.14 (8.5%) [ISV 0.30 (44%)], 0.020 (16%), 0.036 (8.5%) h−1 for 4-hydroxy-ifosfamide, 3-dechloroethyl-ifosfamide and 2-dechloroethyl-ifosfamide, respectively. The corresponding residual variabilities were 0.71 (27%), 0.36 (11%) and 0.36 (12%). The VPC for the metabolites confirmed these results (not shown).
Negligible differences were observed on effect–time course curve-fittings when the parent or metabolite concentrations were used as effectors. Uncertainties prevailing in the exact effects of these metabolites, only results obtained with the parent concentration are presented. BMG and myelosuppression effects were modelled as linear functions of concentration.
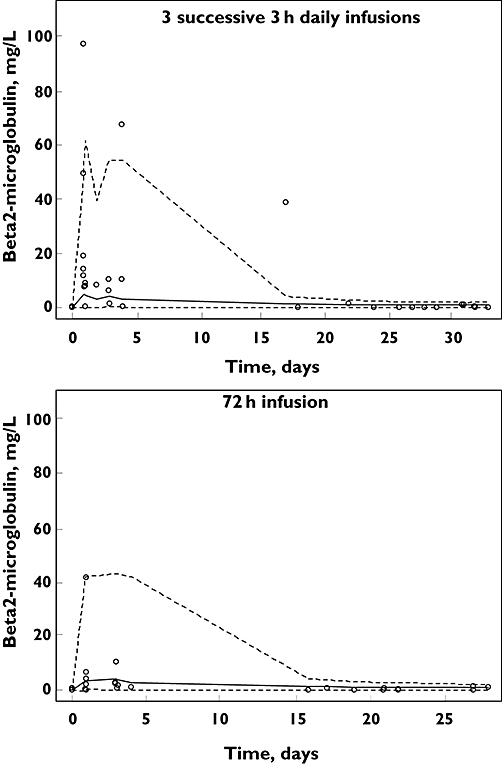
The BMG time-course model parameters (Figure 1) were SLOPEIF 0.32 l mg−1 (34%), MTT 243 h (27%) and baseline 0.05 mg l−1 (28%). The ISVs were 3.4 (36%) and 1.1 (40%) for SLOPEIF and baseline and the residual proportional and additive variabilities were 0.73 (16%) and 0.02 (47%). The VPC showed that 22.5% (13–34%, exact binomial test) of observations were outside the 80% confidence limits.
Figure 1.

Visual predictive checks (80%) for urinary β2-microglobulin time-courses following ifosfamide infusion. o symbols are observed data. Lines are predicted values from 1000 simulations. Dotted lines are the 10th and 90th percentiles. The solid line is the median
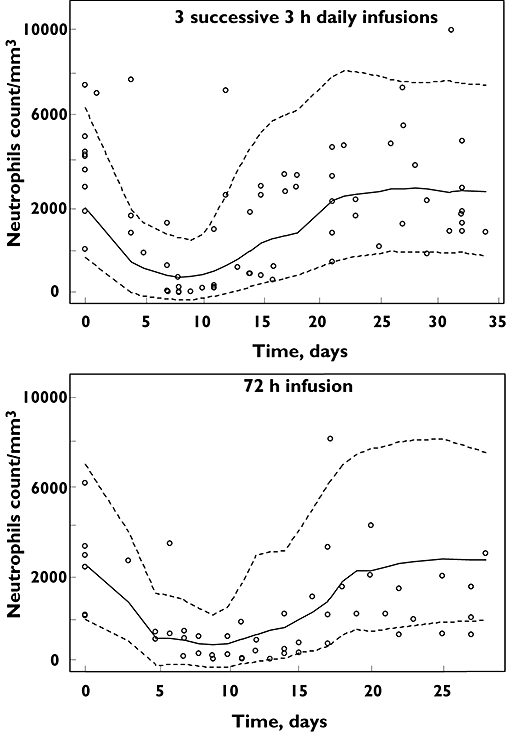
The ANC time-course (Figure 2) model parameters were SLOPEIF 0.014 l μmol−1 (25%), MTT 150 h (9%), baseline count 4490 mm−3 (12%) and γ 0.16 (19%). The ISVs were 0.30 (30%) and 0.46 (41%) for MTT and baseline, respectively, and the residual proportional and additive variabilities were 0.34 (47%) and 650 (35%). The VPC showed that 15.5% (10–24%, exact binomial test) of observations were outside the 80% confidence interval.
Figure 2.

Visual predictive checks (80%) for absolute neutrophils count time-courses following ifosfamide infusion. o symbols are observed data. Lines are predicted values from 1000 simulations. Dotted lines are the 10th and 90th percentiles. The solid line is the median
Discussion
The pharmacokinetic parameters of ifosfamide and metabolites were similar to those previously reported [4]. The variability parameters were slightly different because the FOCE method was used here. To our knowledge, this is the first time that the toxic effect of ifosfamide on renal function was modelled using the urinary BMG concentration.
The advantages of pharmacokinetic-pharmacodynamic modelling are to relate toxic effects (as indicated by either increase in BMG or ANC decrease) to drug concentrations and to consider the entire effect–time course instead of simply the nadir or zenith. The parameters related to the blood cell system, MTT, γ and their corresponding ISV, were comparable with those previously published for a series of anticancer drugs [5].
The simulation of four successive weekly administrations of 5 g ifosfamide was compared with the observed ANC data resulting from 12.6 to 16.8 g ifosfamide administration every 3-weeks. This weekly regimen appeared to allow the administration of 20 g in 4 weeks with a 25% higher dose intensity but with less neutropenia. Preclinical studies have suggested an improved antitumour effect with repeated intraperitoneal injections of an oxazaphosphorine prodrug compared with a single intravenous injection of the same cumulative total dose [6]. Therefore these data warrant further prospective investigation of such a weekly schedule for ifosfamide in patients. In suggesting this, we ignore the chronically increased urinary BMG concentration which would be produced by such a regimen, so that parallel evaluation of this marker should be done in any such clinical study, as it seems the most sensitive predictor of ifosfamide tubular proteinuria [3].
REFERENCES
- 1.Kerbusch T, de Kraker J, Keizer HJ, van Putten JW, Groen HJ, Jansen RL, Schellens JH, Beijnen JH. Clinical pharmacokinetics and pharmacodynamics of ifosfamide and its metabolites. Clin Pharmacokinet. 2001;40:41–62. doi: 10.2165/00003088-200140010-00004. [DOI] [PubMed] [Google Scholar]
- 2.Brain EG, Rezai K, Weill S, Gauzan MF, Santoni J, Besse B, Goupil A, Turpin F, Urien S, Lokiec F. Variations in schedules of ifosfamide administration: a better understanding of its implications on pharmacokinetics through a randomized cross-over study. Cancer Chemother Pharmacol. 2006;60:375–81. doi: 10.1007/s00280-006-0373-8. [DOI] [PubMed] [Google Scholar]
- 3.Lee BS, Lee JH, Kang HG, Hahn H, Lee JH, Shin HY, Ha IS, Cheong HI, Ahn HS, Choi Y. Ifosfamide nephrotoxicity in pediatric cancer patients. Pediatr Nephrol. 2001;16:796–9. doi: 10.1007/s004670100658. [DOI] [PubMed] [Google Scholar]
- 4.Kerbusch T, Mathot RA, Keizer HJ, Kaijser GP, Schellens JH, Beijnen JH. Influence of dose and infusion duration on pharmacokinetics of ifosfamide and metabolites. Drug Metab Dispos. 2001;29:967–75. [PubMed] [Google Scholar]
- 5.Friberg LE, Henningsson A, Maas H, Nguyen L, Karlsson MO. Model of chemotherapy-induced myelosuppression with parameter consistency across drugs. J Clin Oncol. 2002;20:4713–21. doi: 10.1200/JCO.2002.02.140. [DOI] [PubMed] [Google Scholar]
- 6.Voelcker G, Wagner T, Wientzek C, Hohorst HJ. Pharmacokinetics of ‘activated’ cyclophosphamide and therapeutic efficacies. Cancer. 1984;54(6 Suppl.):1179–86. doi: 10.1002/1097-0142(19840915)54:1+<1179::aid-cncr2820541315>3.0.co;2-p. [DOI] [PubMed] [Google Scholar]


