

Abstract
Aims
To evaluate the effect of CYP2C19 polymorphism on nelfinavir and M8 pharmacokinetic variability in human immunodeficiency virus-infected patients and to study the link between pharmacokinetic exposure and short-term efficacy and toxicity.
Methods
Nelfinavir (n = 120) and M8 (n = 119) concentrations were measured in 34 protease inhibitor-naïve patients. Two weeks after initiating the treatment, blood samples were taken before, 1, 3 and 6 h after drug administration. Genotyping for CYP3A4, 3A5, 2C19 and MDR1 was performed. A population pharmacokinetic model was developed to describe nelfinavir-M8 concentration time-courses and to estimate interpatient variability. The influence of individual characteristics and genotypes were tested using a likelihood ratio test. Estimated mean (Cmean), maximal (Cmax) and trough (Ctrough) nelfinavir and M8 concentrations were correlated to short-term virological efficacy and tolerance using Spearman nonparametric correlation tests.
Results
A one-compartment model with first-order absorption, elimination and metabolism to M8 best described nelfinavir data. M8 was modelled by an additional compartment. Mean pharmacokinetic estimates and the corresponding intersubject variabilities were: absorption rate 0.17 h−1 (99%), absorption lag time 0.82 h, apparent nelfinavir total clearance 52 l h−1 (49%), apparent nelfinavir volume of distribution 191 l, M8 elimination rate constant 1.76 h−1 and nelfinavir to M8  0.39 h−1 (59%) in *1/*1 patients and 0.20 h−1 in *1/*2 or *2/*2 patients for CYP2C19*2. Nelfinavir Cmean was positively correlated to glycaemia and triglyceride increases (P = 0.02 and P = 0.04, respectively).
Conclusions
The rate of metabolism of nelfinavir to M8 was reduced by 50% in patients with *1/*2 or *2/*2 genotype for CYP2C19 compared with those with *1/*1 genotype.
What is already known about this subject
Nelfinavir is an HIV protease inhibitor, substrate of the transporter P-glycoprotein and metabolized via CYP2C19, CYP3A4 and CYP3A5 enzymes.
Pharmacokinetic studies have shown wide interindividual variability of nelfinavir concentrations, some of this variability perhaps caused by variant drug metabolism or transporter genes.
For CYP3A4*1B and CYP3A5*3 polymorphism, results from three studies are in agreement, showing no difference in nelfinavir concentrations between patients with these different genotypes.
However, for MDR1 and CYP2C19 polymorphism, there have been contradictory studies, showing either no impact on nelfinavir concentration or modified concentrations which could influence virological response.
What this study adds
Patients with an *1/*2 or *2/*2 genotype for CYP2C19 had a nelfinavir to M8 biotransformation divided by 2 compared with *1/*1 patients.
No evidence of any influence of MDR1 polymorphism on nelfinavir absorption could be detected.
Keywords: CYP2C19, HIV, nelfinavir, NONMEM, pharmacokinetics
Introduction
Nelfinavir is a protease inhibitor commonly used as part of highly active antiretroviral therapy for human immunodeficiency virus (HIV)-infected patients. The use of a protease inhibitor-based regimen led to a substantial decrease in viral load and restoration of immune function in most HIV+ individuals, permitting a decline in death rates and reductions in the incidence of opportunistic infections [1, 2]. Nelfinavir bioavailability is between 70 and 80% when administered with food [3]. In the intestine, P-glycoprotein (P-gp) restricts the entry into the body of nelfinavir, which is a substrate of this transporter [4]. The volume of distribution is 2–7 l kg−1 of bodyweight. Nelfinavir is metabolized into the active metabolite hydroxyl-tert-butylamide (M8) via the CYP2C19 enzyme, and both drugs are metabolized via CYP3A4 [5, 6]. Nelfinavir is the only HIV protease inhibitor that has an active metabolite (M8) present in potentially therapeutic concentrations [6].
There is wide interindividual variability in the disposition of this drug, and some of this variability may be caused by variant drug metabolism or transporter genes. Studies have already shown the impact of CYP3A4, CYP3A5, CYP2C19 and MDR1 polymorphism on nelfinavir pharmacokinetics. A single nucleotide polymorphism (SNP) in the 5′ regulatory region of CYP3A4 gene (A-392 G) named CYP3A4*1B is the most common variant; it has been associated in vitro with enhanced CYP3A expression [7]. The CYP 3A5*3 polymorphism (A6986 G) leads to an inactive truncated protein [8]. However, Fellay et al.[9], Saitoh et al.[10] and Haas et al.[11] could not evidence any differences in nelfinavir concentrations between patients with these different genotypes. Concerning the effect of MDR1 polymorphism, conflicting results have been found. Two SNPs in MDR1 gene G2677A/T in exon 21, and C3435T in exon 26 have been shown to be associated with variation in P-gp expression. Fellay et al.[9] have shown an increase in median nelfinavir concentration for patients MDR1 3435 from TT, CT to CC genotypes. Patients with MDR1 3435 TT genotypes have the lowest median concentrations, patients with CT genotype have higher median concentrations than TT and finally patients with CC genotype have the highest median concentrations. Saitoh et al.[10] have found that children with CT genotype for MDR1 3435 had a higher 8-h postdose nelfinavir concentration compared with those with other genotypes. However, Haas et al.[11] could not evidence any influence of the MDR1 polymorphism in exon 26 and 21 on nelfinavir AUC. For CYP2C19 gene, in Whites CYP2C19*2 (G681A point mutation in exon 5) is the most common variant, which has no enzyme activity. Haas et al.[11] have found in 348 HIV-infected adults that *1/*2 (AG) or *2/*2 (AA) patients had significantly higher nelfinavir and nelfinavir plus M8 AUC0−12h than *1/*1 (GG) genotype and tended to have a better virological response. However Fellay et al.[9] in 123 adults, Saitoh et al.[10] in 71 children and Burger et al.[12] in 24 adults have found no effect of the CYP2C19 genotype on nelfinavir concentrations in plasma.
The aims of this study were to evaluate the influence of genetic polymorphism on pharmacokinetic parameters (MDR1 on absorption, CYP2C19 on nefinavir to M8 biotransformation and CYP3A4 on nelfinavir and M8 metabolism) and to correlate concentrations with short-term virological efficacy and toxicity.
Methods
Patients
The COPHAR2-ANRS 102 study was an open, multicentre, prospective trial of HIV-1-infected adults who began treatment with an antiretroviral combination of at least three drugs: two nucleoside reverse transcriptase inhibitors plus one protease inhibitor; nelfinavir, indinavir or lopinavir. In our group, all patients were administered nelfinavir.
Patients >18 years old, infected with HIV-1, protease inhibitor-naive were eligible. The Ethical Review Committee of the Bicêtre Hospital, Paris, France reviewed and approved the study protocol. All participants provided written informed consent.
These adults were administered nelfinavir as 1250 mg twice daily (bid); only one patient had 1500 mg twice daily and one had 625 mg twice daily. Nelfinavir was given using the new formulation of 625-mg tablets [13]. A 250-mg tablet was added for the patient who received 1500 mg bid. A blood sample was taken for genotype before initiating the treatment and 2 weeks later patients underwent four blood samplings, before, 1, 3 and 6 h after drug intake for pharmacokinetic analysis. For each patient, time elapsed between administration and sampling times was carefully recorded. For modelling, it was assumed that patients were at steady state with a dosing interval of 12 h. The trough concentration was that measured the day before drug intake and the three other concentrations were measured after drug intake.
Short-term efficacy was studied using HIV RNA levels at day 0 and week 2. Short-term tolerance (fasten cholesterol, triglyceride and glycaemia) was analysed, based on measurements performed 4 weeks before and 4 weeks after initiating the treatment. A questionnaire for adherence was also used. One adherence covariate was analysed, corresponding to the yes/no answer to the question ‘During the last 4 days, did you forget or delay deliberately or not your antiretroviral drug intake?’
Analytical method
Nelfinavir and M8 plasma concentrations were measured by specific high-performance liquid chromatography. The four participant laboratories were cross-validated before starting the study. Results of the blind interlaboratory quality control at three concentrations for nelfinavir and M8 were within 15% of the target values for medium and high values and within 20% for low values. Lower limits of quantification (LOQ) were 100 ng ml−1 for nelfinavir and 25 ng ml−1 for M8, depending on the method used.
Genotyping
All genotypes were performed in the same laboratory. Total DNA was extracted from plasma samples by use of the QIAamp DNA Blood Mini Kit (Qiagen, Courtaboeuf, France). Genotyping for CYP2C19*2 was performed by a polymerase chain reaction (PCR)–restriction fragment length polymorphism method with allele-specific primers, as described by De Morais et al.[14]. Genotyping for CYP3A4*1B was determined by PCR followed by direct sequencing. PCR was performed by use of a GenAmp PCR System 9700 (Applied Biosystems, Courtaboeuf, France) according to a previously published method [15]. Amplified DNA was purified by use of the QiaQuick DNA Purification System (Qiagen) and sequenced by use of BigDye Terminator chemistry and an ABI PRISM 3100 genetic analyser (Applied Biosystems). Genotyping of CYP3A5*3 and *6 was performed by real-time PCR by use of TaqMan MGB probe technology (Applied Biosystems). MDR1 polymorphisms in exons 21 and 26 were determined by use of previously published methods [16]. For each genotyping analysis, at least two positive controls were used: one homozygous for the wild-type allele and one heterozygous and, when available, one homozygous for the mutated allele. These controls were DNAs that have been sequenced.
Modelling strategy and population pharmacokinetic model
Data were analysed using the nonlinear mixed effect modelling software program NONMEM (version V, level 1.1, double precision) with the DIGITAL FORTRAN compiler [17]. The first-order conditional estimation (FOCE) with interaction method was used. A one-compartment model with first-order absorption, elimination and metabolism to M8 best described nelfinavir data. M8 was modelled by an additional compartment (Figure 1). Parameters of the model were the bioavailability (F), the absorption rate constant (ka), the absorption lag time (tlag), the volumes of distribution of nelfinavir and M8 (V and Vm), the total elimination rate constant for nelfinavir (k corresponding to ke + km in Figure 1), the metabolic rate constant (km) describing the nelfinavir to M8 biotransformation, and the elimination rate constant for M8 (kem). Since nelfinavir was orally administered, only ka, tlag, V/F and k were identifiable for nelfinavir. For M8, since no urinary concentration data were available, and because no literature data were used to fix Vm/F, only Fkm/Vm and kem could be determined. Therefore, the model was reparameterized using an apparent clearance for nelfinavir (CLT/F = k × V/F) and an apparent nelfinavir to M8 biotransformation clearance (CLm/F = km × V/F). The vector of identifiable parameters used in the population analysis was therefore ka, tlag, CLT/F, V/F and kem.
Figure 1.
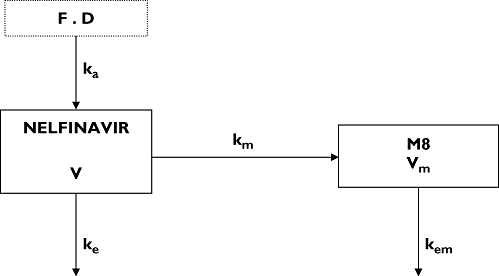
Pharmacokinetic compartment model for nelfinavir and M8 plasma concentration after a nelfinavir oral dose D. Nelfinavir (in compartment 1) undergoes irreversible biotransformation to produce M8 (in compartment 2). F denotes bioavailability of nelfinavir, ka the first-order absorption rate constant, V the nelfinavir distribution volume, ke the nelfinavir elimination constant rate, km the first-order metabolic rate constant, Vm the M8 distribution volume and kem the M8 elimination rate constant
The following equations describe nelfinavir and M8 plasma concentrations:
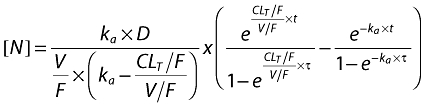 |
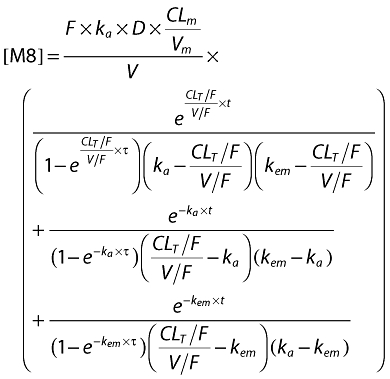 |
with t = delay − tlag if delay >tlag and t = delay − tlag + τ if delay <tlag, where t is the calculated time between start of absorption and sampling, tlag is the estimated absorption lag time, delay is the recorded time elapsed between drug administration and blood sampling and is the time interval between two administrations.
When nelfinavir or M8 concentrations were below the LOQ, we set them to half of the LOQ. Several error models were investigated (i.e. multiplicative and additive error models) to describe residual variability. Proportional model was used for intersubject variability (ISV). Data for nelfinavir and M8 were then fitted jointly. Only significant ISVs on the pharmacokinetic parameter were kept, i.e. a minimum of 3.84 unit decrease using a likelihood ratio test in a backward elimination procedure. From the POSTHOC option of NONMEM applied on this basic model, Empirical Bayes estimates of each parameter were obtained. The effect of each patient covariate was tested on these estimates, using Spearman's nonparametric correlation test for continuous covariates such as age, body weight, body mass index (BMI), albumin and orosomucoid or using the Wilcoxon test for categorical ones such as sex, Centers for Disease Control (CDC) stage of virus infection (C/non C), genotypes (CYP3A4*1B, CYP3A5*3 and *6, CYP2C19*2, MDR1 exon21, MDR1 exon 26), adherence and the co-administration of combivir® (drug combining AZT and 3TC). Co-medication was analysed in two classes: patients who were taking combivir® against other co-medications. Genetic polymorphism was analysed in two different ways: wild-type against heterozygote plus homozygote mutated or wild-type plus heterozygote against homozygote mutated. Covariates that were found to have an effect on a pharmacokinetic parameter with a P-value <0.10 were retained for inclusion in the population model. They were then added one by one to the basic pharmacokinetic model, the most significant at first. Continuous covariates (CO) were tested according to the following equation, using CL for example, 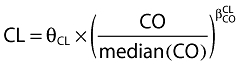 , where θCL is the typical value of clearance for a patient with the median covariate value and
  is the estimated influential factor for the continuous covariate. Categorical covariates (CA) were tested as,
  where CA = 0 or 1. Patients with a missing value for a covariate retained during the first statistical analysis were excluded from the covariate population modelling. The basic model was fitted again with the patients with all covariate values and the covariate could then be tested.
A covariate was kept if its effect was biologically plausible; it produced a minimum reduction of 3.84 in the objective function value (OFV) and a reduction in the variability of the pharmacokinetic parameter, assessed by the associated intersubject variability. An intermediate model with several covariates was then obtained. All the selected covariates were added one by one and kept if responding to the three cited criteria. At the end of this ascendant modelling, the final model was obtained. A backward elimination phase was finally performed by deleting each covariate from the final model in order to calculate the P-value, using a likelihood ratio test.
For evaluation of the goodness-of-fit, the following graphs were performed: observed and predicted concentrations vs. time, observed concentrations vs. population predictions, weighted residuals vs. time and weighted residuals vs. predictions. Similar graphs using individual predictive POSTHOC estimation were displayed. Diagnostic graphics were obtained using the R program [18].
Validation
Nelfinavir and M8 steady-state concentration profiles were simulated and compared with the observed data thanks to visual predictive check in order to evaluate the performance of the model. More precisely, the vector of pharmacokinetic parameters from 1000 patients was simulated using the final model. Each vector parameter was drawn in a normal distribution with a variance corresponding to the ISV previously estimated. A simulated residual error was added to each simulated concentration. The simulations were performed using NONMEM. The 5th, 50th and 95th percentiles of the simulated concentrations at each time were then overlaid on the observed concentration data using R program, and a visual inspection was performed.
Links between concentrations and short-term response/toxicity
For each patient, mean (Cmean,N), maximal (Cmax,N) and trough (Ctrough,N) nelfinavir plasma concentrations and the sum of nelfinavir + M8 trough (Ctrough,NM8) plasma concentrations were derived from the estimated individual pharmacokinetic parameters. The efficacy was studied following the difference in log viral load between the day of initiation of treatment and week 2. The significance of the viral load decrease was first tested using a Wilcoxon nonparametric paired test. With respect to efficacy, the links between Ctrough,N, Ctrough,NM8 and the difference in HIV-1 RNA levels between day 0 and week 2 were evaluated using correlation Spearman tests. A Wilcoxon nonparametric test was also performed on decrease in viral load between patients having or not a Ctrough below the lower limit of therapeutic range (1500 ng ml−1, limit used in the COPHAR 2-ANRS 111 trial).
Toxicity was analysed from the difference between 4 weeks after and before treatment initiation in total cholesterol, high-density lipoprotein cholesterol (HDL-C), triglyceride, and glycaemia and from appearances of diarrhoea (grade 2) between treatment initiation and week 4. The significance of these differences was tested using a Wilcoxon nonparametric paired test. We then performed correlation Spearman tests between Cmean,N, Cmax,N, Ctrough,N and difference in total cholesterol, HDL-C, triglyceride and glycaemia. Wilcoxon nonparametric tests were also used to compare these differences between patients having or not a Ctrough over the upper limit defined in the therapeutic index (5500 ng ml−1, limit used in the COPHAR 2-ANRS 111 trial).
We also assessed the relationship between the genetic polymorphisms remaining in the final population model and Cmean,N, Cmax,N, Ctrough,N and the relationship between these genetic polymorphisms and the efficacy and toxicity outcomes previously described, using Wilcoxon nonparametric tests.
Results
Demographic data
Thirty-four patients were included in the nelfinavir arm. All these patients were available for pharmacokinetic evaluation. A total of 120 nelfinavir concentrations and 119 M8 concentrations were collected. Table 1 summarizes patient characteristics: age, bodyweight, BMI, orosomucoid, albumin, sex, CDC stage, concomitant medications with combivir®, good adherence and genetic polymorphism for genes MDR1 (exon 21 and 26), CYP2C19, CYP3A4 and CYP3A5.
Table 1.
Patient characteristics at baseline
| Median | Min–Max | Nb missing values | |
|---|---|---|---|
| Age (year) | 31 | 19–63 | 0 |
| Bodyweight (kg) | 67.25 | 51–88.5 | 0 |
| BMI (kg m−2) | 22.92 | 17.14–32.47 | 0 |
| Orosomucoid (g l−1) | 0.825 | 0.59–1.47 | 5 |
| Albumin (g l−1) | 40 | 28.7–47 | 9 |
| Sex | Women: 20 | Men: 14 | 0 |
| CDC stage | Stage A or B: 29 | Stage C: 5 | 0 |
| Combivir co-administration | Yes: 24 | No: 10 | 0 |
| Good adherence | Yes: 15 | No: 11 | 8 |
| Genotypes | Wild type | Heterozygotes | Homozygote mutants | Nb missing values |
|---|---|---|---|---|
| MDR1 exon 26 | 13 | 14 | 3 | 4 |
| MDR1 exon 21 | 22 | 5 | 4 | 3 |
| CYP3A4*1B | 12 | 3 | 15 | 4 |
| CYP3A5*3 | 8 | 10 | 15 | 1 |
| CYP2C19*2 | 17 | 11 | 2 | 4 |
Population pharmacokinetics: nelfinavir-M8 pharmacokinetic model building
One nelfinavir and 13 M8 concentrations were lower than the LOQ, so they were set to half of the LOQ. Intersubject variability was described by multiplicative model. The available data were not sufficient to estimate intersubject variability for tlag, V/F and kem, and fixing the variance of these random effects to zero had no influence on the OFV. Residual variabilities were best described by proportional error model. The addition of a correlation between nelfinavir and M8 residual variabilities [r = 0.37 (40%)] decreased OFV by 8.45 units.
Covariates were first tested on Bayesian empiric estimates of ka, CL/F and CLm/Vm from the basic model. The most significant covariate was for CYP2C19 genotypes on CLm/Vm, and a significant difference was found between wild-type (*1/*1, GG) and other patients (*1/*2, AG or *2/*2, AA) (P = 0.01). Co-administration of combivir® increased ka significantly (P = 0.02). Four patients did not have a genotype for the CYP2C19, so they were excluded from the covariate modelling and a basic model was fitted again with the remaining 30 patients. Then, CYP2C19 genotype was first added on  as an inhibitory effect for patients with the mutation. The effect was significant, resulting in a 7.03-unit decrease in the OFV, a 13% decrease in the intersubject variability of CLm/Vm and a better correlation between observed and predicted concentrations. The coefficient
  was equal to 0.98, meaning that the rate of metabolism of nelfinavir to M8 was reduced by 50% in patients with *1/*2 or *2/*2 genotype for CYP2C19 compared with those patients with *1/*1 genotype.
Combivir® co-administration was then added on ka in this intermediate model, but no significant effect was found. Figure 2 displays nelfinavir and M8 observed and predicted plasma concentrations at week 2 vs. time, for CYP2C19 wild type (patients GG for CYP2C19*2) and for CYP2C19 mutated patients (AG or AA for CYP2C19*2). Table 2 summarizes the final population pharmacokinetic estimates in 30 patients.
Figure 2.
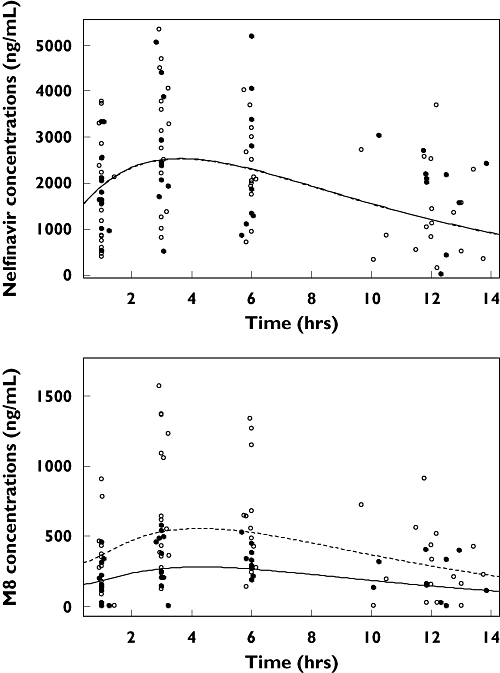
Observed (points) and predicted (lines) plasma concentrations of nelfinavir (top) and M8 (bottom) vs. time: for CYP2C19 wild type, i.e. patients GG for CYP2C19*2 (empty points and dashed lines) and for CYP2C19 mutated patients, i.e. AG or AA for CYP2C19*2 (full points and lines). For nelfinavir, full and dashed lines are superposed
Table 2.
Population pharmacokinetic parameters (and relative standard error in percentage) of nelfinavir and M8 from basic and final models
| Basic model estimate (RSE%) | Final model estimate (RSE%) | |
|---|---|---|
| Structural model | ||
| ka (h−1) | 0.16 (25) | 0.17 (27) |
| tlag (h−1) | 0.83 (6) | 0.82 (6) |
| V/F (l) | 176 (12) | 191 (15) |
| CLT/F (l h−1) | 51.3 (10) | 52 (10) |
 (h−1) (h−1) |
0.26 (40) | 0.39 (35) |
| kem (h−1) | 1.56 (38) | 1.76 (30) |
| / | 0.98 (49) | |
| Statistical model | ||
| ωKa (%) | 102 (37) | 99 (42) |
 (%) (%) |
50 (24) | 49 (26) |
 (%) (%) |
65 (30) | 59 (29) |
| σNFV (%) | 31 (15) | 32 (15) |
| σM8 (%) | 48 (22) | 49 (22) |
| r σNFV − σM8 | / | 0.37 (40) |
Model performance
Final model performance were appreciated by comparing population predicted and individual predicted with observed plasma concentrations and population weighted residuals vs. predicted concentrations and vs. time for nelfinavir and for M8. Visual predictive check of the final population pharmacokinetic model (Figure 3) showed the comparison between the 5th, 95th and 50th predicted percentiles for the 1000 simulations and the observed concentrations of nelfinavir. This evaluation method provided good proof of the model adequacy.
Figure 3.
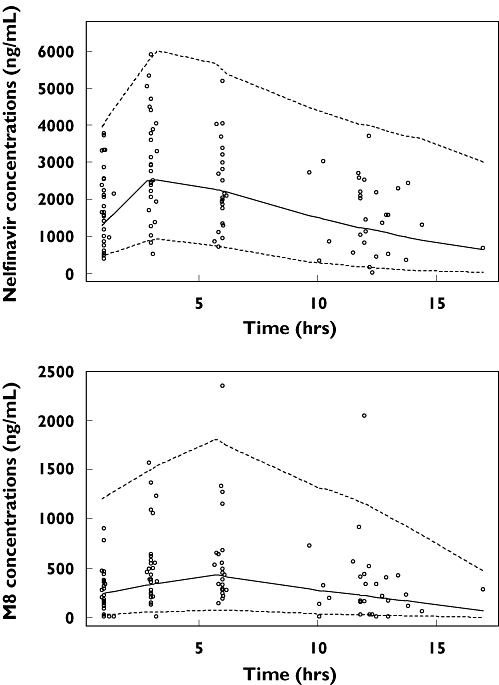
Evaluation of the final model: comparison between the 5th (dash line), 50th (full line) and 95th (dash line) percentile obtained from 1000 simulations and the observed data (points) for nelfinavir (top) and M8 (bottom)
Links between concentrations and short-term response/toxicity
The values of the parameters HIV-1 RNA level, total cholesterol, HDL-cholesterol, glycaemia and triglycerides were available for 30 patients as basal, and as 2 or 4 weeks' treatment, which allowed calculation of their variation and testing the significance of the difference.
The viral load decreased significantly after 2 weeks of treatment (Table 3). However, the significant decrease in HIV-1 RNA between day 0 and week 2 was not correlated to Ctrough,N,, nor to Ctrough,NM8, and was not different between patients with a Ctrough below or above the lower limit of therapeutic range of 1500 ng ml−1.
Table 3.
Evolution of short-term efficacy (during the first 2 weeks of treatment) and toxicity (from 4 weeks before to 4 weeks after initiating treatment) and significance of this evolution
| Basal value | Value at week 2 or 4 | Variation | |||||
|---|---|---|---|---|---|---|---|
| Median | Range | Median | Range | Median | Range | Test P | |
| HIV RNA (log10 copies ml−1) | 4.86 | 2.95–6.04 | 2.93 | 1.60–4.57 | 1.80 | 1.25–2.73 | <10−4 |
| Glycaemia (mmol l−1) | 4.95 | 3.70–6.20 | 4.85 | 4.20–6.80 | 0.21 | −1.5–1.7 | 0.05 |
| Total cholesterol (mmol l−1) | 3.95 | 2.00–6.60 | 4.90 | 2.50–7.70 | 0.81 | −1.49–3.7 | 10−4 |
| HDL-cholesterol (mmol l−1) | 1.17 | 0.46–1.92 | 1.28 | 0.39–2.20 | 0.01 | −1.53–1.69 | 0.17 |
| Triglycerides (mmol l−1) | 0.90 | 0.29–1.91 | 1.23 | 0.44–2.45 | 0.20 | −0.68–1.17 | 0.20 |
Total cholesterol increased significantly after 4 weeks of treatment, in contrast to HDL-cholesterol (Table 3). Nelfinavir Ctrough,N, Cmax,N and Cmean,N were not significantly correlated with total or with HDL-cholesterol evolution. Glycaemia increased after 4 weeks of treatment (P = 0.05) and its evolution was significantly positively correlated to nelfinavir Cmean,N and Ctrough,N (P = 0.02 and P = 0.03, respectively). Although the triglyceride increase was not significant, its evolution was significantly positively correlated to nelfinavir Cmean,N (P = 0.04) (Figure 4). No patient had a Ctrough over the therapeutic index upper limit of 5500 ng ml−1. No grade 2 diarrhoea was recorded.
Figure 4.
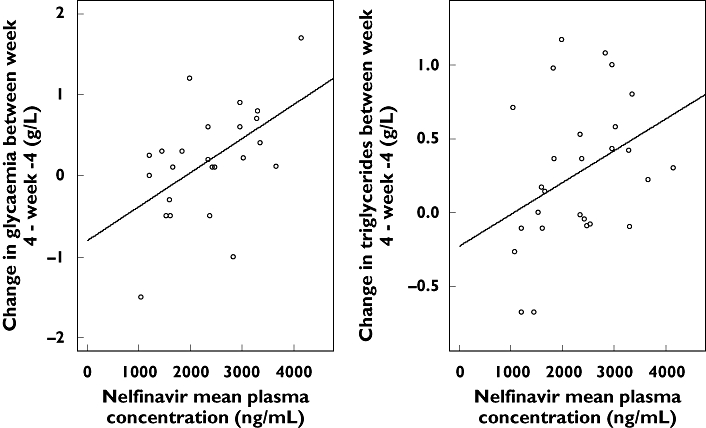
Correlation between Cmean,N and the change in glycaemia or triglyceride rate between week 4 and week −4
No significant differences were seen in Ctrough,N, Ctrough,NM8 or in short-term efficacy or toxicity between patients *1/*1 and patients *1/*2 or *2/*2 for CYP2C19 gene.
Discussion
The concentrations of nelfinavir and of M8 were satisfactorily described by a one-compartment model with first-order absorption and elimination for nelfinavir, with an additional compartment for M8 linked with a first-order rate constant. This joint model has already been used in adults [19, 20]. The following results support the use of this pharmacokinetic model.
Nelfinavir mean plasma clearance was consistent with previously reported values: CLT/F = 52 l h−1 compared with 37.3, 35.5 and 44.9 l h−1 obtained in the Panhard et al.[19], our previous [20] and Jackson et al.[21] studies, respectively.
Nelfinavir to M8 biotransformation and M8 elimination were consistent with our two previous studies (in women and in children [20, 22]) and with the study of Panhard et al.[19]: CLm/Vm = 0.39 h−1 compared with, respectively, 0.65, 0.58 and 0.36 h−1 and kem = 1.76 h−1 compared with 3.3, 1.88 and 1.93, respectively.
Nelfinavir to M8 biotransformation was reduced in patients *1/*2 or *2/*2 for the CYP2C19 genotype compared with the wild-type *1/*1 genotype, which is consistent with the studies of Burger et al.[12] and Haas et al.[11], who found a significantly lower M8 to nelfinavir AUC ratio in patients with the mutation than in wild-type patients. In our study, no patients had liver dysfunction, and none was taking concurrent medications that are potential inhibitors of CYP2C19, so the decrease in nelfinavir to M8 biotransformation could only be attributed to CYP2C19 polymorphism.
A major aim of population pharmacokinetics is to determine which measurable pathophysiological factor can cause changes in the dose–concentration relationship. In this study, only the CYP2C19 genotype was found to influence nelfinavir and M8 pharmacokinetics. Nelfinavir is metabolized exclusively by CYP2C19 into M8 [5]. Nelfinavir and M8 have been described as being equally active [6]. Haas et al.[11] found in 348 HIV-infected adults that patients *1/*2 or *2/*2 had significantly higher nelfinavir and nelfinavir + M8 AUC0−12h than *1/*1 genotype and tended to have a better virological response. We could not detect a significant difference in nelfinavir or nelfinavir + M8 concentrations between the two genotypes. In this study, as we were able to estimate individual pharmacokinetic parameters, we could quantify the effect of CYP2C19 polymorphism directly on these parameters and have a mechanistic approach to the process. We found that the rate of metabolism of nelfinavir to M8 was reduced by 50% in patients with *1/*2 or *2/*2 genotype for CYP2C19 compared with those with the *1/*1 genotype. Moreover, as shown in Figure 2, M8 concentrations were lower in patients *1/*2 or *2/*2 than in *1/*1 patients for CYP2C19, whereas nelfinavir concentrations were similar (Figure 2). This suggests an increase in nelfinavir elimination by CYP3A4, which compensates for the decreased elimination via CYP2C19. Concerning CYP3A4 and MDR1 genes, in agreement with previous studies [9–11], we could not evidence any difference between wild-type and mutated groups in nelfinavir and M8 pharmacokinetics.
Powderly et al.[23] have shown that change in viral load over the first 4 weeks of treatment was predictive of virological response over 48 weeks of treatment. Hoetelmans et al.[24], in 29 HIV-infected, antiretroviral-naive patients, using a quadruple drug regimen (nelfinavir, saquinavir, stavudine and lamivudine), have shown that the median nelfinavir concentration ratio was positively correlated with the elimination rate constant (k) of HIV-1 clearance (k = slope of the curve describing initial log viral load as a function of time). We could not establish a significant relationship between nelfinavir concentrations and the reduction in HIV RNA level after 2 weeks of treatment in our protease inhibitor- naive patients. The main difference from the study of Hoetelmans et al. was that the decrease in HIV RNA was much lower in our study: viral load was divided by 1.80 in 14 days, corresponding to an elimination rate constant for HIV-1 clearance of 0.13 day−1. In the study of Hoetelmans et al. a similar basal viral load was measured, but k was 0.29 day−1, indicating that median viral load was reduced fourfold after 2 weeks of treatment.
Few studies have evaluated cholesterol, triglycerides and glycaemia early changes as a function of nelfinavir plasma concentrations. Like Periard et al.[25], who found that total cholesterol increased slightly but significantly (1.2 ± 0.2 mmol l−1) after 4 weeks of treatment in 21 HIV-1-infected patients, we found a significant increase in total cholesterol in our 30 patients. However, no relationship could be shown between this increase and nelfinavir plasma concentrations. Similarly, Reijers et al. have found no relationship between elevated cholesterol and plasma nelfinavir drug exposure, although the occurrence of elevated cholesterol was frequent, i.e. in 35% of their patients on quadruple regimen (stavudine, lamivudine, saquinavir and nelfinavir). Furthermore, Reijers et al.[26] have found that nelfinavir concentrations are not higher in hypercholesterolaemic (>6.2 mmol l−1) or in hypertriglyceridaemic (>4.5 mmol l−1) patients. In our study, no patient had a triglyceride rate >4.5 mmol l−1, but a significant positive correlation was found between triglyceride rate and nelfinavir Cmean,N (P = 0.04). We also found that nelfinavir Cmean,N and Ctrough,N were significantly positively correlated with glycaemia evolution (between 4 weeks after and before initiating the treatment) (P = 0.02 and P = 0.03, respectively).
The rate of metabolism of nelfinavir to M8 was reduced by 50% in patients with *1/*2 or *2/*2 genotype for CYP2C19 compared with those patients with *1/*1 genotype, without any significant modifications of nelfinavir trough concentrations, efficacy or toxicity. In these protease inhibitor-naive patients, efficacy could not be related to nelfinavir plasma concentrations, but triglycerides and glycaemia increased with nelfinavir exposure.
Competing interests: None to declare.
For this analysis, D.H. was supported by a CRES (contrat de recherche stratégie) from INSERM. The authors thank the study participants and the participating clinicians at each site, Agence Nationale de Recherche sur le SIDA (ANRS, essai 111) for financial support, and Roche for providing nelfinavir, Dr Agnes Certain for organizing the drug supply to all centres. Steering committee: principal investigator: D. Salmon-Céron, X. Duval, Statistics: F. Mentré; other members S. Auleley, M. Biour, M. J. Commoy, B. Diquet, C. Goujard, C. Katlama, C. Lascoux, M. Legrand, A. Métro, G. Peytavin, E. Rey, A. M. Taburet, J. M. Tréluyer. Safety committee: S. Auleley, M. Biour, A. Métro, C. Lascoux, D. Salmon-Céron. Pharmacological monitoring committee: X. Duval, E. Rey, J. M. Tréluyer. Independent committee: Pr Rouzioux, Dr Piketti, Mr Flandre, Dr Zenut, Dr Marquet. Clinical centres: Dr Bentata, Dr Mansouri, Mme Touam, Pr Sereni, Dr Lascoux, Dr Pintado, Dr Goujard, Mme Mole, Dr Sellier, Dr Bendenoun, Dr Rami, Mme Parrinello, Dr Jeantils, Mme Tassi, Pr Vittecoq, Dr Teicher, Mme Mallet, Pr Dupont, Dr Lahoulou, Soeur AZAR, Pr Rozembaum, Dr Slama, Dr Naït-Ighil,Baakili, Courtial-Destembert, Pr Vildé, Pr Leport, Dr Duval, Dr Al Kaied, Pr Salmon, Dr Spiridon, Dr Lesprit, Mme Chesnel, Pr Katlama, Dr Schneider, Mme Schoen, Pr Molina, Dr Ponscarme, Dr Colin de Verdière, Pr Morlat, Dr Bonarek, Dr Joly, Dr Ralaimazava, Mme Meridda, Mme Le Gac, Pr Raffi, Dr Allavena, Mr Hüe, Mme Sicot, Dr Perré, Dr Leautez, Dr Aubry, Mme Suaud, Pr Dellamonica, Dr Rahelinirina, Pr Michelet, Dr Bouvier, Pr Bazin, Dr Goubin, Pr May, Dr Boyer, Pr Rouveix, Dr Dupont, Mme Berthé. Pharmacological centres: Dr Rey, Dr Tréluyer, Dr Abbara, Dr Audoul, Dr Tran, Dr Sauvageon, Dr Poirier, Dr Taburet, Dr Vincent, Dr Aymard, Dr Peytavin, Dr Lamotte, Dr Dailly, Dr Garraffo, Dr Lavrut, Dr Molimard, Dr Titier, Dr Tribut, Dr Hulin, Dr Huet, Dr Delhotal, Dr Hoizey. Virological centres: Dr Alloui, Dr Baazia, Dr Palmer, Dr Labaky, Dr Idri, Dr Mazeron, Dr Bensidhoum, Dr Beaulieux, Dr Burgard, Dr Zatla, Dr Chambs, Dr Beniken, Dr Bouvier-Alias, Dr Miladi, Dr Gourlain, Dr Amellal, Dr Garrigue, Dr Pellegrin, Dr Ferré, Dr Garnier, Dr Poirier, Dr Cottalorda, Mme Benhamou, Dr Maillard, Dr Venard, Dr Soussan. Monitoring centres: S. Auleley, E. Marcault, F. Mentré. Statistics: E. Bougen, F. Mentré, X. Panhard.
References
- 1.Palella FJ, Jr, Delaney KM, Moorman AC, Loveless MO, Fuhrer J, Satten GA, Aschman DJ, Holmberg SD. Declining morbidity and mortality among patients with advanced human immunodeficiency virus infection. HIV Outpatient Study Investigations. N Engl J Med. 1998;338:853–60. doi: 10.1056/NEJM199803263381301. [DOI] [PubMed] [Google Scholar]
- 2.Hammer SM, Squires KE, Hughes MD, Grimes JM, Demeter LM, Currier JS, Eron JJ, Feinberg JE, Balfour HH, Deyton LR, Chodakewitz JA, Fischl MA. A controlled trial of two nucleoside analogues plus indinavir in persons with human immunodeficiency virus infection and CD4 cell counts of 200 per cubic millimeter or less. N Engl J Med. 1997;337:725–33. doi: 10.1056/NEJM199709113371101. [DOI] [PubMed] [Google Scholar]
- 3.Viracept package insert, 2001; Agouron Pharmaceuticals, La Jolla, CA, USA
- 4.Kim RB, Fromm MF, Wandel C, Leake B, Wood AJ, Roden DM, Wilkinson GR. The drug transporter P-glycoprotein limits oral absorption and brain entry of HIV-1 protease inhibitors. J Clin Invest. 1998;101:289–94. doi: 10.1172/JCI1269. [DOI] [PMC free article] [PubMed] [Google Scholar]
- 5.Lillibridge JH, Lee CA, Pithavala YK. XII Annual Meeting and Exposition of the American Association of Pharmaceutical Scientists. Arlington, VA: American Association of Pharmaceutical Scientists; 1998. [27 September 2007]. The role of polymorphic CYP2C19 in the metabolism of nelfinavir mesylate. Abstract 3035. Available at http://www.aapspharmsci.org/abstracts/AM_1998/1156.html. [Google Scholar]
- 6.Zhang KE, Wu E, Patick AK, Kerr B, Zorbas M, Lankford A, Kobayashi T, Maeda Y, Shetty B, Webber S. Circulating metabolites of the human immunodeficiency virus protease inhibitor nelfinavir in humans: structural identification, levels in plasma, and antiviral activities. Antimicrob Agents Chemother. 2001;45:1086–93. doi: 10.1128/AAC.45.4.1086-1093.2001. [DOI] [PMC free article] [PubMed] [Google Scholar]
- 7.Tran A, Jullien V, Alexandre J, Rey E, Rabillon F, Girre V, Dieras V, Pons G, Goldwasser F, Tréluyer JM. Pharmacokinetics and toxicity of docetaxel: role of CYP3A, MDR1, and GST polymorphisms. Clin Pharmacol Ther. 2006;79:570–80. doi: 10.1016/j.clpt.2006.02.003. [DOI] [PubMed] [Google Scholar]
- 8.Hustert E, Haberl M, Burk O, Wolbold R, He YQ, Klein K, Nuessler AC, Neuhaus P, Klattig J, Eiselt R, Koch I, Zibat A, Brockmoller J, Halpert JR, Zanger UM, Wojnowski L. The genetic determinants of the CYP3A5 polymorphism. Pharmacogenetics. 2001;11:773–9. doi: 10.1097/00008571-200112000-00005. [DOI] [PubMed] [Google Scholar]
- 9.Fellay J, Marzolini C, Meaden ER, Back DJ, Buclin T, Chave JP, Decosterd LA, Furrer H, Opravil M, Pantaleo G, Retelska D, Ruiz L, Schinkel AH, Vernazza P, Eap CB, Telenti A Swiss HIV Cohort Study. Response to antiretroviral treatment in HIV-1-infected individuals with allelic variants of the multidrug resistance transporter 1: a pharmacogenetics study. Lancet. 2002;359:30–6. doi: 10.1016/S0140-6736(02)07276-8. [DOI] [PubMed] [Google Scholar]
- 10.Saitoh A, Singh KK, Powell CA, Fenton T, Fletcher CV, Brundage R, Starr S, Spector SA. An MDR1-3435 variant is associated with higher plasma nelfinavir levels and more rapid virologic response in HIV-1 infected children. AIDS. 2005;19:371–80. doi: 10.1097/01.aids.0000161766.13782.2f. [DOI] [PubMed] [Google Scholar]
- 11.Haas DW, Smeaton LM, Shafer RW, Robbins GK, Morse GD, Labbe L, Wilkinson GR, Clifford DB, D'Aquila RT, De Gruttola V, Pollard RB, Merigan TC, Hirsch MS, George AL, Donahue JP, Kim RB. Pharmacogenetics of long-term responses to antiretroviral regimens containing Efavirenz and/or Nelfinavir: an Adult Aids Clinical Trials Group Study. J Infect Dis. 2005;192:1931–42. doi: 10.1086/497610. [DOI] [PubMed] [Google Scholar]
- 12.Burger DM, Schwietert HR, Colbers EP, Becker M. The effect of the CYP2C19*2 heterozygote genotype on the pharmacokinetics of nelfinavir. Br J Clin Pharmacol. 2006;62:250–2. doi: 10.1111/j.1365-2125.2006.02635.x. [DOI] [PMC free article] [PubMed] [Google Scholar]
- 13.Kaeser B, Charoin JE, Gerber M, Oxley P, Birnboeck H, Saiedabadi N, Banken L. Assessment of the bioequivalence of two nelfinavir tablet formulations under fed and fasted conditions in healthy subjects. Int J Clin Pharmacol Ther. 2005;43:154–62. doi: 10.5414/cpp43154. [DOI] [PubMed] [Google Scholar]
- 14.De Morais SMF, Wilkinson GR, Blaisdell J, Meyer UA, Nakamura K, Goldstein JA. Identification of a new genetic defect responsible for the polymorphism of (S)-mephenytoin metabolism in Japanese. Mol Pharmacol. 1994;46:594–8. [PubMed] [Google Scholar]
- 15.Dally H, Edler L, Jager B, Schmezer P, Spiegelhalder B, Dienemann H, Drings P, Schulz V, Kayser K, Bartsch H, Risch A. The CYP3A4*1B allele increases risk for small cell lung cancer: effect of gender and smoking dose. Pharmacogenetics. 2003;13:607–18. doi: 10.1097/00008571-200310000-00004. [DOI] [PubMed] [Google Scholar]
- 16.Cascorbi I, Gerloff T, Johne A, Meisel C, Hoffmeyer S, Schwab M, Schaeffeler E, Eichelbaum M, Brinkmann U, Roots I. Frequency of single nucleotide polymorphisms in the P-glycoprotein drug transporter MDR1 gene in white subjects. Clin Pharmacol Ther. 2001;69:169–74. doi: 10.1067/mcp.2001.114164. [DOI] [PubMed] [Google Scholar]
- 17.Beal SL, Sheiner LB. NONMEM User's Guide. University of California at San Francisco: NONMEM Project Group; 1998. [Google Scholar]
- 18.Ihaka R, Gentleman R. R: a language for data analysis and graphics. J Comput Graphic Stat. 1996;5:299. [Google Scholar]
- 19.Panhard X, Goujard C, Legrand M, Taburet AM, Diquet B, Mentré F COPHAR 1-ANRS Study Group. Population pharmacokinetic analysis for nelfinavir and its metabolite M8 in virologically controlled HIV-infected patients on HAART. Br J Clin Pharmacol. 2005;60:390–403. doi: 10.1111/j.1365-2125.2005.02456.x. [DOI] [PMC free article] [PubMed] [Google Scholar]
- 20.Hirt D, Treluyer JM, Jullien V, Firtion G, Chappuy H, Rey E, Pons G, Mandelbrot L, Urien S. Pregnancy-related effects on nelfinavir and M8 pharmacokinetics: a population study in 133 women. Antimicrob Agents Chemother. 2006;50:2079–86. doi: 10.1128/AAC.01596-05. [DOI] [PMC free article] [PubMed] [Google Scholar]
- 21.Jackson KA, Rosenbaum SE, Kerr BM, Pithavala YK, Yuen G, Dudley MN. A population pharmacokinetic analysis of nelfinavir mesylate in human immunodeficiency virus-infected patients enrolled in a phase III clinical trial. Antimicrob Agents Chemother. 2000;44:1832–7. doi: 10.1128/aac.44.7.1832-1837.2000. [DOI] [PMC free article] [PubMed] [Google Scholar]
- 22.Hirt D, Urien S, Jullien V, Firtion G, Rey E, Pons G, Blanche S, Treluyer JM. Age-related effects on nelfinavir and M8 pharmacokinetics: a population study with 182 children. Antimicrob Agents Chemother. 2006;50:910–6. doi: 10.1128/AAC.50.3.910-916.2006. [DOI] [PMC free article] [PubMed] [Google Scholar]
- 23.Powderly WG, Saag MS, Chapman S, Yu G, Quart B, Clendeninn NJ. Predictors of optimal virological response to potent antiretroviral therapy. AIDS. 1999;13:1873–80. doi: 10.1097/00002030-199910010-00009. [DOI] [PubMed] [Google Scholar]
- 24.Hoetelmans RM, Reijers MH, Weverling GJ, ten Kate RW, Wit FW, Mulder JW, Weigel HM, Frissen PH, Roos M, Jurriaans S, Schuitemaker H, de Wolf F, Beijnen JH, Lange JM. The effect of plasma drug concentrations on HIV-1 clearance rate during quadruple drug therapy. AIDS. 1998;12:F111–5. doi: 10.1097/00002030-199811000-00002. [DOI] [PubMed] [Google Scholar]
- 25.Periard D, Telenti A, Sudre P, Cheseaux JJ, Halfon P, Reymond MJ, Marcovina SM, Glauser MP, Nicod P, Darioli R, Mooser V. Atherogenic dyslipidemia in HIV-infected individuals treated with protease inhibitors. The Swiss HIV Cohort Study. Circulation. 1999;100:700–5. doi: 10.1161/01.cir.100.7.700. [DOI] [PubMed] [Google Scholar]
- 26.Reijers MH, Weigel HM, Hart AA, Ten Kate RW, Mulder JW, Reiss P, Schuitemaker H, Hoetelmans RM, Weverling GJ, Lange JM. Toxicity and drug exposure in a quadruple drug regimen in HIV-1 infected patients participating in the ADAM study. AIDS. 2000;14:59–67. doi: 10.1097/00002030-200001070-00007. [DOI] [PubMed] [Google Scholar]