Abstract
The organization of Ras proteins into nanoclusters on the inner plasma membrane is essential for Ras signal transduction, but the mechanisms that drive nanoclustering are unknown. Here we show that epidermal growth factor receptor activation stimulates the formation of H-Ras.GTP-Galectin-1 (Gal-1) complexes on the plasma membrane that are then assembled into transient nanoclusters. Gal-1 is therefore an integral structural component of the H-Ras–signaling nanocluster. Increasing Gal-1 levels increases the stability of H-Ras nanoclusters, leading to enhanced effector recruitment and signal output. Elements in the H-Ras C-terminal hypervariable region and an activated G-domain are required for H-Ras–Gal-1 interaction. Palmitoylation is not required for H-Ras–Gal-1 complex formation, but is required to anchor H-Ras–Gal-1 complexes to the plasma membrane. Our data suggest a mechanism for H-Ras nanoclustering that involves a dual role for Gal-1 as a critical scaffolding protein and a molecular chaperone that contributes to H-Ras trafficking by returning depalmitoylated H-Ras to the Golgi complex for repalmitoylation.
INTRODUCTION
Ras GTPases regulate diverse signaling pathways that control cell growth and differentiation (Cox and Der, 2003; Downward, 2003). Ras signal transduction can take place from the Golgi complex and perhaps mitochondrial membranes (Chiu et al., 2002; Bivona et al., 2006), but the specific contribution of membrane localization to signal output is best characterized for Ras on the plasma membrane. Here, ∼40% of Ras proteins are organized into nanoscale domains called nanoclusters (Prior et al., 2003; Rotblat et al., 2004b; Plowman et al., 2005; Roy et al., 2005). Nanoclusters comprise ∼7 Ras proteins and have radii in the range of 6–11 nm. Ras proteins that are not in nanoclusters are randomly arrayed as monomers over the plasma membrane. Different Ras isoforms drive the formation of spatially distinct nanoclusters, which have varying requirements for plasma membrane cholesterol and the actin cytoskeleton. Importantly, Ras nanoclusters are the sites to which cytosolic effectors such as Raf-1 are recruited and activated (Tian et al., 2007). In the case of epidermal growth factor (EGF)-regulated mitogen-activated protein kinase (MAPK) signaling, activated Ras nanoclusters operate as digital switches that are essential for high-fidelity signal transduction across the plasma membrane (Kenworthy, 2007; Tian et al., 2007).
H-Ras undergoes GTP-dependent lateral segregation between different types of nanoclusters (Prior et al., 2003; Plowman et al., 2005). GDP-H-Ras forms cholesterol-dependent nanoclusters with radii of ∼12 nm, whereas GTP-H-Ras forms cholesterol-independent nanoclusters with radii of 6–8 nm (Prior et al., 2003; Plowman et al., 2005). The features of H-Ras that are essential for nucleotide-regulated exchange between GTP and GDP nanoclusters have been mapped. These include farnesylation of Cys186, palmitoylation of Cys184, specific amino acids sequences within region 1 (residues 166–172) of the hypervariable region (HVR), and correct spacing of region 1 from the membrane anchor provided by region 2 (residues 173–179) of the HVR. In addition, recent molecular dynamic simulations and cell biological experiments suggest that basic residues in helix α4 play an important role in stabilizing the membrane contacts of GTP-H-Ras (Gorfe et al., 2007). Precisely how these structural elements of H-Ras participate in the molecular mechanisms that actually drive Ras nanoclustering however remains unclear.
Galectin-1 (Gal-1) is recruited to the plasma membrane in response to H-Ras activation (Paz et al., 2001), and H- RasG12V and Gal-1 are enriched in cholesterol-independent membrane fractions (Ashery et al., 2006). Gal-1 appears to be functionally important for H-Ras nanoclustering (Prior et al., 2003). Ectopic expression of Gal-1 increases the size of GTP-H-Ras nanoclusters (Hancock and Parton, 2005), whereas knockdown of Gal-1 expression abrogates GTP-H-Ras nanoclustering (Prior et al., 2003). Furthermore, a Gal-1–mediated increase in GTP-H-Ras nanoclustering is correlated with enhanced transforming potential of H-RasG12V (Elad-Sfadia et al., 2002; Rotblat et al., 2004a). In vitro biochemical experiments show that H-RasG12V binds to Gal-1 via an interaction that involves the Ras farnesyl group and a hydrophobic pocket in Gal-1 (Paz et al., 2001; Rotblat et al., 2004a). A single point mutation (L11A) in the Gal-1 hydrophobic pocket yields a Gal-1 interfering mutant that displaces H-RasG12V from the plasma membrane and inhibits Ras biological activity (Rotblat et al., 2004a).
Taken together these studies strongly suggest that a direct molecular interaction between H-Ras and Gal-1 in intact cells may be required for the formation of GTP-H-Ras–signaling nanoclusters. Here we formally test this hypothesis using immuno-electron microscopy (EM) spatial mapping in combination with fluorescence lifetime imaging–fluorescence resonance energy transfer (FLIM-FRET) and bimolecular fluorescence complementation (BiFC) microscopy to define the specific role of Gal-1 in H-Ras nanocluster formation and signal transduction. We show for the first time that Gal-1 is an integral component of the H-Ras.GTP nanocluster and regulates the duration of signal transduction by stabilizing these domains. We also define the molecular components within H-Ras that regulate Gal-1 interactions on the plasma membrane in intact cells. These results lead both to a new model for H-Ras nanocluster formation and identify a hitherto unsuspected role for Gal-1 as a cytosolic chaperone for depalmitoylated H-Ras.
MATERIALS AND METHODS
Construction of Plasmids and Vectors
All Ras mutants and Gal-1 vectors used in this study have been previously described (Niv et al., 1999, 2002; Paz et al., 2001; Jaumot et al., 2002; Roy et al., 2005). The constructs Prtl2-Y1N and Prtl2-Y2N (Bracha-Drori et al., 2004) were a gift from S. Yalovsky and N. Ohad (Tel Aviv University, Israel). The Prtl2-Y1N construct contains a cDNA encoding for the N-terminal fragment of yellow fluorescent protein (YN; residues 1–54 of YFP [yellow fluorescent protein]) fused to a 5-amino-acid linker (RSIAT), which is fused in turn to a 9-amino-acid EE tag. The Prtl2-Y2N construct contains a cDNA encoding for the C-terminal fragment of YFP (YC; residues 155–238 of YFP) fused to a 17-amino-acid linker (RPACKIPNDLKQKVMNH), which is fused in turn to a 9-amino acid hemagglutinin (HA) tag. Gal-1, H-Ras, and mutant H-Ras cDNAs were cloned into these vectors and verified by sequencing.
Cell Cultures and Transfection Procedures
Cells were incubated at 37°C in a humidified atmosphere with 5% CO2. HEK293 (human embryonic kidney) cells were maintained in DMEM containing 10% fetal calf serum (FCS), 2 mM l-glutamine, 100 U/ml penicillin, and 100 g/ml streptomycin. BHK (baby hamster kidney) cells were grown in OptiMem with 2.5% FCS, 10% tryptosephosphate broth, 100 U/ml penicillin, and 100 g/ml streptomycin. HEK293 and BHK cells were transfected with a total of 2 μg DNA (1 μg YC and 1 μg YN construct) using calcium phosphate (Sigma-Aldrich, St. Louis, MO) or jetPE reagent, respectively, according to the manufacturer's instructions.
Western Blot Analysis
HEK293 or BHK cells were lysed, and 20–50 μg proteins were subjected to SDS-PAGE electrophoresis followed by Western immunoblot analysis as described (Paz et al., 2001), using pan-Ras, Gal-1, YN fragment, YC fragment, phospho-ERK, and ERK2 antibodies. Signals were visualized using enhanced chemiluminescence (ECL) reagents (Amersham Pharmacia Biotech, Arlington Heights, IL) and quantified by densitometry with Image Master VDS-CL (Amersham) using ImageJ software (http://rsb.info.nih.gov/ij/) or Lumi-Imager F1 software (Roche, Indianapolis, IN).
Live Cell Fluorescence Confocal Microscopy
BHK or HEK293 cells plated on coverslips were maintained in Hanks' balanced salt solution supplemented with 10 mM HEPES, pH 7.2, during imaging. Cells were imaged by a Zeiss LSM 510 or an LSM META confocal microscope (Thornwood, NY) fitted with a yellow fluorescence filter for detection of BiFC, as described (Ozalp et al., 2005) or with a cyan fluorescent protein (CFP) filter. The fluorescence intensity of YN-Gal-1/YC-H-RasG12V and YN-Gal-1/YC-H-Ras complexes was analyzed using ImageJ software. The border of each cell was traced to calculate the average pixel intensity for the whole cell.
Quantification of BiFC by Flow Cytometry
HEK293 cells were resuspended in phosphate-buffered saline (PBS; 0.5 × 10⁶ cells/0.5 ml PBS) and analyzed by fluorescence-activated cell sorter (FACS; FACSCalibur, Becton Dickinson, Los Angeles, CA). To obtain the net fluorescence (total minus autofluorescence), measurements from 10,000 cells were collected and analyzed by CellQuest software (BD Biosciences, San Diego, CA).
FLIM-FRET Microscopy
FLIM experiments were carried out using a lifetime fluorescence imaging attachment (Lambert Instruments, Leutingewolde, The Netherlands) on an inverted microscope (Olympus IX71, Melville, NY). BHK cells transiently expressing mGFP-H-Ras constructs (donor), alone or with mRFP-Gal-1 (acceptor; using a 1:3 ratio of plasmid DNA) were excited using a sinusoidally modulated 3 W, 470-nm LED at 80 MHz under epi-illumination. Fluorescein was used as a lifetime reference standard. Cells were imaged with a 60×, NA 1.45 oil objective using an appropriate green fluorescent protein (GFP) filter set. The phase and modulation were determined from a set of 12 phase settings using the manufacturer's software. Resolution of two lifetimes in the frequency domain was performed using a graphical method (Clayton et al., 2004) mathematically identical to global analysis algorithms (Verveer and Bastiaens, 2003; Esposito et al., 2005). The analysis yields the monomeric green fluorescent protein (mGFP) lifetime of free mGFP donor (= τ1), the mGFP lifetime in donor acceptor complexes (= τ2), and estimates the fraction of mGFP in donor:acceptor complexes (α). Analysis was performed on a cell-by-cell basis. Average FRET efficiency (= 1 − τ2/τ1) was 53.4 ± 1.35% (mean ± SEM).
Electron Microscopy
Apical plasma membrane sheets were prepared, fixed with 4% PFA, 0.1% glutaraldehyde, and labeled with affinity-purified anti-GFP or anti-mRFP antisera coupled directly to 5-nm gold as described previously (Prior et al., 2003; Plowman et al., 2005). For bivariate analysis plasma membrane sheets were labeled sequentially with anti-mRFP (2-nm gold) and anti-GFP (6-nm gold) antibodies. Digital images of the immunogold labeled plasma membrane sheets were taken at 100,000× magnification in an electron microscope (Jeol 1011, Peabody, MA). Intact 1-μm2 areas of the plasma membrane sheet were identified using Image J and the (x,y) coordinates of the gold particles determined as described (Prior et al., 2003; Plowman et al., 2005). Bootstrap tests to examine differences between replicated point patterns were constructed exactly as described (Diggle et al., 2000), and statistical significance was evaluated against 1000 bootstrap samples.
Fluorescence Recovery after Photobleaching
Confocal fluorescence recovery after photobleaching (FRAP) experiments to monitor FRAP at the Golgi complex were conducted on COS-7 cells transfected with vectors encoding the various GFP- and YC- tagged H-Ras proteins and Gal-1 or YC-Gal-1 proteins. Cells were pretreated with 50 μM cycloheximide for 2 h. Fluorescence was bleached at a 488-nm (GFP) or 514-nm (BiFC, complemented YFP) polygon region comprising the Golgi complex, and scanned images were collected at the indicated times. Fluorescence was quantified using ImageJ, and the ratio of the mean fluorescence of the Golgi complex over the total cell fluorescence was determined. For each time point the ratio was normalized to the ratio after the bleach and the fraction of recovery. Fluorescence recovery half times were calculated from the time-dependent recovery curves generated by fitting the data to a single exponent. For presentation purposes only images were processed and corrected for photobleach using the ImageJ “bleach correction” plug-in (http://www.uhnresearch.ca/facilities/wcif/imagej/t.htm#t_bleach).
RESULTS
Gal-1 Colocalizes to H-RasG12V Nanoclusters
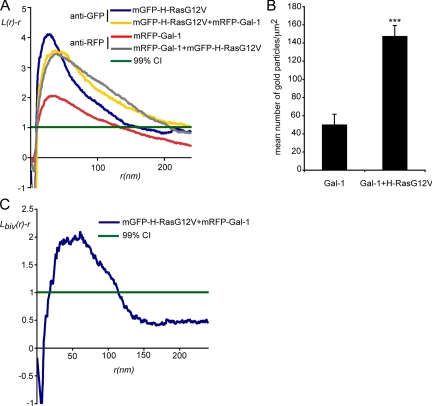
We have shown previously that H-Ras.GTP nanoclustering can be modulated by Gal-1 expression level (Prior et al., 2003; Hancock and Parton, 2005). To determine how Gal-1 might regulate H-Ras.GTP nanocluster formation, we investigated the distribution of mRFP-Gal-1 on intact plasma membrane sheets using EM spatial mapping. In serum-starved cells, in the absence of H-RasG12V, only a low level of mRFP-Gal-1 was detected on the plasma membrane sheets by immunogold labeling; spatial point pattern analysis of the gold particles showed that the plasma membrane-localized mRFP-Gal-1 was clustered (Figure 1, A and B). However, expression of mGFP-H-RasG12V resulted in a substantial increase both in the extent of mRFP-Gal-1 clustering (Figure 1A) and in the total amount of mRFP-Gal-1 recruited to the plasma membrane (Figure 1B). This result suggests that Gal-1 membrane localization and nanoclustering are directly regulated by an interaction with H-RasG12V. Interestingly, the clustering parameters (Lmax and supr) of the mRFP-Gal-1 point pattern in the presence of mGFP-H-RasG12V, were very similar to the clustering parameters of the mGFP-H-RasG12V point pattern (Figure 1A), indicating that the two proteins might exist in the same domain. To validate this interpretation plasma membrane sheets from cells coexpressing mGFP-H-RasG12V and mRFP-Gal-1 were colabeled with different sized gold particles. The bivariate K-function analysis of the resulting 2 nm-/6-nm point pattern shows that H-RasG12V and Gal-1 colocalize in nanoscale clusters on the inner leaflet of the plasma membrane (Figure 1C). These results formally demonstrate that Gal-1 is a component of GTP-H-Ras–signaling nanoclusters.
Figure 1.
Gal-1 is a structural component of H-RasG12V nanoclusters. (A) Plasma membrane sheets were prepared from serum-starved cells expressing mRFP-Gal-1, mGFP-H-RasG12V, or expressing mRFP-Gal-1 and mGFP-H-RasG12V and labeled with anti-GFP or anti-mRFP antibodies conjugated to 5-nm gold. The spatial distribution of the resulting gold patterns was analyzed by Ripley's K-function. L(r) − r values above the 99% confidence interval (99% CI) for complete spatial randomness (CSR) indicate clustering at the value of r. The maximum value of L(r) − r occurs at supr. Coexpression of mGFP-H-RasG12V significantly increases Lmax and supr of the mRFP-Gal-1 pattern (p = 0.001). Clustering of mGFP-H-RasG12V was significantly changed when coexpressed with mRFP-Gal-1 (p = 0.001). K-functions are weighted means (n ≥ 8) standardized on the 99% CI. Statistical significance was assessed using bootstrap tests. (B) Plasma membrane recruitment of mRFP-Gal-1 in the presence or absence of mGFP-H-RasG12V. Plasma membrane sheets were labeled with anti-mRFP antibody conjugated to 5-nm gold and the level of gold labeling/μm2 was calculated. The graph shows means (± SEM, n = 8–19), significance differences were assessed in t tests. Expression of H-RasG12V significantly increases Gal-1 membrane recruitment (***p < 0.001). (C) Colocalization of mRFP-Gal-1 and mGFP-H-RasG12V. Plasma membrane sheets generated from cells expressing mRFP-Gal-1 and mGFP-H-RasG12V were colabeled with anti-mRFP (2 nm gold) and anti-GFP (6 nm gold) antibodies. Lbiv(r) − r curves above the 99% CI indicate significant colocalization. The bivariate K-functions are weighted means (n = 5) standardized on the 99% CI.
Gal-1 Preferentially Interacts with H-Ras.GTP
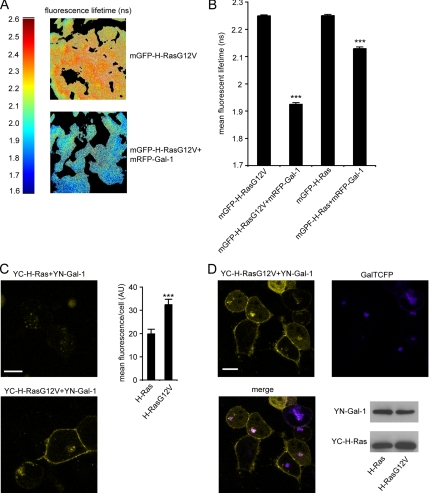
To precisely quantify the degree to which H-Ras.GDP and H-Ras.GTP interact with Gal-1 in intact cells we used FLIM-FRET. FLIM-FRET quantifies the proximity of two proteins by measuring changes in the fluorescence lifetime of the donor fluorophore, in this case mGFP, when it interacts with the acceptor fluorophore mRFP. We first analyzed cells expressing mGFP-H-Ras or mGFP-H-RasG12V in the presence or absence of mRFP-Gal-1. The fluorescence lifetime of mGFP-H-RasG12V was measured as ∼2.2 ns when expressed alone, but when coexpressed with mRFP-Gal-1 the fluorescence lifetime of mGFP-H-RasG12V decreased to 1.9 ns, a highly significant change (p ≪ 0.0001; Figure 2A and B), indicative of a strong molecular interaction between the proteins attached to mGFP and mRFP. In contrast, the change in fluorescence lifetime of mGFP-H-Ras in cells expressing mRFP-Gal-1, was substantially smaller, consistent with biochemical data indicating that Gal-1 preferentially interacts with GTP-bound H-Ras (Paz et al., 2001; Elad-Sfadia et al., 2002; Rotblat et al., 2004a).
Figure 2.
Gal-1 interacts preferentially with H-Ras.GTP. BHK cells expressing mGFP-H-Ras or mGFP-H-RasG12V, alone, or with mRFP-Gal-1 were imaged in the frequency domain in a wide-field FLIM-FRET microscope. (A) Representative heat map images of the cells showing fluorescence lifetime of mGFP-H-RasG12V in presence or absence of mRFP-Gal-1. (B) Mean fluorescence lifetime of mGFP (± SEM) measured in 54–132 cells. Significant differences from control mGFP-H-RasG12V or mGFP-H-Ras lifetimes were assessed using t tests (***p ≪ 0.0001). (C) HEK 293 or BHK cells were cotransfected with YC-H-Ras and YN-Gal-1 or with YC-H-RasG12V and YN-Gal-1 and imaged by fluorescence confocal microscopy. The resulting BiFC indicates a strong direct interaction of H-RasG12V with Gal-1 in the plasma membrane and the Golgi complex. Typical YFP images of the HEK 293 cotransfectants are shown (left panel; bar, 10 μm). Similar images were obtained with the BHK cotransfectants (not shown). The graph shows mean cell fluorescence intensity of YC-H-RasG12V/YN-Gal-1 compared with YC-H-Ras/YN-Gal-1 (±SEM, n = 30), ***p < 0.0001 evaluated in t tests. (D) HEK 293 cells were cotransfected with YC-H-RasG12V/YN-Gal-1/GalTCFP and imaged by dual fluorescence confocal microscopy. Typical YFP and CFP images and their overlay show colocalization of YC-H-RasG12V/YN-Gal-1 complexes and the Golgi marker GalT-CFP. Representative immunoblots confirming similar transfection efficiencies are shown.
To investigate the subcellular localization of H-Ras/Gal-1 complexes in live cells, we used BiFC (Hu et al., 2002). Here yellow fluorescent protein (YFP) is split into two nonfluorescent fragments (the N-terminal YN and the C-terminal YC) that are fused to the protein of interest (YC-) H-Ras and its suspected binding partner (YN-) Gal-1 (a schematic presentation of all constructs used here is given in Supplementary Information, Figure S1). Reconstitution of fluorescence occurs when the two fragments of the split fluorophore are brought together by protein–protein interactions (Hu et al., 2002). We validated the BiFC assay by showing that YC-H-Ras and YN-RBD (Ras-binding domain of Raf-1) only generated detectable fluorescence when YC-H-Ras was GTP-loaded (Supplementary Information, Figure S2). Analysis of the GTP-dependence of H-Ras and Gal-1 interaction demonstrated strong BiFC between YC-H-RasG12V and YN-Gal-1 on the plasma membrane, but only very weak BiFC between YC-H-Ras and YN-Gal-1 (Figure 2C), a result that is consistent with the FLIM-FRET data. Interestingly, YC-H-RasG12V/YN-Gal-1, but not YC-H-Ras/YN-Gal-1, also exhibited strong BiFC in the Golgi complex (Figure 2D), indicating that H-Ras.GTP resident on the Golgi complex also interacts with Gal-1.
EGF Stimulation Induces Interaction between Gal-1 and H-Ras
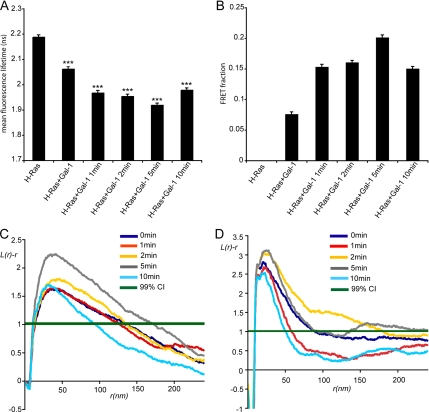
Taken together the data in Figures 1 and 2 demonstrate that Gal-1 interacts specifically with GTP-H-Ras nanoclusters, but not GDP-H-Ras nanoclusters. These experiments were however all carried out with H-Ras that is constitutively GTP loaded by virtue of an oncogenic G12V mutation. We therefore used FLIM-FRET microscopy to detect de novo interactions between mGFP-H-Ras and mRFP-Gal-1 induced by EGF-stimulated Ras GTP-loading. Figure 3A shows that EGF treatment induces a time-dependent decrease in mGFP-H-Ras lifetime as a result of stimulating a corresponding increase in mGFP-H-Ras-mRFP Gal-1 interaction. The maximum decrease in mGFP lifetime was seen 5 min after EGF stimulation (Figure 3A), consistent with the observed kinetics of Ras-GTP loading in BHK cells. We estimate using a global analysis of the FLIM data that the maximal mGFP FRET fraction is ∼20% (Figure 3B), which again is consistent with the maximum level of GTP loading of H-Ras achieved after EGF stimulation (Prior et al., 2001; Elad-Sfadia et al., 2002). The decrease in mGFP fluorescence lifetime observed in unstimulated cells coexpressing mGFP-H-Ras and mRFP-Gal-1 probably reflects the increased basal H-Ras.GTP levels that are associated with exogenous expression of Gal-1 (Elad-Sfadia et al., 2002).
Figure 3.
EGF stimulation induces dynamic interaction between H-Ras.GTP and Gal-1. (A) BHK cells expressing mGFP-H-Ras and mRFP-Gal-1 were serum-starved and stimulated with 50 ng/ml EGF for the indicated time points. The fluorescence lifetime of mGFP-H-Ras in the absence of mRFP-Gal-1 in serum free conditions was used as a control. Fluorescence lifetime was measured in multiple cells, the graph shows mean values ± SEM (n = 22–84), pairwise significant differences from control mGFP-H-Ras were evaluated in t tests (***p ≪ 0.0001). (B) Global analysis and calibration with an mGFP-mRFP fusion protein was used to calculated the fraction of mGFP-H-Ras molecules undergoing FRET. Bars, mean FRET fraction ± SEM calculated for the cells imaged in A. (C) Spatial analysis of Gal-1 nanoclustering in response to EGF stimulation. BHK cells expressing mRFP-Gal-1 and mGFP-H-Ras were serum-starved and stimulated with 50 ng/ml EGF for the indicated time points. Plasma membrane sheets were labeled with anti-mRFP antibody conjugated to 5-nm gold. K-functions are weighted means (n ≥ 9) standardized on the 99% CI. Statistical significance was assessed in bootstrap tests. The analysis shows that Gal-1 nanoclustering is significantly increased after 5 min of EGF stimulation compared with the untreated control (p = 0.001). (D) Spatial analysis of H-Ras nanoclustering in response to EGF stimulation. BHK cells expressing mRFP-Gal-1 and mGFP-H-Ras were serum-starved and stimulated with 50 ng/ml EGF for the indicated time points. Plasma membrane sheets were labeled with anti-GFP antibodies conjugated to 5-nm gold. K-functions are weighted means (n ≥ 7) standardized on the 99% CI. Statistical significance was assessed in bootstrap tests. The analysis revealed that H-Ras nanoclustering was significantly increased after 2–5 min of EGF stimulation (p = 0.001).
We next used EM spatial analysis to explore whether EGF stimulation induces Gal-1 and H-Ras.GTP nanoclustering through increased Gal-1 plasma membrane localization. In serum-starved BHK cells we observed a basal level of mRFP-Gal-1 on intact plasma membrane sheets that was organized into nanoclusters (Figure 3C). After EGF stimulation there was a significant recruitment of mRFP-Gal-1 to the plasma membrane (data not shown) and a concomitant increase in mRFP-Gal-1 nanocluster formation (Figure 3C). The maximum level of mRFP-Gal-1 nanoclustering was detected 5min after EGF stimulation, consistent with the maximum H-Ras–Gal-1 interaction detected by FLIM-FRET (Figure 3A). By 10 min after EGF stimulation the level of mRFP-Gal-1 nanoclustering returned to pretreatment levels (Figure 3C). We went on to analyze the effect of EGF stimulation on mGFP-H-Ras nanoclustering in BHK cells ectopically expressing Gal-1. A similar time-dependent increase in H-Ras nanoclustering was detected, with the maximum increase in nanoclustering occurring 2–5 min after EGF stimulation (Figure 3D). After 10 min of EGF treatment the level of H-Ras nanoclustering returned to pretreatment levels. Taken together these experiments clearly show that EGF-stimulated Ras activation drives the GTP-H-Ras–Gal-1 association and corresponding GTP-H-Ras nanocluster formation in a time-dependent, reversible manner.
Gal-1 Stabilizes GTP-H-Ras Signaling Nanoclusters, Leading to Increased Effector Recruitment
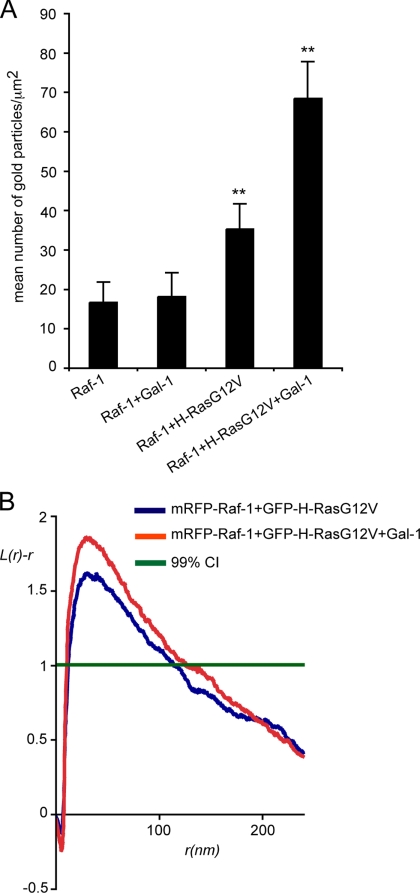
We have shown that Gal-1 is an integral component of the H-Ras.GTP nanocluster and that ectopic expression of Gal-1 increases the extent of GTP-H-Ras nanoclustering; an intriguing mechanism that may account for these observations is a Gal-1–induced increase in the stability or lifetime of the usually short-lived (<1s), transient nanoclusters. If so, because GTP-Ras nanoclusters are the sites of effector recruitment (Tian et al., 2007), exogenous expression of Gal-1 would be expected to increase Raf-1 nanoclustering on the plasma membrane. To formally test whether Gal-1 increases H-Ras signaling by stabilizing the formation of the transient Ras-signaling platform, we analyzed recruitment of mRFP-Raf-1 to the plasma membrane by mGFP-H-RasG12V in the presence or absence of Gal-1. Figure 4A shows that mGFP-H-RasG12V recruited significantly more mRFP-Raf-1 to the plasma membrane when coexpressed with Gal-1 (p = 0.007), and most importantly, the recruited mRFP-Raf-1 exhibited significantly increased nanoclustering (p = 0.001; Figure 4B). We conclude that Gal-1 levels directly regulate the extent of Raf-1 recruitment to H-RasG12V signaling nanoclusters by regulating nanocluster stability and that this is the mechanism underlying enhanced activation of the MAPK pathway observed in cells ectopically expressing Gal-1 (Elad-Sfadia et al., 2002).
Figure 4.
Gal-1 expression increases Raf-1 recruitment to H-RasG12V nanoclusters. Plasma membrane sheets generated from serum-starved BHK cells expressing mRFP-Raf-1, mRFP-Raf-1 and Gal-1, mGFP-H-RasG12V and mRFP-Raf-1, or mGFP-H-RasG12V, mRFP-Raf-1, and Gal-1 were labeled with anti-mRFP antibody conjugated to 5-nm gold to monitor mRFP-Raf-1 plasma membrane interaction. (A) Analysis of Raf-1 membrane recruitment demonstrates that H-RasG12V recruits significantly more mRFP-Raf-1 to the plasma membrane in the presence of Gal-1. Bars, number of gold particles/μm2; error bars, ±SEM (n = 11, 15, 15, and 16, respectively). Statistical significance of differences was assessed in t tests (**p = 0.01). (B) EM spatial mapping of Raf-1 recruited to the plasma membrane by H-RasG12V in the presence or absence of Gal-1. K-function analysis of the gold patterns generated in A shows that Raf-1 nanoclustering is significantly increased when Gal-1 and H-RasG12V are coexpressed compared with H-RasG12V alone (p = 0.001). K-functions are weighted means (n ≥ 15) standardized on the 99% CI. Statistical significance was assessed in bootstrap tests.
The HVR Linker of H-Ras Is Essential for H-Ras- Gal-1 Interactions
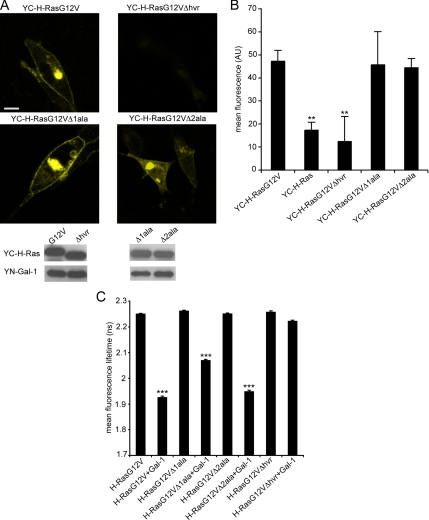
To explore how Gal-1 may drive or facilitate GTP-H-Ras nanocluster formation we mapped the components within H-Ras that are important for interaction with Gal-1. We used BiFC, quantified by FACS analysis (Ozalp et al., 2005), and FLIM-FRET microscopy to detect changes in H-Ras–Gal-1 interaction induced by mutations in H-Ras. We focused on components within H-Ras that are known to regulate lateral segregation. The BiFC and FLIM-FRET measurements correlated well and detected no interaction between Gal-1 and H-RasG12VΔhvr, a mutant that lacks the HVR-linker sequence, (Figure 5, A–C) indicating that the HVR linker is an absolute requirement for H-RasG12V and Gal-1 interaction. To delineate the role of specific sequences within the HVR, we examined the interaction of Gal-1 with H-RasG12VΔ1ala and H-RasG12VΔ2ala, constructs that have region 1 or region 2 of the HVR, respectively, replaced with alanines. BiFC fluorescence was detected at the plasma membrane and Golgi complex when YC-H-RasG12VΔ2ala and YC-H-RasG12VΔ1ala were coexpressed with YN-Gal-1 (Figure 5, A and B). FLIM-FRET measurements confirmed that both of these H-Ras HVR mutants interacted with Gal-1, but revealed that H-RasG12VΔ1ala is partially compromised in its interactions with Gal-1, whereas H-RasG12VΔ2ala interacts to the same extent as full-length H-RasG12V (Figure 5C). Taken together these data correlate closely with the requirements for the respective parts of the HVR for GTP-dependent lateral segregation (Rotblat et al., 2004b). However, the requirement for specific sequences within region 1 for H-RasG12V-Gal-1 interaction may not be as absolute as for the control of lateral segregation.
Figure 5.
The H-Ras HVR regulates interaction with Gal-1. (A) BHK cells were cotransfected with YC-H-RasG12V and YN-Gal-1, YC-H-RasG12VΔhvr and YN-Gal-1, YC-H-RasG12VΔ1ala and YN-Gal-1, or YC-H-RasG12VΔ2ala and YN-Gal-1. Cells were imaged by fluorescence confocal microscopy 48 h after cotransfection. Typical images are shown in the top panel and expression levels in the bottom panel. Images collected from 20 cells in three different experiments exhibited similar patterns of BiFC localization. Bar, 10 μm. (B) The mean fluorescence levels of HEK 293 cells expressing YN-Gal-1/YC-H-RasG12V HVR mutants or YN-Gal-1/YC-H-Ras were quantified by FACS analysis. The mean fluorescence obtained from three different experiments is shown (mean ± SEM). **p < 0.001, YC-H-Ras compared with YC-H-RasG12V, or YC-H-RasG12VΔhvr compared with YC-H-RasG12V. Immunoblot analysis confirmed similar transfection efficiencies. (C) BHK cells were cotransfected with mGFP-H-RasG12V or mGFP-H-RasG12V HVR mutants in the presence or absence of mRFP-Gal-1, and the fluorescence lifetime of mGFP was measured. Bars, mean fluorescence lifetime of mGFP (± SEM, n = 53–132 cells). Pairwise differences from the control mGFP-H-RasG12V were analyzed in t tests (***p ≪ 0.0001).
H-Ras Palmitoyl Moieties Are Dispensable for H-Ras–Gal-1 Complex Formation But Are Required for Membrane Targeting of the Complex
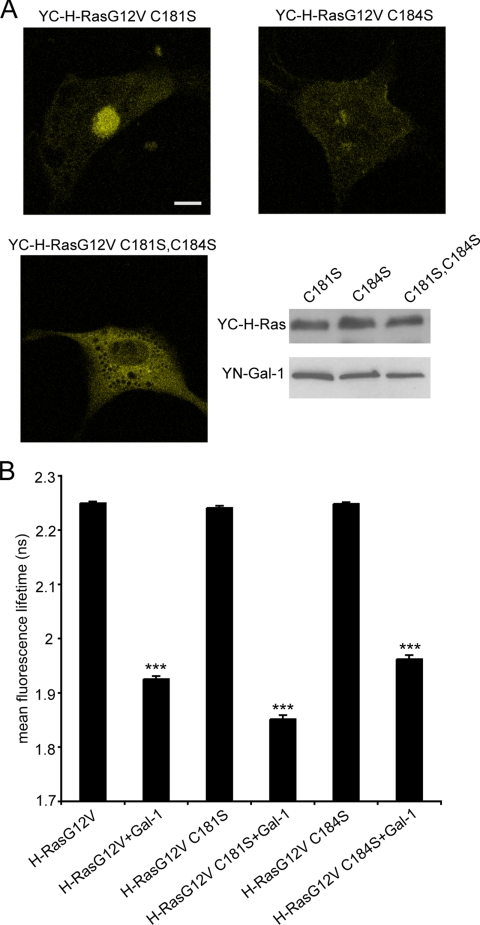
Palmitoylation regulates H-Ras trafficking between the Golgi complex and plasma membrane and H-Ras nanoscale organization on the plasma membrane. Therefore, we explored the role of palmitoylation in H-RasG12V-Gal-1 interactions. BiFC microscopy detected complex formation between Gal-1 and the mono-palmitoylated H-RasG12V C184S and H-RasG12V C181S mutants. Specifically, YC-H-RasG12V C181S and YN-Gal-1 generated strong BiFC in the Golgi complex and weaker BiFC on the plasma membrane (Figure 6A), whereas YC-H-RasG12V C184S and YN-Gal-1 generated BiFC almost exclusively at the plasma membrane (Figure 6A). These BiFC distributions correlate with the known localization of the respective mono-palmitoylated H-Ras proteins and are consistent with the role of the palmitate group on C181 in trafficking H-Ras to the plasma membrane (Roy et al., 2005). FLIM-FRET analysis also showed that the interaction between mRFP-Gal-1 and H-RasG12V mono-palmitoylated on C181 (mGFP-H-RasG12V C184) was equivalent to that of mGFP-H-RasG12V (Figure 6B). Interestingly, however, FLIM-FRET imaging revealed that mono-palmitoylation of H-RasG12V on C184 (mGFP-H-RasG12V C181S) resulted in a significantly increased interaction with mRFP-Gal-1 compared with mGFP-H-RasG12V (Figure 6B). This finding may be related to the specific role of palmitoylation of C184 in regulating H-Ras.GTP-dependent lateral segregation (Roy et al., 2005).
Figure 6.
Palmitoylation is dispensable for Gal-1 H-RasG12V interaction. (A) BHK cells cotransfected with YC-H-RasG12V C181S and YN-Gal-1, YC-H-RasG12V C184S and YN-Gal-1, or YC-H-RasG12V C181S,C184S and YN-Gal-1 were imaged by fluorescent confocal microscopy, 48 h after cotransfection. Typical BiFC images of the cotransfectants are shown in the top panel and expression levels in the bottom panel. Images collected from 20 cells in three different experiments exhibited similar patterns of BiFC localization. Bar, 10 μm. (B) BHK cells were cotransfected with mGFP-H-RasG12V, or mGFP-H-RasG12V palmitoylation mutants in the presence or absence of mRFP-Gal-1, and the fluorescence lifetime of mGFP was measured. Bars, the mean fluorescence lifetime of mGFP (±SEM, n = 44–132 cells). Pairwise statistical significance from the control mGFP-H-RasG12V was analyzed by t tests (***p ≪ 0.0001).
H-Ras and Gal-1 Complexes Traffic from the Plasma Membrane to the Golgi Complex
Given the strong interaction between mono-palmitoylated H-RasG12V and Gal-1, we asked whether palmitoylation of H-Ras was completely redundant for Gal-1 binding. Mutation of C181 and C184 results in an H-Ras protein that has a normally processed CAAX motif but is not palmitoylated and localizes almost exclusively to the cytosol and cytoplasmic surface of the endoplasmic reticulum (ER; Hancock et al., 1990; Choy et al., 1999; Apolloni et al., 2000). We detect strong BiFC between nonpalmitoylated YC-H-RasG12V C181S, C184S and YN-Gal-1 in the cytoplasm (Figure 6A), which was consistent with this distribution. We therefore conclude that palmitoylation of H-RasG12V is dispensable for interaction with Gal-1 and that an H-RasG12V-Gal-1 interaction can proceed in the absence of membrane binding.
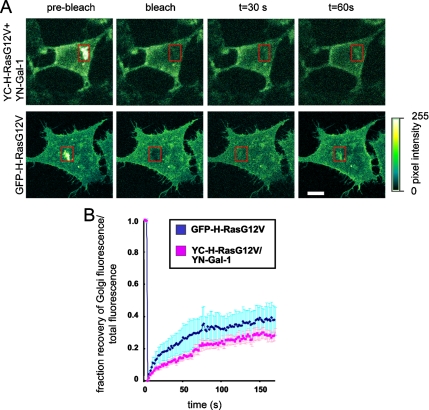
This result suggests that Gal-1 may operate as a molecular chaperone for farnesylated H-Ras after depalmitoylation by thioesterases. Because Ras palmitoyltransferases are localized to the ER and Golgi complex (Lobo et al., 2002; Swarthout et al., 2005), delivery of deplamitoylated H-Ras from the plasma membrane to the ER and Golgi complex is required for repalmitoylation and forward transport back to the plasma membrane (Goodwin et al., 2005; Rocks et al., 2005; Roy et al., 2005). To directly test whether Gal-1 and H-Ras traffic from the plasma membrane to the Golgi complex, we measured the FRAP of YC-H-RasG12V-YN-Gal-1 complexes on the Golgi complex. Cells were pretreated with cycloheximide to block protein synthesis assuring that measurements were made on recycling not newly synthesized proteins. We observed fluorescence recovery of YC-H-RasG12V-YN-Gal-1 within 30 s (Figure 7A). The halftime of fluorescence recovery of YC-H-RasG12V-YN-Gal-1 complexes in the Golgi was 30 ± 12 s (mean ± SEM, n = 4; Figure 7B), which was not significantly different from the mean values recorded for GFP-H-RasG12V (50 ± 10 s, n = 4; p = 0.3). Taken together these results indicate that H-Ras and Gal-1 are mobilized together from the plasma membrane for delivery to the Golgi complex.
Figure 7.
Gal-1 and H-RasG12V complexes translocate from the plasma membrane to the Golgi complex. BHK cells expressing GFP-H-RasG12V or coexpressing YC-H-RasG12V and YN-Gal-1 were imaged live by fluorescence confocal microscopy before and after photobleaching of the Golgi complex (marked by a red rectangle). (A) Typical images of a GFP-H-RasG12V–transfected cell, or YC-H-RasG12V/ YN-Gal-1 cotransfectant before, immediately after, and 30 and 60 s after photobleaching are shown. Color-coded pixel intensities are shown in the right panel. Bar, 10 μm. (B) FRAP of GFP-H-RasG12V or of YC-H-RasG12V-YN-Gal-1 complexes in the Golgi as a function of time. Data represent the mean (±SEM, n = 4) of the normalized Golgi/total cell fluorescence calculated as detailed in Material and Methods. The half times of fluorescence recoveries, calculated by fitting the data to a single exponent, were 50 ± 10 s for GFP-H-RasG12V and 30 ± 12 s for the YC-H-RasG12V-YN-Gal-1 complexes.
Gal-1 Interaction Positively Regulates H-RasG12V Signaling via the Raf/MEK/ERK Pathway
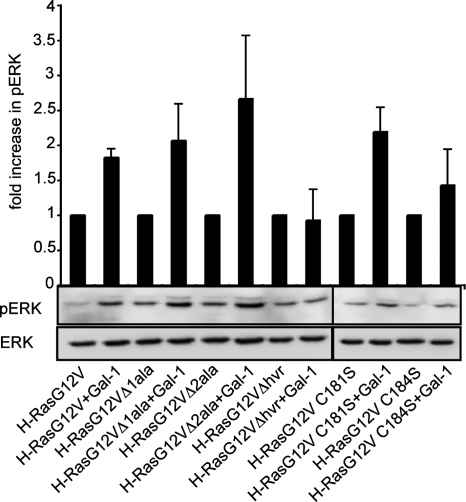
We have shown that Gal-1 stabilizes H-Ras–signaling nanoclusters, resulting in greater Raf-1 recruitment. To address whether stabilization of the nanocluster translates into increased signal output, we analyzed the relative levels of ERK phosphorylation (pERK) in the presence or absence of Gal-1 for each of H-RasG12V mutants assayed in Figures 5 and 6. The results in Figure 8 show a pairwise comparison (expressed as a fold increase) between the level of pERK generated in the presence of Gal-1, compared with in the absence of Gal-1 for each H-RasG12V protein analyzed and demonstrate that the effect of Gal-1 on H-Ras. GTP signaling was directly correlated with the degree of Gal-1 interaction (Figures 5 and 6). Consequently Gal-1 did not increase H-RasG12VΔhvr signal output. However, Gal-1 potentiated signaling via the Raf/MEK/ERK pathway when coexpressed with GFP-H-RasG12VΔ1ala, GFP-H-RasG12VΔ2ala, GFP-H-RasG12V C181S, and GFP-H-RasG12V C184S (Figure 8). In all cases Gal-1 induced a similar fold increase in pERK levels. Together these results show that if Gal-1 is able to interact with H-RasG12V, it stabilizes H-Ras in a conformation that facilitates signal output via increased nanoclustering.
Figure 8.
Gal-1 interaction with H-RasG12V increases pERK activation. Analysis of ability of Gal-1 to potentiate activation of pERK induced by H-RasG12V and the H-RasG12V deletion mutants. BHK cells were cotransfected with equivalent levels of the GFP-H-RasG12V mutant constructs shown in the presence or absence of Gal-1. Twenty micrograms of whole cell lysate was subjected to SDS-PAGE, followed by immunoblotting with antibodies against pERK, ERK, and Ras. Immunoblots visualized by ECL were quantified using Lumi-Imager F1 software (Roche). Bars, the mean fold increase in pERK levels in the presence of Gal-1 relative to the absence of Gal-1 for each pair of cotransfectants from two independent experiments (±SEM). Typical immunoblot of the pERK and ERK levels are shown.
DISCUSSION
A fundamental as yet unanswered question is how does growth-factor signaling regulate Ras nanocluster formation. Here we answer this question through the use of immuno-EM and spatial statistics in combination with FLIM-FRET and BiFC microscopy. We show that two key components of the H-Ras–signaling platform are spatially segregated but are brought together in response to growth factor stimulation. We suggest that the spatial segregation of structural components of Ras nanoclusters provides a control mechanism to regulate the formation and lifetime of Ras–signaling platforms and consequent signal output.
Ras nanoclusters are the sites of effector recruitment and signal transmission (Tian et al., 2007). Therefore the formation and duration of these structures must be tightly regulated in order to ensure appropriate signal output. We show here that interaction between Gal-1 and H-Ras in live cells is regulated by the bound nucleotide. When H-Ras is GDP-loaded, Gal-1 is confined predominantly to the cytosol, but after GTP-loading of H-Ras, Gal-1 is recruited to the plasma membrane where it forms an integral structural component of the H-Ras.GTP-signaling nanocluster. We have shown previously that knock down of Gal-1 expression prevents the formation of the H-Ras.GTP nanoclusters (Prior et al., 2003) and partial mislocalization of H-RasG12V to the cytosol (Paz et al., 2001). Taken together these data show that the recruitment of Gal-1 by H-Ras.GTP, actually into plasma membrane nanoclusters is essential for the formation of H-Ras–signaling platforms.
The physiological relevance of these observations is underscored by the dynamics of Gal-1–H-Ras interaction in response to EGF stimulation. We show using FLIM-FRET that Gal-1 is recruited to the plasma membrane, where it complexes transiently with H-Ras. Importantly, the time course of Gal-1–H-Ras interaction we report is completely concordant with that of H-Ras GTP-loading in response to growth factor stimulation (Prior et al., 2001; Elad-Sfadia et al., 2002). Furthermore the observed maximum FRET fraction between H-Ras.GTP and Gal-1 is ∼20%, which closely matches the maximum H-Ras.GTP loading detected in BHK cells in response to growth factor stimulation (Prior et al., 2001). We can therefore conclude that all of the H-Ras.GTP generated on the plasma membrane is likely bound to Gal-1, that is H-Ras.GTP proteins in nanoclusters, as well as randomly distributed H-Ras.GTP monomers appear to be complexed with Gal-1. This scenario contrasts sharply with Ras.GTP interactions with Raf-1, or the RBD, on the plasma membrane in intact cells, which appear to be restricted to Ras.GTP in nanoclusters (Tian et al., 2007). In combination, these data strongly suggest that the H-Ras.GTP/Gal-1 interaction occurs before the formation of the nanocluster, in which case it is complexes of H-Ras.GTP/Gal-1 that are actually assembled into H-Ras.GTP nanoclusters. Further support for this conclusion is provided by the highly similar clustering parameters of H-Ras.GTP and plasma membrane recruited–Gal-1 revealed by the EM spatial analyses. We also show that ectopic expression of Gal-1 with H-RasG12V leads to increased recruitment of Raf-1 to H-Ras nanoclusters, consistent with the observed increase in Raf/MEK/ERK signaling (Elad-Sfadia et al., 2002). Thus Gal-1 stabilizes or regulates the lifetime of the H-RasG12V signaling platform, which in turn increases the likelihood of Raf-1 recruitment. Taken together these results provide the first demonstration of inducible recruitment of an integral nanocluster scaffolding protein and the resulting dynamic formation of a Ras–signaling platform.
Analysis of the molecular determinants for H-Ras.GTP/Gal-1 interaction in intact cells using FLIM-FRET and BiFC microscopy revealed that the full-length H-Ras HVR is essential for Gal-1 binding because deletion of residues 166–179 completely abrogated the interaction. Finer mapping showed that the role of region 2 (173–179) is essentially that of maintaining appropriate spacing between the G-domain and the farnesyl group of the minimal membrane anchor, whereas specific sequences within region 1 (166–172) are required for Gal-1 interaction. Interestingly, these HVR requirements closely match those previously mapped for H-Ras.GTP-dependent lateral segregation (Jaumot et al., 2002; Prior et al., 2003; Rotblat et al., 2004b; Hancock and Parton, 2005), further linking complex formation between H-Ras.GTP and Gal-1 with the regulated plasma membrane nanoscale distribution of H-Ras. In contrast, neither of the H-Ras palmitate groups is required for Gal-1 binding. Therefore, because Gal-1 can sequester the farnesyl group of H-Ras.GTP (Paz et al., 2001; Rotblat et al., 2004a), we propose that the H-Ras palmitoyl groups alone provide the plasma membrane anchoring for the resulting H-Ras.GTP/Gal-1 complex. Such an arrangement would then allow palmitate on Cys181 to provide membrane affinity and palmitate on Cys184 to operate as a critical determinant of nanocluster assembly (Roy et al., 2005).
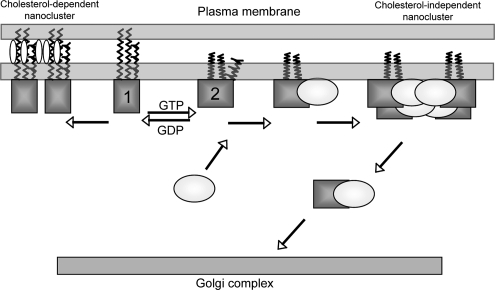
In this context it is worth considering a recent study that used molecular dynamics to simulate the interaction of full-length H-Ras with a model lipid bilayer. H-Ras was observed to visit two conformational states, characterized by different modes of membrane interaction (Figure 9; Gorfe et al., 2007). In addition to the C-terminal lipid anchor H-Ras interacts with the bilayer either via region 1 of the HVR in conformation 1 or the β2-β3 loop of the G-domain in conformation 2, resulting in a larger protein–membrane interfacial surface area. Furthermore the acyl chains are extended and deeply inserted into the lipid bilayer in conformation 1, but acyl chains are less ordered in conformation 2 (Gorfe et al., 2007). The conformational state is regulated by nucleotide exchange, such that H-Ras.GDP and H-Ras.GTP are associated with conformation 1 and 2, respectively. We speculate that the H-Ras.GTP conformational state may be more favorable to Gal-1 interaction because the farnesyl group is less deeply embedded in the bilayer in conformation 2.
Figure 9.
A role for Gal-1 in H-Ras GTP-dependent lateral segregation. Based on MD models of H-Ras on a lipid bilayer (Gorfe et al., 2007) we propose that H-Ras (depicted as squares) on the plasma membrane also exists in two conformational states that are characterized by different modes of membrane interaction. On GDP-loading, H-Ras preferentially assumes a conformational state that is characterized by extended, deeply embedded acyl chains (model 1). This conformation may be stabilized by interaction with cholesterol, leading to the formation of H-Ras.GDP cholesterol-dependent nanoclusters. On GTP-loading H-Ras preferentially adopts a conformational state (model 2) with a larger protein membrane interfacial area and more flexible acyl chains. In this conformation the farnesyl group is also less deeply inserted into the bilayer. On growth factor activation, H-Ras.GTP preferentially assumes this conformation allowing interaction of the farnesyl group with the prenyl-binding pocket of Gal-1 (Gal-1 is depicted as a circle). The interaction of Gal-1 with H-Ras requires the HVR, which provides the appropriate spacing between the G-domain and the farnesyl group. After interaction of the farnesyl group with the prenyl-binding pocket of Gal-1, the palmitate group at C184 is the primary component regulating the lateral segregation of H-Ras into cholesterol-independent domains. Interaction with Gal-1 stabilizes the H-Ras.GTP conformation enabling the H-Ras.GTP-Gal-1 complexes to act as the building blocks for the H-Ras.GTP nanocluster, which is the signaling platform for the recruitment of downstream effectors. After depalmitoylation of H-Ras, Gal-1, by shielding the hydrophobic farnesyl group, acts as a chaperone to promote free diffusion of H-Ras from the plasma membrane through the cytosol to the Golgi complex.
Collecting these ideas together a model for H-Ras–Gal-1 interactions on the plasma membrane can be synthesized (Figure 9). After growth factor receptor activation, H-Ras is GTP-loaded and preferentially visits conformational state 2 described above (Gorfe et al., 2007). Gal-1 is recruited to the membrane in part via an interaction with the farnesyl group of H-Ras.GTP and specific sequences with region 1 of the HVR. Gal-1-H-Ras.GTP complexes are then the basic building block for H-Ras.GTP nanoclusters presumably through a series of molecular collisions, with the result that Gal-1 becomes an integral structural component of an H-Ras.GTP-signaling nanocluster. The presence of Gal-1 contributes stability to the nanocluster, perhaps by stabilizing the actual H-Ras.GTP molecular structure in conformation 2; whatever the precise molecular mechanism, effector recruitment and signal output will be exquisitely dependent on the actual lifetime of the nanocluster. A final aspect of the model is that after Gal-1 binds to the farnesyl group, H-Ras primarily interacts with the plasma membrane via the palmitate groups, enabling the palmitate on C184 to critically regulate lateral segregation (Roy et al., 2005).
The interaction of Gal-1 with cytosolic, unpalmitoylated H-RasG12V is fascinating in light of recent work demonstrating recycling of H-Ras from the plasma membrane to the Golgi complex via a depalmitoylation cycle (Goodwin et al., 2005; Rocks et al., 2005). It has been proposed that the depalmitoylated H-Ras must interact with escort proteins that shield its hydrophobic farnesyl moiety to promote free diffusion in the cytosol (Meder and Simons, 2005). The novel results presented here showing, 1) that Gal-1 and H-Ras interact at the plasma membrane and the Golgi complex, 2) that Gal-1 interacts with depalmitoylated H-Ras, and 3) that H-Ras and Gal-1 traffic to the Golgi complex, in combination with earlier data showing Gal-1 possesses a prenyl-binding pocket that accommodates the farnesyl group of H-Ras (Rotblat et al., 2004a) are entirely consistent with Gal-1 acting as an escort protein. Thus, building on the model described above, after depalmitoylation of H-Ras, Gal-1 would be ideally placed to act as an escort protein to shuttle H-Ras from the plasma membrane to the Golgi complex for repalmitoylation.
In summary, our findings demonstrate how growth factor stimulation can regulate the formation of H-Ras.GTP nanoclusters that comprise the H-Ras–signaling platforms. Given that many other signaling complexes are also spatially segregated into domains on the inner leaflet of the plasma membrane, we speculate that similar mechanisms may exist to regulate the formation and lifetime of these signaling domains.
Supplementary Material
ACKNOWLEDGMENTS
Y.K. is the incumbent of The Jack H. Skirball Chair for Applied Neurobiology. We thank S. R. Smith for editorial assistance. This work was supported in part by grants to Y.K. from the Wolfson Foundation and the United States Israel Binational Science Foundation (2005344) and in part by grants to J.F.H. from the National Institutes of Health (GM-066717) and the National Health and Medical Research Council. The Institute for Molecular Bioscience is a Special Research Centre of the Australian Research Council.
Abbreviations used:
- Gal-1
galectin-1
- EGF
epidermal growth factor
- HVR
hypervariable region
- FLIM-FRET
fluorescence lifetime imaging-fluorescence resonance energy transfer
- BiFC
bimolecular fluorescence complementation
- mRFP
monomeric red fluorescent protein
- mGFP
monomeric green fluorescent protein
- YFP
yellow fluorescent protein
- YN
N-terminal fragment of YFP
- YC
C-terminal fragment of YFP
- RBD
Ras-binding domain of Raf-1.
Footnotes
This article was published online ahead of print in MBC in Press (http://www.molbiolcell.org/cgi/doi/10.1091/mbc.E07-10-1053) on January 30, 2008.
REFERENCES
- Apolloni A., Prior I. A., Lindsay M., Parton R. G., Hancock J. F. H-ras but not K-ras traffics to the plasma membrane through the exocytic pathway. Mol. Cell. Biol. 2000;20:2475–2487. doi: 10.1128/mcb.20.7.2475-2487.2000. [DOI] [PMC free article] [PubMed] [Google Scholar]
- Ashery U., Yizhar O., Rotblat B., Elad-Sfadia G., Barkan B., Haklai R., Kloog Y. Spatiotemporal organization of Ras signaling: rasosomes and the galectin switch. Cell. Mol. Neurobiol. 2006;26:469–493. doi: 10.1007/s10571-006-9059-3. [DOI] [PMC free article] [PubMed] [Google Scholar]
- Bivona T. G., et al. PKC regulates a farnesyl-electrostatic switch on K-Ras that promotes its association with Bcl-XL on mitochondria and induces apoptosis. Mol. Cell. 2006;21:481–493. doi: 10.1016/j.molcel.2006.01.012. [DOI] [PubMed] [Google Scholar]
- Bracha-Drori K., Shichrur K., Katz A., Oliva M., Angelovici R., Yalovsky S., Ohad N. Detection of protein-protein interactions in plants using bimolecular fluorescence complementation. Plant J. 2004;40:419–427. doi: 10.1111/j.1365-313X.2004.02206.x. [DOI] [PubMed] [Google Scholar]
- Chiu V. K., Bivona T., Hach A., Sajous J. B., Silletti J., Wiener H., Johnson R. L., 2nd, Cox A. D., Philips M. R. Ras signalling on the endoplasmic reticulum and the Golgi. Nat. Cell Biol. 2002;4:343–350. doi: 10.1038/ncb783. [DOI] [PubMed] [Google Scholar]
- Choy E., Chiu V. K., Silletti J., Feoktistov M., Morimoto T., Michaelson D., Ivanov I. E., Philips M. R. Endomembrane trafficking of ras: the CAAX motif targets proteins to the ER and Golgi. Cell. 1999;98:69–80. doi: 10.1016/S0092-8674(00)80607-8. [DOI] [PubMed] [Google Scholar]
- Clayton A. H., Hanley Q. S., Verveer P. J. Graphical representation and multicomponent analysis of single-frequency fluorescence lifetime imaging microscopy data. J. Microsc. 2004;213:1–5. doi: 10.1111/j.1365-2818.2004.01265.x. [DOI] [PubMed] [Google Scholar]
- Cox A. D., Der C. J. The dark side of Ras: regulation of apoptosis. Oncogene. 2003;22:8999–9006. doi: 10.1038/sj.onc.1207111. [DOI] [PubMed] [Google Scholar]
- Diggle P. J., Mateu J., Clough H. E. A comparison between parametric and non-parametric approaches to the analysis of replicated spatial point patterns. Adv. Appl. Prob. (SGSA) 2000;32:331–343. [Google Scholar]
- Downward J. Role of receptor tyrosine kinases in G-protein-coupled receptor regulation of Ras: transactivation or parallel pathways? Biochem. J. 2003;376:e9–10. doi: 10.1042/BJ20031745. [DOI] [PMC free article] [PubMed] [Google Scholar]
- Elad-Sfadia G., Haklai R., Ballan E., Gabius H. J., Kloog Y. Galectin-1 augments Ras activation and diverts Ras signals to Raf-1 at the expense of phosphoinositide 3-kinase. J. Biol. Chem. 2002;277:37169–37175. doi: 10.1074/jbc.M205698200. [DOI] [PubMed] [Google Scholar]
- Esposito A., Gerritsen H. C., Wouters F. S. Fluorescence lifetime heterogeneity resolution in the frequency domain by lifetime moments analysis. Biophys. J. 2005;89:4286–4299. doi: 10.1529/biophysj.104.053397. [DOI] [PMC free article] [PubMed] [Google Scholar]
- Fridman M., Maruta H., Gonez J., Walker F., Treutlein H., Zeng J., Burgess A. Point mutants of c-raf-1 RBD with elevated binding to v-Ha-Ras. J. Biol. Chem. 2000;275:30363–30371. doi: 10.1074/jbc.M003193200. [DOI] [PubMed] [Google Scholar]
- Goodwin J. S., Drake K. R., Rogers C., Wright L., Lippincott-Schwartz J., Philips M. R., Kenworthy A. K. Depalmitoylated Ras traffics to and from the Golgi complex via a nonvesicular pathway. J. Cell Biol. 2005;170:261–272. doi: 10.1083/jcb.200502063. [DOI] [PMC free article] [PubMed] [Google Scholar]
- Gorfe A. A., Hanzal-Bayer M., Abankwa D., Hancock J. F., McCammon J. A. Structure and dynamics of the full-length lipid-modified H-Ras protein in a 1,2-dimyristoylglycero-3-phosphocholine bilayer. J. Med. Chem. 2007;50:674–684. doi: 10.1021/jm061053f. [DOI] [PubMed] [Google Scholar]
- Hancock J. F., Parton R. G. Ras plasma membrane signalling platforms. Biochem. J. 2005;389:1–11. doi: 10.1042/BJ20050231. [DOI] [PMC free article] [PubMed] [Google Scholar]
- Hancock J. F., Paterson H., Marshall C. J. A polybasic domain or palmitoylation is required in addition to the CAAX motif to localize p21ras to the plasma membrane. Cell. 1990;63:133–139. doi: 10.1016/0092-8674(90)90294-o. [DOI] [PubMed] [Google Scholar]
- Hu C. D., Chinenov Y., Kerppola T. K. Visualization of interactions among bZIP and Rel family proteins in living cells using bimolecular fluorescence complementation. Mol. Cell. 2002;9:789–798. doi: 10.1016/s1097-2765(02)00496-3. [DOI] [PubMed] [Google Scholar]
- Jaumot M., Yan J., Clyde-Smith J., Sluimer J., Hancock J. F. The linker domain of the Ha-Ras hypervariable region regulates interactions with exchange factors, Raf-1 and phosphoinositide 3-kinase. J. Biol. Chem. 2002;277:272–278. doi: 10.1074/jbc.M108423200. [DOI] [PubMed] [Google Scholar]
- Kenworthy A. K. Nanoclusters digitize Ras signalling. Nat. Cell Biol. 2007;9:875–877. doi: 10.1038/ncb0807-875. [DOI] [PubMed] [Google Scholar]
- Lobo S., Greentree W. K., Linder M. E., Deschenes R. J. Identification of a Ras palmitoyltransferase in Saccharomyces cerevisiae. J. Biol. Chem. 2002;277:41268–41273. doi: 10.1074/jbc.M206573200. [DOI] [PubMed] [Google Scholar]
- Meder D., Simons K. Cell biology. Ras on the roundabout. Science. 2005;307:1731–1733. doi: 10.1126/science.1110551. [DOI] [PubMed] [Google Scholar]
- Niv H., Gutman O., Henis Y. I., Kloog Y. Membrane interactions of a constitutively active GFP-Ki-Ras 4B and their role in signaling. Evidence from lateral mobility studies. J. Biol. Chem. 1999;274:1606–1613. doi: 10.1074/jbc.274.3.1606. [DOI] [PubMed] [Google Scholar]
- Niv H., Gutman O., Kloog Y., Henis Y. I. Activated K-Ras and H-Ras display different interactions with saturable nonraft sites at the surface of live cells. J. Cell Biol. 2002;157:865–872. doi: 10.1083/jcb.200202009. [DOI] [PMC free article] [PubMed] [Google Scholar]
- Ozalp C., Szczesna-Skorupa E., Kemper B. Bimolecular fluorescence complementation analysis of cytochrome p450 2c2, 2e1, and NADPH-cytochrome p450 reductase molecular interactions in living cells. Drug Metab. Dispos. 2005;33:1382–1390. doi: 10.1124/dmd.105.005538. [DOI] [PubMed] [Google Scholar]
- Paz A., Haklai R., Elad-Sfadia G., Ballan E., Kloog Y. Galectin-1 binds oncogenic H-Ras to mediate Ras membrane anchorage and cell transformation. Oncogene. 2001;20:7486–7493. doi: 10.1038/sj.onc.1204950. [DOI] [PubMed] [Google Scholar]
- Plowman S. J., Muncke C., Parton R. G., Hancock J. F. H-ras, K-ras, and inner plasma membrane raft proteins operate in nanoclusters with differential dependence on the actin cytoskeleton. Proc. Natl. Acad. Sci. USA. 2005;102:15500–15505. doi: 10.1073/pnas.0504114102. [DOI] [PMC free article] [PubMed] [Google Scholar]
- Prior I. A., Harding A., Yan J., Sluimer J., Parton R. G., Hancock J. F. GTP-dependent segregation of H-ras from lipid rafts is required for biological activity. Nat. Cell Biol. 2001;3:368–375. doi: 10.1038/35070050. [DOI] [PubMed] [Google Scholar]
- Prior I. A., Muncke C., Parton R. G., Hancock J. F. Direct visualization of Ras proteins in spatially distinct cell surface microdomains. J. Cell Biol. 2003;160:165–170. doi: 10.1083/jcb.200209091. [DOI] [PMC free article] [PubMed] [Google Scholar]
- Rocks O., Peyker A., Kahms M., Verveer P. J., Koerner C., Lumbierres M., Kuhlmann J., Waldmann H., Wittinghofer A., Bastiaens P. I. An acylation cycle regulates localization and activity of palmitoylated Ras isoforms. Science. 2005;307:1746–1752. doi: 10.1126/science.1105654. [DOI] [PubMed] [Google Scholar]
- Rotblat B., Niv H., Andre S., Kaltner H., Gabius H. J., Kloog Y. Galectin-1(L11A) predicted from a computed galectin-1 farnesyl-binding pocket selectively inhibits Ras-GTP. Cancer Res. 2004a;64:3112–3118. doi: 10.1158/0008-5472.can-04-0026. [DOI] [PubMed] [Google Scholar]
- Rotblat B., Prior I. A., Muncke C., Parton R. G., Kloog Y., Henis Y. I., Hancock J. F. Three separable domains regulate GTP-dependent association of H-ras with the plasma membrane. Mol. Cell. Biol. 2004b;24:6799–6810. doi: 10.1128/MCB.24.15.6799-6810.2004. [DOI] [PMC free article] [PubMed] [Google Scholar]
- Roy S., Plowman S., Rotblat B., Prior I. A., Muncke C., Grainger S., Parton R. G., Henis Y. I., Kloog Y., Hancock J. F. Individual palmitoyl residues serve distinct roles in h-ras trafficking, microlocalization, and signaling. Mol. Cell. Biol. 2005;25:6722–6733. doi: 10.1128/MCB.25.15.6722-6733.2005. [DOI] [PMC free article] [PubMed] [Google Scholar]
- Swarthout J. T., Lobo S., Farh L., Croke M. R., Greentree W. K., Deschenes R. J., Linder M. E. DHHC9 and GCP16 constitute a human protein fatty acyltransferase with specificity for H- and N-Ras. J. Biol. Chem. 2005;280:31141–31148. doi: 10.1074/jbc.M504113200. [DOI] [PubMed] [Google Scholar]
- Tian T., Harding A., Inder K., Plowman S., Parton R. G., Hancock J. F. Plasma membrane nanoswitches generate high-fidelity Ras signal transduction. Nat. Cell Biol. 2007;9:905–914. doi: 10.1038/ncb1615. [DOI] [PubMed] [Google Scholar]
- Verveer P. J., Bastiaens P. I. Evaluation of global analysis algorithms for single frequency fluorescence lifetime imaging microscopy data. J. Microsc. 2003;209:1–7. doi: 10.1046/j.1365-2818.2003.01093.x. [DOI] [PubMed] [Google Scholar]
Associated Data
This section collects any data citations, data availability statements, or supplementary materials included in this article.


