

Abstract
The adhesion between epithelial cells at adherens junctions is regulated by signaling pathways that mediate the intracellular trafficking and assembly of its core components. Insight into the molecular mechanisms of this is necessary to understand how adherens junctions contribute to the functional organization of epithelial tissues. Here, we demonstrate that in human hepatic HepG2 cells, oncostatin M-p42/44 mitogen-activated protein kinase signaling stimulates the phosphorylation of p27(Kip1) on Ser-10 and promotes cell–cell adhesion. The overexpression of wild-type p27 or a phospho-mimetic p27S10D mutant in HepG2 cells induces a hyper-adhesive phenotype. In contrast, the overexpression of a nonphosphorylatable p27S10A mutant prevents the mobilization of E-cadherin and β-catenin at the cell surface, reduces basal cell–cell adhesion strength, and prevents the stimulatory effect of oncostatin M on cell–cell adhesion. As part of the underlying molecular mechanism, it is shown that in p27S10A-expressing cells β-catenin interacts with p27 and is prevented from interacting with E-cadherin. The intracellular retention of E-cadherin and β-catenin is also observed in hepatocytes from p27S10A knockin mice that express the p27S10A mutant instead of wild-type p27. Together, these data suggest that the formation of adherens junctions in hepatocytes requires Ser-10 in p27.
INTRODUCTION
The communication between epithelial cells at adherens junctions is important for their functional organization into differentiated tissues (Schock and Perrimon, 2002; Halbleib and Nelson, 2006). The interaction of an epithelial cell with its neighbor cell at adherens junctions couples to the intracellular cytoskeleton and signaling pathways and, in this way, contributes to the regulation of cell shape and migration, proliferation, and differentiation. Vice versa, (patho-) physiological changes in the activity of specific signaling pathways influence adherens junction-mediated cell–cell communication. Insight into the molecular working of this and the nature of the signals involved is necessary to understand how adherens junctions contribute to the organization and functioning of epithelial tissues and disease states such as cancer.
The chief components of adherens junctions in epithelial cells are E-cadherin and β-catenin (Gumbiner, 2005). E-cadherin is a transmembrane receptor that homotypically interacts with an other E-cadherin at the surface of adjacent cells in a calcium-dependent manner. Cytoplasmic E-cadherin–binding proteins including β-catenin and others transduce adhesion-elicited signals to the cell interior and provide a physical link to the actin cytoskeleton. The intracellular trafficking and mobilization of adherens junction components at the cell surface is important for growth and development and, possibly, cancer, and is subject to extensive research (Bryant and Stow, 2004). The exit of newly synthesized E-cadherin from the endoplasmic reticulum and its delivery to the lateral cell surface is facilitated by its interaction with β-catenin (Chen et al., 1999; Miranda et al., 2001). Once delivered, E-cadherin is subject to recycling via the endosomal system (Le et al., 1999), a process that is tightly regulated by various signaling molecules (reviewed in Bryant and Stow, 2004).
In hepatocytes, the prime epithelial cells of the liver, the mobilization of E-cadherin and catenins to the cell surface is regulated by the paracrine action of the interleukin 6-family cytokine oncostatin M (OSM; Matsui et al., 2002). This effect of OSM on adherens junction formation is believed to be part of the complex mechanism by which OSM signaling controls liver development (Kamiya et al., 1999; Kinoshita and Miyajima, 2002), which also includes the establishment of apical-basolateral polarity (van der Wouden et al., 2002; Wojtal et al., 2007; van IJzendoorn et al., 2004). OSM, via the signal transducer protein gp130, typically stimulates two major signaling pathways that involve Ras/mitogen-activated protein kinase (MAPK) and signal transducer and activator of transcription (STAT; Heinrich et al., 1998). The OSM-stimulated mobilization of adherens junction proteins requires activation of the Ras/MAPK leg (Matsui et al., 1999). Activation of MAPK by OSM also influences the expression of p27(Kip1); see Klausen et al. (2000). p27(Kip1) controls cell cycle progression (Polyak et al., 1994) and, interestingly, displays additional non-cell cycle–related functions including differentiation (Deschênes et al., 2001), apoptosis (Drexler, 2003), and migration (McAllister et al., 2003; Besson et al., 2004; Denicourt et al., 2007). The main phosphorylation site in p27(Kip1), Ser10, has been proposed to be an important determinant for non-cell cycle–related cytoplasmic functions of p27(Kip1) (see McAllister et al., 2003; Besson et al., 2006). In this study, we have investigated the involvement of p27(Kip1) and its Ser10 phosphorylation site in (OSM-stimulated) cell–cell adhesion.
MATERIALS AND METHODS
Cell Culture and Transfections
HepG2 cells were grown in DMEM medium with 4500 mg/l glucose and supplemented with 10% fetal calf serum (FCS) and antibiotics (cf. van IJzendoorn et al., 1997). The pcDNA3-p27WT, pcDNA3-p27S10A, and pcDNA3-p27S10D constructs (encoding human p27) were kindly provided by S. Meloche (University of Montreal, Montreal, QC, Canada). After transfection of these constructs using Lipofectamine 2000 (Invitrogen), according to the manufacturer's protocol, HepG2 cells were maintained in culture medium containing the selection marker G418 (800 μg/ml). At least three clones of each mutant cell line were isolated and characterized for p27 overexpression. Transient transfection with plasmids encoding TOP10glow or FOP10glow (gifts from R. Medema, University Medical Center Utrecht, Utrecht, The Netherlands) or with validated siRNA against human p27Kip1 (target sequence AAAGCGTTGGATGTAGSATTA; Qiagen, Chatsworth, CA) was done using Lipofectamine 2000 according to the manufacturer's protocols.
Analysis of p27 by Western Blot
HepG2 cells, p27WT, p27S10D, and p27S10A-expressing cells, treated with oncostatin M (10 ng/ml) or buffer (control) for 4 h, were lyzed in lysis buffer (10 mM triethanolamine, pH 7.4, 1.0% Triton X-100, 0.1% SDS, 100 mM NaCl, 1 mM EDTA, 1 mM EGTA, 1 mM NaF, 20 mM Na4P2O7, and 2 mM sodium vanadate, and a cocktail of protease inhibitors). Lysates were boiled for 5 min and cleared by centrifugation. Protein concentrations were determined by a bicinchoninic acid protein assay (Sigma-Aldrich, St. Louis, MO), and equal amounts of proteins were separated on 10% SDS-PAGE gels, immunoblotted with mouse monoclonal p27Kip1 antibodies (BD Transduction Laboratories, Lexington, KY) or rabbit polyclonal phospho(Ser10)-p27Kip1 antibodies (Zymed), and detected with an enhanced chemiluminescence system (Amersham Pharmacia Biosciences, Piscataway, NJ). Bands representing p27Kip1 or phospho(Ser10)-p27Kip1 were quantified using Scion Image software (Frederick, MD).
Cell Growth Evaluation
HepG2, p27S10D, and p27S10A cells were seeded at 0.5 × 10⁶ cells per coverslip and counted every 24 h using a Bürker chamber. The average of three different countings is depicted.
Flow Cytometry
After a quick wash in phosphate-buffered saline (PBS) and a second wash in PBS/0.1% EDTA, cells at 70% confluence were incubated in PBS/0.1% EDTA at 37°C for 5 min. The cells were thoroughly resuspended in order to obtain a single cell solution and then centrifuged at 1000 rpm for 5 min. After a wash in PBS/1% FCS, the pellet was resuspended in 100 μl of PBS. One milliliter of −20°C absolute ethanol was subsequently added, using a vortex to avoid clumping, and the cells were left in ethanol 15 min at 4°C and centrifuged at 1600 rpm for 5 min. After one additional wash in PBS/FCS, the cells were suspended in a propidium iodide solution (propidium iodide 10 μg/ml in sodium citrate 38 mM, pH 7.4, RNase A 250 μg/ml in PBS/1% FCS) and incubated at 37°C for 30 min. The cells were then stored at 4°C and protected from light until analysis with a FACS Calibur flow cytometry apparatus, using CellQuest software for the data acquisition and Modfit for the data analysis.
Immunoprecipitations of p27, β-Catenin, and E-Cadherin
Immunoprecipitations were carried out with 700 μg protein according to the manufacturer's protocol (Immunoprecipitation Starter Pack, Amersham Pharmacia Biosciences), using protein A and rabbit polyclonal anti-p27(Kip1) antibodies (Chemicon, Temecula, CA), mouse monoclonal anti-β-catenin antibodies (BD Transduction Laboratories), and rabbit polyclonal anti-E-cadherin antibodies (kindly provided by M. Wheelock, University of Nebraska Medical Center, Omaha, NE). The samples were processed for SDS-PAGE, Western blotting, and enhanced chemoluminescence (ECL; Amersham Pharmacia Biosciences) protein detection as described for the analysis of p27 levels. In addition, mouse monoclonal anti-p27(Kip1; BD Transduction Laboratories) and mouse monoclonal anti-cdk2 (Santa Cruz) antibodies were used for the detection in Western blot.
Cell-Cell Adhesion Strength Assay
HepG2-, p27WT-, p27S10D-, and p27S10A-expressing cells, treated with oncostatin M (10 ng/ml) or buffer (control) for 4 h, were washed with ice-cold 25 mM HEPES in HBSS. The cells were then detached with 2.5 mM EDTA in PBS (5 min, 37°C) and carefully passed three times through a 25-gauge needle to prepare a single-cell solution. After counting, 5 × 10⁵ single cells were allowed to aggregate in 25 mM HEPES-buffered HBSS/normal culture medium (1:1) in a 24-well plate, in the presence of absence of 1.5 mM EDTA, for the indicated time intervals on a shaker (80 rpm; 37°C). The degree of aggregation was determined by phase-contrast microscopy by counting in five different fields the proportion of single cells and cell aggregates of 2 (doublet), 3 (triplet), or >4 (larger) cells. The results of these countings are depicted as the percentage of the total number of cells counted.
Electron Microscopy
Cells were washed with 6.8% saccharose to remove serum in 0.1 M cacodylate buffer, pH 7.4, at room temperature and fixed in 2% glutaraldehyde in 0.1 M cacodylate buffer, pH 7.4, at room temperature for 30 min. The cells were rinsed three times in the same buffer with 6.8% sucrose and subsequently postfixed in 2% OsO4/3% K4Fe(CN)6 in 0.2 M cacodylate buffer (pH 7.4) at 4°C for 1 h. After rinsing in 0.1 M cacodylate buffer, pH 7.4, and dehydration in a graded alcohol series, the cells were embedded in Epon 812 and polymerized for at 58°C for 64 h. Finally, ultrathin sections (60 nm) were cut and stained with uranyl acetate and lead citrate. The sections were examined using a Philips CM 100 electron microscope (Mahwah, NJ) operating at 80 kV, and micrographs were taken.
Fluorescence Microscopy
Cells cultured on glass coverslips were fixed with −20°C acetone for 5 min or with 4% paraformaldehyde in PBS at 4°C for 20 min, followed by permeabilization with 0.25% Triton X-100 in HBSS at room temperature for 5 min. Blocking incubations were performed in HBSS containing 1% FCS at room temperature for 1 h. After extensive washes with HBSS, cells were incubated with the first antibody at room temperature for 1 h or overnight at 4°C. After washing with HBSS, cells were then incubated with the corresponding secondary antibody and Hoechst-33528 (5 ng/ml, Sigma-Aldrich) to stain the nuclei, at room temperature for 1 h. After another round of extensive washes in HBSS, the coverslips were mounted in a drop of mounting medium (DAKO, Carpinteria, CA). The antibodies used were as follows: mouse monoclonal anti-p27(Kip1); and mouse monoclonal anti-β-catenin antibody (both from BD Transduction Laboratories), rabbit polyclonal anti-E-cadherin (gift of M. Wheelock, University of Nebraska Medical Center, Omaha, NE), and Alexa Fluor-488 or -596 goat anti-rabbit or -mouse (Molecular Probes, Eugene, OR). For F-actin staining, cells were fixed with −20°C absolute ethanol for 10 s, washed, and incubated with TRITC-labeled phalloidin (100 ng/ml, Sigma) and Hoechst 33528 (5 ng/ml, Sigma-Aldrich) at room temperature for 20 min. After extensive washing in HBSS, the coverslips were mounted in mounting medium (DAKO). Cells were examined with an Olympus Provis AX70 fluorescence microscope (Melville, NY).
TCF4-binding domain/FOP Assay
HepG2, HepG2-p27WT, HepG2-p27S10A, or HepG2-p27S10D cells were grown on glass coverslips for 24 h and transfected as described above with plasmids containing the luciferase gene under the control of a promoter containing the TCF4-binding domain (TOP) or a mutated domain that does not bind TCF4 (FOP). Forty-eight hours after transfection, luciferase activity was assayed using the Luciferase Assay System from Promega (Madison, WI). Briefly, cells were lyzed on ice in cell culture lysis reagent and centrifuged, and 20 μl of sample was added to 100 μl of luciferase substrate. The luciferase activity was read on a Turner Designs 20/20 luminometer (Sunnyvale, CA).
Immunohistochemistry
Four-micrometer-thick sections of paraffin-embedded liver tissue from wild-type and p27S10A/S10A mice were deparaffinized in xylenes, gradually hydrated through alcohols, and immunolabeled with mouse monoclonal antibodies against E-cadherin or β-catenin (BD Transduction Laboratories; diluted 1:100). Antibody detection was performed using the ImmunoCruz staining system (Santa Cruz Biotechnology, Santa Cruz, CA) according to manufacturer's instructions, using a Tris buffer for heat-mediated antigen retrieval. Samples were counterstained with hematoxylin.
RESULTS
Phosphorylation of p27 on Ser-10 Is Positively Correlated to Hepatic Cell–Cell Adhesion in a Manner That Is Independent on Cell Proliferation
In hepatocytes, the interleukin 6-family cytokine oncostatin M promotes p27 stability, inhibits cell proliferation, and stimulates cell–cell adhesion by promoting the mobilization of two main components of adherens junctions, E-cadherin and β-catenin, to the lateral cell surface (Klausen et al., 2000; Matsui et al., 2002; van IJzendoorn et al., 2004). To better correlate the different cellular effects, we exposed human hepatic HepG2 cells for a relatively short-term (4 h) to oncostatin M (10 ng/ml). Treatment of the cells with oncostatin M for this time interval does not affect cell proliferation, as evidenced by 1) a steady low percentage (2.2 and 2.3% in control and oncostatin M–treated cells, respectively) of cells that incorporated the thymidine analogue bromodeoxyuridine during this time period, 2) a steady low percentage of cells that display mitotic figures (4.1 and 4.0% in control and oncostatin M–treated cells, respectively), and 3) no increase in the total cell number (not shown). In agreement, the 4-h treatment of HepG2 cells with oncostatin M does not change the expression level of the cell cycle regulatory protein p27(Kip1) (Figure 1A). By contrast, the 4-h treatment with oncostatin M stimulates cell–cell adhesion strength in an aggregation assay that allows for the evaluation of cell–cell adhesion strength upon random collisions, while excluding the effect of cell–substratum adherence (see Materials and Methods). Thus, whereas ∼32% of the nontreated cells remained single, and ∼28, 13, and 27% of the cells was found in aggregates of 2, 3, or >4 cells after a 4-h period of shaking, respectively, ∼15% of the oncostatin M–treated cells appeared as single cells, and ∼18, 28, and 32% of the oncostatin M–treated cells was found in aggregates of 2, 3, or >4 cells, respectively (Figure 1C).
Figure 1.

p27Ser10 phosphorylation is positively correlated with cell–cell adhesion strength. (A and B) One-day-old HepG2 cells treated at 37°C for 4 h with buffer (control), oncostatin M (10 ng/ml), or oncostatin M + PD98059 (50 μM), lyzed, and subjected to PAGE and Western blotting to reveal the expression of total p27 and p27 phosphorylated on Ser-10. The blots of three independent experiments were scanned. Bands representing p27 and phospho-p27Ser10 were quantified using Scion Image software, and the mean ratio phospho-p27/total p27 was expressed relative to the control (set to 100). (C) From HepG2 cells, treated at 37°C for 4 h with buffer (control), oncostatin M (10 ng/ml), or oncostatin M + PD98059 (50 μM), single-cell suspensions were made as described in Materials and Methods. Cells were shaken for 4 h, allowing the evaluation of the cell–cell contact strength upon random collisions. The number of single cells (white bars) and cells in aggregates of 2 (gray bars), 3 (hatched bars), or larger clusters (dotted bars) is presented as a percentage of the total number of cells and expressed as mean ± SD of three independent experiments.
Because p27 has been demonstrated to display also non-cell cycle–related functions in the cytoplasm that depend on its phosphorylation at Ser10 (McAllister et al., 2003; Besson et al., 2006), we next examined the phosphorylation of p27 on Ser10 in response to oncostatin M. As shown in Figure 1, A and B, the 4-h treatment of HepG2 cells with oncostatin M results in a ∼1.5-fold increase in the phosphorylation status of p27 at Ser-10. Pretreatment of the cells with PD98059 (50 μM), which effectively inhibits the activation of p42/44 MAPK by MAPK kinase in response to oncostatin M (Wojtal et al., 2007), prevents the oncostatin M–stimulated increase in p27-Ser10 phosphorylation (Figure 1A). In addition, PD98059 prevents the stimulatory effect of oncostatin M on cell–cell adhesion (Figure 1C). Oncostatin M-MAPK signaling in HepG2 cells thus reveals a positive correlation between the phosphorylation of p27 on Ser-10 and cell–cell adhesion strength, independent of cell proliferation.
Overexpression of Ser-10 Mutants of p27 Influences Cell–Cell Adhesion in the Absence of Significant Effects on Cell Proliferation
To investigate a possible causal relationship between p27 phosphorylation on Ser-10 and cell–cell adhesion, HepG2 cells were stably transfected with constructs encoding wild-type p27 or p27 Ser-10 point mutants: Ser-10-Ala, which prevents p27 from being phosphorylated at position 10, and Ser-10-Asp, which is phospho-mimetic (hereafter referred to as p27WT, p27S10A, and p27S10D, respectively). The cells overexpressing p27WT, p27S10A, or p27S10D displayed by Western blot analysis an approximate twofold steady-state overexpression of total p27 when compared with the parental cells (Supplementary Figure 1), thus avoiding physiological irrelevant levels of p27. Cells expressing p27S10A or p27S10D did not present large differences in their proliferation patterns as evidenced by cell counting, although there was some delay in proliferation during the first 24 h after plating (Figure 2A). Flow cytometry revealed that overexpression of p27S10A or p27S10D did not affect the percentage of (3 d old) cells in the G1-phase of the cell cycle (∼50%), whereas, for unknown reason, cells expressing p27S10A, but not p27S10D, tended to accumulate in S-phase resulting in fewer cells in G2/M-phase (Figure 2B). The overexpression of the different mutants of p27 did not affect the ability of the protein to interact with cdk2 (Figure 2C), consistent with previous reports (Ishida et al., 2000). Furthermore, by immunofluorescence and subcellular fractionation, we did not observe a significant change in the balance between the nuclear and nonnuclear pool of p27 (not shown), consistent with the observation in p27S10A knockin mice that Ser-10 phosphorylation per se is not required for the nuclear–cytoplasmic shuttling of p27 (Kotake et al., 2005) and that nuclear export of Ser-10 phosphorylated p27 requires mitogenic signals (Rodier et al., 2001).
Figure 2.

Cell cycle is minimally or not affected by the introduction of the Ser10 mutants of p27. (A) Parental HepG2 cells and cells expressing p27S10A or p27S10D (500,000 cells/well) were plated and counted in a Bürker chamber after 24, 48, 72, and 96 h in culture. Cell numbers (in millions) are expressed as mean ± SD of three independent experiments. Note that the expression of p27 Ser-10 mutants does not dramatically influence cell proliferation, evidenced by the number of cells in the culture as a function of time. (B) Parental HepG2 cells and cells expressing p27S10D or p27S10A were subjected to flow cytometry analysis as described in Materials and Methods in order to examine their cell cycle distribution. Note that, besides an accumulation of the p27S10A cells in the S-phase, p27S10A and p27S10D-expressing cells do not present large differences in their cell cycle distribution when compared with the parental cells. (C) p27 was immunoprecipitated from parental HepG2 cells and cells expressing p27S10D or p27S10A as described in Materials and Methods. Immunoprecipitates were subjected to PAGE and Western blot analyses in order to detect whether cdk2 was coprecipitated. Coprecipitation of p27 and cdk2 was observed in all cell lines.
In contrast to the absence of pronounced effects on cell proliferation, we did observe a striking difference in the morphology of p27S10A-overexpressing cells. Although hepatocytes and HepG2 cells are well known for their intercellular hyperadhesive phenotype and in culture typically grow in cell clusters, (3 d old) cells expressing p27S10A displayed a pronounced flat and spread-out morphology and typically grew as a monolayer of only one cell thick (Figure 3D; compare with parental cells in Figure 3A). In striking contrast, the p27WT- and p27S10D-overexpressing cell lines displayed a pronounced cell–cell clustering phenotype characterized by their growth in cell aggregates (Figure 3, B and C). The flat and spread-out morphology of cells expressing p27S10A may be the result of a decreased cell–cell adhesion capacity or increased cell–substratum adherence. When determining the proportion of cells adhering to the substratum per hour within an 8-h time frame (Figure 3E), we noticed a reduction in cell–substratum adhesion for all p27-overexpressing cell lines when compared with the parental cells. This reduction is more pronounced in the p27WT- and p27S10D-overexpressing cell lines, which cluster before adhering to the dish. Because p27S10A-expressing cells do not display an enhanced adherence to the substratum when compared with parental cells and never cluster, it is suggested that the opposing phenotype between p27S10A and p27S10D is primarily due to changes in cell–cell adhesive capacity which, subsequently, may affect cell–substratum interactions. Supporting evidence for this is provided by the cell aggregation assay (see Materials and Methods). After 4 h of shaking, p27S10A-expressing cells displayed a level of single cells close to the parental cells (40.1 ± 9.9 vs. 35.6 ± 0.8%), and <10% of parental or p27S10A-expressing cells were found in aggregates of >4 cells. In contrast, p27WT and, to a larger extent, p27S10D-expressing cells were predominantly implicated in aggregates of two (couplet; 21.0 ± 0,7%), three (triplet; 19.6 ± 0,4%), or more cells (larger; 38.0 ± 2.4%; Figure 3F). Extending the shaking period to 16 h yielded identical effects (not shown), excluding delays in cell–cell adhesion establishment in this assay. Because cell–cell adhesion complexes are in part mediated by adhesion molecules that require extracellular calcium, we tested the effect of the calcium chelator EDTA. For all cell lines, we observed a decrease in the number of cells implicated in large clusters, but proportional to the aggregation capacity of the cells (Figure 3F). Note that it is typical for HepG2 cells when cultured in suspension with agitation to display some degree of cell–cell interaction even in the complete absence of calcium, in contrast to when cultured on a solid substratum. Taken together, the data suggest that overexpression of p27WT and p27S10D promote cell–cell adhesion strength, whereas expression of p27S10A reduces cell–cell adhesion and that these effects are not the result of altered cell proliferation.
Figure 3.

p27 Ser-10 phosphorylation influences cell–cell adhesion strength. (A–D) Parental HepG2 cells (A) and cells expressing p27S10D (B), p27WT (C), and p27S10A (D) were cultured for 3 d, examined with phase-contrast light microscopy and photographed. Bars, 10 μm. (E) Parental HepG2 cells (control) and cells expressing p27WT, p27S10D, or p27S10A (500,000 cells/well) were plated, and the number of cells that attached to the substratum was counted after 3, 4, 5, 6, 7, and 8 h after plating. Data are presented as a percentage of the control of each time point (set to 100) and expressed as mean ± SD of three independent experiments carried out in duplicate. (F) Parental HepG2 and cells expressing p27WT, p27S10D, or p27S10A were subjected to a cell aggregation test as described in Materials and Methods. Single-cell suspensions of each cell line were shaken for 4 h in the presence or absence of the Ca2+ chelator EDTA (1.5 mM), allowing the evaluation of the cell–cell contact strength upon random collisions. The number of single cells (white bars) and cells in aggregates of 2 (gray bars), 3 (hatched bars), or larger clusters (dotted bars) is presented as a percentage of the total number of cells and expressed as mean ± SD of three independent experiments.
Expression of p27S10A Inhibits the Mobilization of E-Cadherin and β-Catenin at the Cell Surface
Although the expression of p27S10A reduced cell–cell adhesion strength and promoted growth of the cells as a monolayer rather than as clusters, cell–cell contact was perceptible with light microscopy (cf. Figure 2D). Therefore, the effect of p27 Ser-10 modification on cell–cell adhesion was further analyzed at the ultrastructural level by means of transmission electron microscopy. Consistent with the data from the aggregation assay, p27S10A-expressing cells (Figure 4D) display a markedly reduced adhesive morphology when compared with parental cells (Figure 4A), and intercellular space is clearly visible between the opposing plasma membranes of neighboring cells (white space, Figure 4D), sparsely filled with villi (white arrow heads). However, in agreement with the light microscopy observations, these cells are not completely devoid of cell–cell contact and some desmosomal structures can be observed (Figure 4E, white arrow). In striking contrast to the p27S10A-expressing cells, p27WT- (Figure 4B) and p27S10D-expressing cells (Figure 4C) interact very tightly. Intercellular space between opposing plasma membranes of neighboring cells is hardly visible, and repeating electron-dense adhesion junctions including desmosomes (white arrow) and adherens junctions (white double arrows) are readily noticed along the lateral cell surface in p27S10D-expressing cells. Moreover, the lateral plasma membranes in p27S10D-expressing cells are lined with abundant cytoskeleton filaments (Figure 4C, black arrows), which clearly is not the case in p27S10A-expressing cells (Figure 4D). Staining of actin filaments with fluorescently labeled phalloidin in p27S10A-overexpressing cells revealed erratic cell–cell adhesions and areas devoid of cell–cell contact (Figure 5D), consistent with electron microscopical data (Figure 4D), and a pronounced redistribution of actin to the perinuclear location [Figure 5D; compare to parental cells (5A), p27WT (5B), and p27S10D-expressing cells (5C)].
Figure 4.

Electron microscopical view of the lateral cell surface of parental and p27 Ser-10 mutant cells. Parental HepG2 cells (A) and cells expressing p27WT (B), p27S10D (C), or p27S10A (D and E) were fixed and prepared for electron microscopy as described in Materials and Methods. The appearance of electron-dense desmosomes and adherens junctions is indicated by single and double white arrows, respectively. Note the clear intercellular space in p27S10A-overexpressing cells (D) with distinguishable microvilli (white arrowheads). Note the presence of repeating adhesion junctions and the appearance of very dense cytoskeletal filaments (black arrows) along the lateral surface in cells expressing p27S10D (C) and p27WT (B), which are typically absent in p27S10A-expressing cells (D). (E) Desmosomal structures are sometimes observed in p27S10A-expressing cells. Bar, 200 nm.
Figure 5.

F-Actin distribution in parental and p27 Ser-10 mutant cells. Parental HepG2 cells (A) and cells expressing p27WT (B), p27S10D (C), or p27S10A (D) were fixed and labeled with TRITC-phalloidin to reveal the subcellular distribution of F-actin. Although in parental HepG2 cells and cells expressing p27WT or p27S10D actin is distributed along the lateral surface, in p27S10A-expressing cells actin is redistributed to the cell interior and displays an erratic lateral localization. Bar, 5 μm.
The apparent loss of cell–cell adhesion junctions and a coinciding redistribution of the actin cytoskeleton prompted further investigation of the subcellular distribution of two main components of adherens junctions, E-cadherin and β-catenin (Kemler and Ozawa, 1989; Wheelock, 1990). In parental cells and p27WT- and p27S10D-expressing cells, E-cadherin is localized mainly at the lateral plasma membrane (Figure 6, A, C, and E). In striking contrast, in cells expressing p27S10A, virtually all E-cadherin is mislocalized to the cell interior where it appears enriched in perinuclear structures that may represent the endoplasmic reticulum (Figure 6G). Mislocalization was also observed for β-catenin, which in p27S10A-expressing cells was not found at the lateral plasma membrane but throughout the cytoplasm and in the nucleus (Figure 6H). This is in striking contrast to the localization of β-catenin at the cell surface of parental cells and cells expressing p27WT or p27S10D (Figure 6, B, D, and F). The nuclear appearance of β-catenin did not augment Wnt signaling activity. On the contrary, β-catenin-TCF4–mediated transcription activity, determined with TOP/FOP constructs, was reduced in cells expressing p27S10A (Supplementary Figure 2). We could not detect a clear correlation between the localization of p27 and β-catenin or E-cadherin.
Figure 6.

Localization of adherens junction proteins in parental and p27 Ser-10 mutant cells. Parental HepG2- (A and B), p27WT- (C and D), and p27S10D- (E and F) expressing cells were fixed and immunolabeled with antibodies against E-cadherin (A, C, E, and G) and β-catenin (B, D, F, and H). Note the intracellular localization of E-cadherin and β-catenin in p27S10A-expressing cells (G and H), in striking contrast to the localization of these proteins at the cell surface in the other cells. Bar, 10 μm.
In contrast to E-cadherin and β-catenin, the localization of the ABC transporter MRP1/ABCC1 (Figure 7, A and B) and the tight junction–associated proteins ZO-1 (Figure 7, C and D) and PAR-3 (not shown) was not affected in p27S10A-expressing cells, because both proteins maintained their typical lateral localization as observed in parental cells, emphasizing that p27S10A-expressing cells display a specific mislocalization of adherens junction proteins while maintaining other means of cell–cell adhesion and preserving lateral plasma membrane identity.
Figure 7.
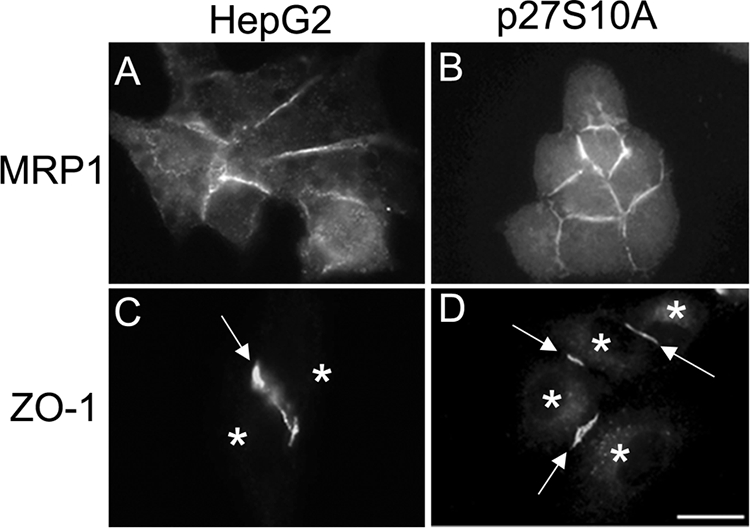
p27 Ser-10 phosphorylation status does not affect the localization of all lateral proteins. Parental HepG2 (A and C) and p27S10A-expressing cells (B and D) were fixed and immunolabeled with antibodies against MRP1 (A and B) and ZO-1 (C and D). Note that the lateral localization of MRP1 is unaffected in cells expressing p27S10A. Similarly, the tight junction protein ZO-1 is properly localized in p27S10A-overexpressing cells, although some ZO-1 in p27S10A-expressing cells also appears in cytoplasmic structures. Asterisks in C and D indicate nuclei. Bar, 10 μm.
Expression of p27S10A Promotes Interaction between p27 and β-Catenin and Precludes Interaction between β-Catenin and E-Cadherin
To obtain further insight into the molecular mechanism by which p27-Ser10 affects the localization of adherens junction proteins, we performed coimmunoprecipitation experiments using antibodies against p27, β-catenin, and E-cadherin. We observed a clear interaction between p27 and β-catenin, but not between p27 and E-cadherin, in p27S10A-expressing cells (Figure 8A). Reciprocally, β-catenin, but not E-cadherin, interacts with p27 in p27S10A-expressing cells and, to a much lesser extent if at all, in cell overexpressing p27WT, p27S10D, or parental cells (Figure 8B). Furthermore, a striking loss in the interaction between β-catenin and E-cadherin was observed in p27S10A-expressing cells (Figure 8C), consistent with their disparate subcellular localization in these cells (Figure 6). These data may suggest that interaction of β-catenin with p27 in p27S10A-expressing cells prevents the interaction of β-catenin with E-cadherin and, hence, the establishment of productive cell–cell contacts.
Figure 8.

Interactions between adherens junction proteins in parental and p27 Ser-10 mutant cells. Parental HepG2 cells and cells expressing p27WT, p27S10D, or p27S10A were cultured for 3 d and subjected to coimmunoprecipitation experiments as described in Materials and Methods. (A) Coimmunoprecipitations with anti-p27 antibodies and (B) anti-β-catenin antibodies show the reciprocal and specific interaction between β-catenin and p27 in p27S10A-expressing cells. (C) Coimmunoprecipitation of E-cadherin demonstrates the absence of E-cadherin–β-catenin interactions in p27S10A-expressing cells.
Oncostatin M Fails to Stimulate Cell–Cell Adhesion in p27S10A-expressing Cells
Because of the observed positive correlation between p27 phosphorylation on Ser-10 and cell–cell adhesion in response to oncostatin M-MAPK signaling (Figure 1) and because of the defective assembly of adherens junctions in p27S10A-expressing cells (Figures 4 and 6), we next investigated whether oncostatin M could stimulate cell–cell adhesion in p27S10A-expressing cells. For this, p27S10A-expressing cells were subjected to the cell aggregation assay (see Materials and Methods; cf. Figures 1C and 3F) in the presence of oncostatin M (10 ng/ml) or buffer (control) for 4 h. After a 4-h shaking period, ∼40, 25, 25, and 10% of control p27S10A-expressing cells were single or appeared as aggregates of 2, 3, or >4 cells after a 4-h period of shaking, respectively. A very similar distribution pattern was observed when the cell aggregation assay was performed in the presence of oncostatin M (Figure 9), which is in contrast to the increased percentage of cells that appeared in multicellular clusters in oncostatin M–treated parental cells (cf. Figure 1C). We conclude that oncostatin M fails to stimulate cell–cell adhesion in p27S10A-expressing HepG2 cells.
Figure 9.

Oncostatin M does not stimulate cell–cell adhesion in p27S10A-expressing HepG2 cells. HepG2 cells expressing p27S10A were treated with oncostatin M (10 ng/ml) or buffer (control) for 4 h, detached, and made to a single-cell suspension as described in Materials and Methods. The cells were then subjected to the cell–cell aggregation assay in the presence of oncostatin M or buffer (control) at 37°C for 4 h. The number of single cells (white bars) and cells in aggregates of 2 (gray bars), 3 (hatched bars), or larger clusters (dotted bars) is presented as a percentage of the total number of cells and expressed as mean ± SD of three independent experiments. Note that oncostatin M does not stimulate cell–cell adhesion in cells expressing p27S10A.
Oncostatin M Fails to Stimulate the Localization of E-Cadherin and β-Catenin at the Surface of p27-silenced Cells
To examine whether endogenous p27 is required for the (oncostatin M-stimulated) formation of adherens junctions, endogenous p27 was knocked down with siRNA in HepG2 cells. In cells that showed no or negligible immunoreactivity to p27 antibodies (as determined by immunofluorescence microscopy) a loss of E-cadherin (Figure 10, D–F) and β-catenin (Figure 10, M–O) from the cell surface was observed, in contrast to control cells in which E-cadherin and β-catenin showed a predominant localization at the cell surface (Figure 10, A–C and J–L). Note that in p27-silenced HepG2 cells, E-cadherin and β-catenin did not localize to defined intracellular sites as observed in HepG2 cells expressing p27S10A (cf. Figure 6, G and H, respectively), which may suggest that the mechanism via which p27 knockdown and p27S10A expression influence the surface expression of E-cadherin/β-catenin differs. On stimulation of HepG2 cells that lack p27 with oncostatin M for 4 h, no significant increase in the amount of E-cadherin and β-catenin at the cell surface was observed (Figure 10, G–I and P–R). We conclude from these data that endogenous p27 is required for E-cadherin/β-catenin–mediated adherens junction formation in HepG2 cells.
Figure 10.

Subcellular distribution of E-cadherin and β-catenin is perturbed in p27 knockdown cells. HepG2 cells were treated with siRNA against p27 or control siRNA as described in Materials and Methods, fixed and immunolabeled with mouse monoclonal antibodies against p27 and E-cadherin (A–I) or β-catenin (J–R), and incubated with the nuclear stain Hoechst. In G–I and P–R, cells were treated with oncostatin M at 37°C for 4 h before fixation. Bar, 10 μm.
Hepatocytes from p27S10A Knockin Mice Reveal an Aberrant Subcellular Distribution of E-Cadherin and β-Catenin
Mice that lack p27 are viable and fertile though larger than control mice, raising the possibility that p27 may not play an essential role in the assembly and regulation of adherens junctions in vivo. In addition, p27S10A knockin mice, which display a normal body size, do not reveal a clear organismal phenotype (Besson et al., 2006; Kotake et al., 2005). To examine adherens junctions in hepatocytes from p27S10A knockin mice, which express the mutant protein under the control of the endogenous promotor of p27, liver coupes from 4-mo-old p27S10A knockin mice and control wild-type mice (Besson et al., 2006) were immunolabeled for E-cadherin and β-catenin and counterstained with hematoxylin. As shown in Figure 11, B and D, E-cadherin was largely retained intracellularly in hepatocytes from p27S10A knockin mice, in contrast to their more prominent localization at the surface of hepatocytes from normal mice (Figure 11, A and C). Although less dramatic when compared with the distribution of E-cadherin, also the surface staining of β-catenin appeared more diffuse, and more β-catenin was variably detected intracellularly (Figure 11, F and H, compare with control in Figure 11, E and G). These data show that the primary adherens junction proteins E-cadherin and β-catenin, are aberrantly localized in livers derived from p27S10A knockin mice, consistent with the results from hepatic HepG2 cells, and suggest that also in vivo Ser-10 in p27 is necessary to establish a proper subcellular distribution and function of adherens junction proteins.
Figure 11.

A p27S10A mutation perturbs the localization of adherens junction proteins in vivo. Liver coupes from 4-mo-old p27S10A knockin mice were immunolabeled for E-cadherin (B and D) and β-catenin (F and H), counterstained with hematoxylin (blue nuclei), and compared with the livers of control wild-type mice (A,C and E,G, respectively). Note the reduction of cell surface staining and intracellular distribution of E-cadherin and β-catenin in hepatocytes from p27S10A knockin mice when compared with those of control mice. Bar, 40 μm.
DISCUSSION
In this study, it is demonstrated that Ser-10 in p27, a protein that was originally identified as a cell cycle inhibitor, directly controls the establishment of adherens junctions in hepatocytes and HepG2 cells. Although the expression of wild-type p27 or phospho-mimetic p27S10D promotes cell–cell adhesion, the expression of phosphorylation-defective p27S10A inhibits cell–cell adhesion. The effect of the p27 Ser10 mutants on cell–cell adhesion cannot be correlated to cell proliferation. Indeed, the at most mild effects of the S10A and S10D mutations in p27 on cell proliferation cannot account for the dramatic and strikingly opposing effects of these mutations on cell–cell adhesion.
Our data show that the two core components of adherens junctions, E-cadherin and β-catenin, are retained at disparate locations in p27S10A-expressing cells and cannot be mobilized at the cell surface. As part of a possible underlying mechanism, it is shown that in these cells p27 interacts with β-catenin and that β-catenin cannot interact with E-cadherin. Although further in vitro studies are needed to determine 1) whether the p27-β-catenin interaction is direct or indirect, 2) which parts of p27 and β-catenin are involved, and 3) whether p27 interaction with β-catenin may be responsible for the inhibited interaction of the latter with E-cadherin, the data clearly demonstrate the involvement of p27 and its Ser-10 in the mobilization of E-cadherin and β-catenin at the cell surface and adherens junction assembly. This is fully supported by our observations in hepatocytes from the p27S10A knockin mice.
The phosphorylation of p27 on Ser-10 is stimulated by the interleukin 6-family cytokine OSM. This can be correlated to the cell–cell adhesion promoting effect of OSM under conditions that do not influence cell proliferation. The phosphorylation of p27 on Ser-10 by OSM requires a prior phosphorylation, and activation of its downstream targets MAPK kinase and p42/44 MAPK, and inhibition of MAPK signaling prevents OSM-stimulated cell–cell adhesion. Importantly, expression of the p27S10A mutant similarly prevents the stimulatory effect of OSM on HepG2 cell–cell adhesion strength. Because β-catenin is known to facilitate E-cadherin processing (Chen et al., 1999; Miranda et al., 2001) and because of the interaction of p27 with β-catenin in p27S10A-expressing cells (this study), the S10A mutation possibly acts in a dominant-negative manner. Interestingly, similar to p27S10A-expressing cells, p27 knockdown cells display reduced E-cadherin and β-catenin at the cell surface, and oncostatin M signaling in these cells is unable to restore their surface localization. This suggests that p27 itself may also promote E-cadherin/β-catenin–based cell–cell adhesion. Although our results with oncostatin M signaling and overexpression of p27WT and p27S10D indicate that Ser10 phosphorylation is likely to be involved in this, we cannot formally rule out the involvement of additional phosphorylation sites in (oncostatin M-stimulated) E-cadherin/β-catenin–mediated cell–cell adhesion. In all, the data provide clues with regard to the molecular mechanisms that couple intracellular signaling pathways to the dynamics of β-catenin and E-cadherin, and the consequent formation of adherens junctions, in response to a cell differentiation-promoting extracellular stimulus.
Although gene inactivation of E-cadherin and β-catenin in mice results in embryonic lethality (Larue et al., 1994; Haegel et al., 1995; Riethmacher et al., 1995), the pronounced reduction of E-cadherin at the cell surface in hepatocytes from p27S10A knockin mice does not appear to affect general liver morphology. This is in agreement with the finding that in conditional E-cadherin knockout mice, E-cadherin is dispensable for liver development (Battle et al., 2006). Moreover, the absence of E-cadherin and β-catenin from the cell surface and the concomitant loss of adherens junctions in p27S10A-expressing HepG2 cells do not change the typical lateral localization of the ABC transporter MRP1 and the tight junction protein ZO-1, and some desmosomes could still be observed (this study). This suggests that other junctions may still form and that E-cadherin/β-catenin–mediated adherens junctions are dispensable for maintaining lateral plasma membrane identity. Also, HepG2 cells expressing p27S10A develop full apical-basolateral cell polarity, although with a delay and without subsequent apical lumen remodelling (Théard et al., 2007). It is possible that additional adhesion proteins have compensated for the loss of E-cadherin and β-catenin at the cell surface, as was suggested in the conditional E-cadherin knockout mice (Battle et al., 2006). Regardless, the data in this study provide the first evidence that, in addition to the reported regulation of p27 expression in response to cell adhesion (Messina et al., 2005; Motti et al., 2005), p27 itself directly affects cell–cell adhesion via its Ser-10.
Supplementary Material
ACKNOWLEDGMENTS
We thank S. Meloche (University of Montreal, Montreal, QC, Canada) for providing us with the p27 plasmids; A. Besson and J. Roberts (Howard Hughes Medical Institute, Seattle, WA) for the livers from p27S10A knock-in and control mice; R. Medema (University Medical Center Utrecht, Utrecht, The Netherlands) for the TOP/FOP constructs; M. Wheelock (University of Nebraska Medical Center, Omaha, NE) for the E-cadherin antibody; H. Wiersma, J. Baller, and M. Golachowska (University Medical Center Groningen, Groningen, The Netherlands) for technical assistance; and I. Zuhorn (University Medical Center Groningen, Groningen, The Netherlands) for valuable advice and stimulating discussions.
Footnotes
This article was published online ahead of print in MBC in Press (http://www.molbiolcell.org/cgi/doi/10.1091/mbc.E07-07-0661) on February 13, 2008.
REFERENCES
- Battle M. A., Konopka G., Parviz F., Gaggl A. L., Yang C., Sladek F. M., Duncan S. A. Hepatocyte nuclear factor 4alpha orchestrates expression of cell adhesion proteins during the epithelial transformation of the developing liver. Proc. Natl. Acad. Sci. USA. 2006;103:8419–8424. doi: 10.1073/pnas.0600246103. [DOI] [PMC free article] [PubMed] [Google Scholar]
- Besson A., Gurian-West M., Schmidt A., Hall A., Roberts J. M. p27Kip1 modulates cell migration through the regulation of RhoA activation. Genes Dev. 2004;18:862–876. doi: 10.1101/gad.1185504. [DOI] [PMC free article] [PubMed] [Google Scholar]
- Besson A., Gurian-West M., Chen X., Kelly-Spratt K. S., Kemp C. J., Roberts J. M. A pathway in quiescent cells that controls p27Kip1 stability, subcellular localization, and tumor suppression. Genes Dev. 2006;20:47–64. doi: 10.1101/gad.1384406. [DOI] [PMC free article] [PubMed] [Google Scholar]
- Bryant D. M., Stow J. L. The ins and outs of E-cadherin trafficking. Trends Cell Biol. 2004;14:427–434. doi: 10.1016/j.tcb.2004.07.007. [DOI] [PubMed] [Google Scholar]
- Chen Y. T., Stewart D. B., Nelson W. J. Coupling assembly of the E-cadherin/beta-catenin complex to efficient endoplasmic reticulum exit and basal-lateral membrane targeting of E-cadherin in polarized MDCK cells. J. Cell Biol. 1999;144:687–699. doi: 10.1083/jcb.144.4.687. [DOI] [PMC free article] [PubMed] [Google Scholar]
- Denicourt C., Saenz C. C., Datnow B., Cui X. S., Dowdy S. F. Relocalized p27Kip1 tumor suppressor functions as a cytoplasmic metastatic oncogene in melanoma. Cancer Res. 2007;67:9238–9243. doi: 10.1158/0008-5472.CAN-07-1375. [DOI] [PubMed] [Google Scholar]
- Deschênes C., Vézina A., Beaulieu J. F., Rivard N. Role of p27(Kip1) in human intestinal cell differentiation. Gastroenterology. 2001;120:423–438. doi: 10.1053/gast.2001.21199. [DOI] [PubMed] [Google Scholar]
- Drexler H. C. The role of p27Kip1 in proteasome inhibitor induced apoptosis. Cell Cycle. 2003;2:438–441. [PubMed] [Google Scholar]
- Gumbiner B. M. Regulation of cadherin-mediated adhesion in morphogenesis. Nat. Rev. Mol. Cell Biol. 2005;6:622–634. doi: 10.1038/nrm1699. [DOI] [PubMed] [Google Scholar]
- Halbleib J. M., Nelson W. J. Cadherins in development: cell adhesion, sorting, and tissue morphogenesis. Genes Dev. 2006;20:3199–3214. doi: 10.1101/gad.1486806. [DOI] [PubMed] [Google Scholar]
- Haegel H., Larue L., Ohsugi M., Fedorov L., Herrenknecht K., Kemler R. Lack of beta-catenin affects mouse development at gastrulation. Development. 1995;121:3529–3537. doi: 10.1242/dev.121.11.3529. [DOI] [PubMed] [Google Scholar]
- Heinrich P. C., Behrmann I., Muller-Newen G., Schaper F., Graeve L. Interleukin-6-type cytokine signalling through the gp130/Jak/STAT pathway. Biochem. J. 1998;334:297–314. doi: 10.1042/bj3340297. [DOI] [PMC free article] [PubMed] [Google Scholar]
- Ishida N., Kitagawa M., Hatakeyama S., Nakayama K. Phosphorylation at serine 10, a major phosphorylation site of p27(Kip1), increases its protein stability. J. Biol. Chem. 2000;275:25146–25154. doi: 10.1074/jbc.M001144200. [DOI] [PubMed] [Google Scholar]
- Kamiya A., et al. Fetal liver development requires a paracrine action of oncostatin M through the gp130 signal transducer. EMBO J. 1999;18:2127–2136. doi: 10.1093/emboj/18.8.2127. [DOI] [PMC free article] [PubMed] [Google Scholar]
- Kemler R., Ozawa M. Uvomorulin-catenin complex: cytoplasmic anchorage of a Ca2+-dependent cell adhesion molecule. Bioessays. 1989;11:88–91. doi: 10.1002/bies.950110403. [DOI] [PubMed] [Google Scholar]
- Kinoshita T., Miyajima A. Cytokine regulation of liver development. Biochim. Biophys. Acta. 2002;1592:303–312. doi: 10.1016/s0167-4889(02)00323-3. [DOI] [PubMed] [Google Scholar]
- Klausen P., Pedersen L., Jurlander J., Baumann H. Oncostatin M and interleukin 6 inhibit cell cycle progression by prevention of p27kip1 degradation in HepG2 cells. Oncogene. 2000;19:3675–3683. doi: 10.1038/sj.onc.1203707. [DOI] [PubMed] [Google Scholar]
- Kotake Y., Nakayama K., Ishida N., Nakayama K. I. Role of serine 10 phosphorylation in p27 stabilization revealed by analysis of p27 knock-in mice harboring a serine 10 mutation. J. Biol. Chem. 2005;280:1095–1102. doi: 10.1074/jbc.M406117200. [DOI] [PubMed] [Google Scholar]
- Larue L., Ohsugi M., Hirchenhain J., Kemler R. Free in PMC E-cadherin null mutant embryos fail to form a trophectoderm epithelium. Proc. Natl. Acad. Sci. USA. 1994;91:8263–8267. doi: 10.1073/pnas.91.17.8263. [DOI] [PMC free article] [PubMed] [Google Scholar]
- Le T. L., Yap A. S., Stow J. L. Recycling of E-cadherin: a potential mechanism for regulating cadherin dynamics. J. Cell Biol. 1999;146:219–232. [PMC free article] [PubMed] [Google Scholar]
- Matsui T., Kinoshita T., Morikawa Y., Tohya K., Katsuki M., Ito Y., Kamiya A., Miyajima A. K-Ras mediates cytokine-induced formation of E-cadherin-based adherens junctions during liver development. EMBO J. 2002;21:1021–1030. doi: 10.1093/emboj/21.5.1021. [DOI] [PMC free article] [PubMed] [Google Scholar]
- McAllister S. S., Becker-Hapak M., Pintucci G., Pagano M., Dowdy S. F. Novel p27(kip1) C-terminal scatter domain mediates Rac-dependent cell migration independent of cell cycle arrest functions. Mol. Cell. Biol. 2003;23:216–228. doi: 10.1128/MCB.23.1.216-228.2003. [DOI] [PMC free article] [PubMed] [Google Scholar]
- Messina G., Blasi C., La Rocca S. A., Pompili M., Calconi A., Grossi M. p27Kip1 acts downstream of N-cadherin-mediated cell adhesion to promote myogenesis beyond cell cycle regulation. Mol. Biol. Cell. 2005;16:1469–1480. doi: 10.1091/mbc.E04-07-0612. [DOI] [PMC free article] [PubMed] [Google Scholar]
- Miranda K. C., Khromykh T., Christy P., Le T. L., Gottardi C. J., Yap A. S., Stow J. L., Teasdale R. D. A dileucine motif targets E-cadherin to the basolateral cell surface in Madin-Darby canine kidney and LLC-PK1 epithelial cells. J. Biol. Chem. 2001;276:22565–22572. doi: 10.1074/jbc.M101907200. [DOI] [PubMed] [Google Scholar]
- Motti M. L., Califano D., Baldassarre G., Celetti A., Merolla F., Forzati F., Napolitano M., Tavernise B., Fusco A., Viglietto G. Reduced E-cadherin expression contributes to the loss of p27kip1-mediated mechanism of contact inhibition in thyroid anaplastic carcinomas. Carcinogenesis. 2005;26:1021–1034. doi: 10.1093/carcin/bgi050. [DOI] [PubMed] [Google Scholar]
- Polyak K., Lee M. H., Erdjument-Bromage H., Koff A., Roberts J. M., Tempst P., Massague J. Cloning of p27Kip1, a cyclin-dependent kinase inhibitor and a potential mediator of extracellular antimitogenic signals. Cell. 1994;78:59–66. doi: 10.1016/0092-8674(94)90572-x. [DOI] [PubMed] [Google Scholar]
- Riethmacher D., Brinkmann V., Birchmeier C. A targeted mutation in the mouse E-cadherin gene results in defective preimplantation development. Proc. Natl. Acad. Sci. USA. 1995;92:855–859. doi: 10.1073/pnas.92.3.855. [DOI] [PMC free article] [PubMed] [Google Scholar]
- Rodier G., Montagnoli A., Di Marcotullio L., Coulombe P., Draetta G. F., Pagano M., Meloche S. p27 cytoplasmic localization is regulated by phosphorylation on Ser10 and is not a prerequisite for its proteolysis. EMBO J. 2001;20:6672–6682. doi: 10.1093/emboj/20.23.6672. [DOI] [PMC free article] [PubMed] [Google Scholar]
- Schock F., Perrimon N. Molecular mechanisms of epithelial morphogenesis. Annu. Rev. Cell Dev. Biol. 2002;18:463–493. doi: 10.1146/annurev.cellbio.18.022602.131838. [DOI] [PubMed] [Google Scholar]
- Théard D., Steiner M., Kalicharan D., Hoekstra D., van IJzendoorn S. C. Cell polarity development and protein trafficking in hepatocytes lacking E-cadherin/beta-catenin-based adherens junctions. Mol. Biol. Cell. 2007;18:2313–2321. doi: 10.1091/mbc.E06-11-1040. [DOI] [PMC free article] [PubMed] [Google Scholar]
- van der Wouden J. M., van IJzendoorn S. C., Hoekstra D. Oncostatin M regulates membrane traffic and stimulates bile canalicular membrane biogenesis in HepG2 cells. EMBO J. 2002;21:6409–6418. doi: 10.1093/emboj/cdf629. [DOI] [PMC free article] [PubMed] [Google Scholar]
- van IJzendoorn S. C., Zegers M. M., Kok J. W., Hoekstra D. Segregation of glucosylceramide and sphingomyelin occurs in the apical to basolateral transcytotic route in HepG2 cells. J. Cell Biol. 1997;137:347–357. doi: 10.1083/jcb.137.2.347. [DOI] [PMC free article] [PubMed] [Google Scholar]
- van IJzendoorn S. C., Théard D., van der Wouden J. M., Visser W., Wojtal K. A., Hoekstra D. Oncostatin M-stimulated apical plasma membrane biogenesis requires p27(Kip1)-regulated cell cycle dynamics. Mol. Biol. Cell. 2004;15:4105–4114. doi: 10.1091/mbc.E04-03-0201. [DOI] [PMC free article] [PubMed] [Google Scholar]
- Wheelock M. J. Catenin association with E-cadherin changes with the state of polarity of HT-29 cells. Exp. Cell Res. 1990;191:186–193. doi: 10.1016/0014-4827(90)90004-t. [DOI] [PubMed] [Google Scholar]
- Wojtal K. A., Hoekstra D., van IJzendoorn S. C. Anchoring of PKA-RII{alpha} to subapically positioned centrosomes mediates apical bile canalicular lumen development in response to oncostatin M but not cAMP. Mol. Biol. Cell. 2007;18:2745–2754. doi: 10.1091/mbc.E06-08-0732. [DOI] [PMC free article] [PubMed] [Google Scholar]
Associated Data
This section collects any data citations, data availability statements, or supplementary materials included in this article.