

Abstract
Background
Angiotensin-converting enzyme (ACE) inhibitors, such as captopril, are used to control hypertension. In patients and animals with primary nephropathies, these agents improve renal function more than that would be expected from their control of hypertension. Here, we examine the effects of treatment with captopril on lupus nephritis and discuss the potential mechanism(s) by which this agent exerts its renoprotective effects.
Methods
Lupus-prone, NZB/NZW F1 and MRL-lpr/lpr, mice were treated with captopril or with a control antihypertensive agent, verapamil. Mice were monitored for nephritis, and their sera and tissues analyzed for cytokine and transforming growth factor-β (TGF-β) expression.
Results
Captopril treatment delayed the onset of proteinuria when administered to prenephritic mice, whereas verapamil did not. Captopril treatment also retarded disease progression when given to lupus mice that had early disease, and even reversed severe proteinuria in at least some older animals with advanced disease. It reduced chronic renal lesions, but had no effect on autoantibody production. The improvement in renal disease correlated with reduced TGF-β expression, particularly of the TGF-β1 and TGF-β2 isoforms, in the kidneys. Interestingly, in vivo or in vitro exposure to captopril reduced splenic levels of type 2 cytokines, interleukin (IL)-4 and IL-10, suggesting a possible role of the immune system in captopril-mediated disease modulation.
Conclusion
Since type 2 cytokines are known to promote lupus glomerulosclerosis, decreased IL-4 and IL-10 production in captopril-treated mice may be related to this agent’s renoprotective effects. We argue here that ACE inhibitors not only act as selective TGF-β inhibitors, but also as selective immunomodulators, to improve lupus nephritis.
Keywords: animal models, autoantibodies, cytokines, lupus nephritis, systemic lupus erythematosus, transforming growth factor β
Development of kidney disease is one of the most serious consequences of systemic lupus erythematosus (SLE). Lupus nephritis is believed to result mostly from renal deposition of autoantibodies and immune complexes [1], which in turn triggers an acute inflammatory response characterized by activation of leukocytes and renal parenchymal cells. This activation is accompanied by the production of cytokines and growth factors. Nephritis may then progress to a chronic phase, characterized by excessive deposition of collagen and other extracellular matrix macromolecules [2]. The mechanistic changes underlying this process of renal fibrosis and its eventual progression to end-stage renal disease (ESRD) are not adequately understood.
Several lines of evidence suggest that the transforming growth factor-β (TGF-β) contributes to the development of fibrosis in various tissues, including kidneys [3–5]. Recent studies also implicate type 2 cytokines, such as interleukin (IL)-4, IL-10, and IL-13, in the development of tissue fibrosis [6, 7]. For example, we have recently reported that IL-4 contributes to the development of glomerulosclerosis in murine lupus [8]. In vivo neutralization of IL-4 by anti-IL-4 antibody treatment markedly reduces chronic renal disease in lupus-prone NZM.2410 mice. In addition, NZM.2410 mice rendered deficient in STAT6, a transcription factor involved in the production and function of type 2 cytokines, are completely protected from the development of glomerulosclerosis [8].
Kidneys contain all the components of the renin-angiotensin system, the substrate (angiotensinogen), the enzymes involved in the synthesis of angiotensins, and angiotensin receptors [9]. Ample evidence supporting a possible role for the renin-angiotensin system in renal fibrosis includes (1) angiotensin II stimulates fibroblast activation [9–11]; (2) angiotensin II receptor knockout mice are protected from chronic kidney disease [12, 13]; and (3) agents that inhibit the production or function of angiotensin II, that is, angiotensin-converting enzyme (ACE) inhibitors and angiotensin receptor blockers, respectively, reduce or even reverse the development of chronic kidney lesions in murine models of primary renal diseases [5, 9, 14].
The role of the renin-angiotensin system and the effects of angiotensin II inhibitors on the development of SLE have not been well studied. One line of evidence that supports a role for this system in the development of lupus nephritis comes from studies of ACE gene polymorphisms, in which patients with certain ACE genotypes present with severe nephritis [15]. Additionally in three uncontrolled case series each involving less than 14 patients, treatment with captopril improved lupus nephritis [16–19]. In addition, using animal models of lupus, one laboratory has also reported beneficial effects of captopril [20–22].
Mechanisms by which angiotensin II inhibitors exert a protective effect against renal injury are not well understood. The effect appears to be independent of their antihypertensive effect [23]. It has been suggested that the angiotensin II inhibitors decrease renal fibrosis by restricting the angiotensin II–stimulated production of TGF-β [5, 24, 25], although it remains unclear which particular isoform (i.e., TGF-β1, TGF-β2, or TGF-β3) is involved. Since immune cells also express angiotensin II and angiotensin II receptors [26–29], angiotensin II inhibitors may also directly affect immune functions [30, 31] and thus regulate immune-mediated kidney diseases.
Here, we have examined the clinical outcome and effect( s) of treatment with an ACE inhibitor, captopril, in murine models of SLE. Specifically, we have evaluated the effects of captopril on the development and progression of nephritis, autoantibody production, and cytokine responses, which are implicated in the development of tissue fibrosis. Our results show that captopril treatment reduces the development of chronic renal lesions, without any apparent effect on autoantibody production. The observed improvement in renal disease is associated with reduced expression of the TGF-β isoforms, TGF-β1 and TGF-β2, in the kidneys, and with decreased production of cytokines IL-4 and IL-10 in spleen cells. We propose that the beneficial effect of ACE inhibitors on renal disease is due to a combination of both their local reduction of TGF-β expression and on immune system type 2 cytokine production.
METHODS
Animals
NZB, NZW, BALB/c, and B10.Pl mice were originally obtained from the Jackson Laboratories (Bar Harbor, ME, USA) and were intercrossed to generate (NZB × NZW) F1 [BWF1], (BALB/c × NZW) F1 [CWF1] and (NZB × 10.Pl) F1 [BPF1] mice. MRL-lpr/lpr mice were purchased from the Jackson laboratories. BWF1 and MRL-lpr/lpr mice develop glomerulonephritis, which histologically is similar to the disease seen in humans with SLE [8, 32]. CWF1 and BPF1 mice, which carry the major histocompatibility (MHC) class II molecules identical to those in BWF1 mice, do not develop a lupus-like autoimmune disease [33].
Treatment
Mice were treated with captopril, verapamil, or were left on normal drinking water. Captopril (Squibb&Sons, Princeton, NJ, USA) and verapamil (Geneva Pharmaceutical, Inc., Broomfield, CO, USA) were dissolved in drinking water at a concentration of 0.2 and 0.5 mg/mL, respectively. The daily dosage was 32 mg/kg body weight for captopril and 72 mg/kg for verapamil, assuming a daily fluid intake of 5 mL. These doses of the two antihypertensive drugs were chosen to achieve a similar level of systolic blood pressure.
Assessment of renal disease
Animals were monitored for proteinuria and were bled for measurements of serum TGF-β and autoantibodies. Proteinuria was estimated by examination of fresh urine using Albustix (Ames, Elkhart, IN, USA) on a scale of 0 to 4, where 0/trace = nondetectable, 1 = 30 mg of protein/dL, 2 = 100 mg of protein/dL, 3 = 300 mg of protein/dL, and 4 ≥ 2000 mg of protein/dL. Severe proteinuria was defined as ≥ 300 mg/dL on two consecutive occasions [32].
Blood pressure measurement
Blood pressure was measured by tail cuff using BP-2000 Computerized Blood Pressure Analysis System for rodents (Visitech Systems, Raleigh, NC, USA). Blood pressure was recorded daily for 4 to 5 consecutive days. Data are expressed as the mean of eight to ten successful measurements.
Kidney histology
Kidney tissues were fixed in 4% paraformaldehyde and processed into paraffin. Four micrometer sections were cut, stained with hematoxylin and eosin (H&E), periodic acid-Schiff (PAS), Jones silver, and Masson’s trichrome, and scored by two of us (R.R.S. and D.A.A.) in a blinded fashion for various morphologic lesions on a 0 to 3 scale, where 0 = absence of lesions; 0.5 = minimal lesions (less than 10%); 1 = lesions involving up to 30% of the component considered; 2 = lesions involving 30% to 60%; and 3 = lesions involving >60% of the component. The following components were studied: (1) glomerular activity score (GAS) that includes glomerular proliferation, karyorrhexis, fibrinoid necrosis, inflammatory cells, cellular crescents and hyaline deposits; (2) tubulointerstitial activity score (TIAS) that includes interstitial inflammation, tubular cell necrosis and/or flattening, and epithelial cells or macrophages in tubular lumen; (3) chronic lesions score (CLS) that includes glomerular sclerosis and/or scarring, fibrous crescents, tubular atrophy, and interstitial fibrosis; and (4) vascular lesion score (VLS) that includes arterial/arteriolar lesions. The raw scores assigned by the two readers were averaged to obtain a mean score for the each individual feature. These mean scores were then summed to obtain the average score for each of the four main indices (GAS, TIAS, CLS, and VLS), which were then summed to obtain a composite kidney biopsy score.
Renal immunofluorescence and immunohistochemistry
Kidneys were embedded in Tissue-Tec OCT medium (Miles Inc., Elkhart, IN, USA) and frozen in liquid nitrogen. Four micrometer thick sections were fixed in 0.3% cold (4°C) acetone for 10 minutes, washed with phosphate-buffered saline (PBS)/0.05%-Tween, and blocked with PBS/2% bovine serum albumin (BSA) for 1 hour. Sections were stained with fluorescein-conjugated goat anti-mouse IgG (Sigma ChemicalCo., St. Louis, MO, USA) or antirat fibrinogen (ICN Pharmaceuticals, Inc., Aurora, OH, USA) for 1 hour. For immunohistochemistry, fixed kidney sections were exposed to 0.3% hydrogen peroxide to quench endogenous peroxidase and blocked with PBS/2% BSA for 1 hour. Sections were then incubated with biotinylated rat antihuman/mouse TGF β (PharMingen, San Diego, CA, USA) for 2 hours at room temperature, followed by incubation with horseradish peroxidase-conjugated streptavidin (Zymed) for 1 hour in a humidified chamber. Slides were next stained with orthophenylene diamine, counterstained with H&E, and were scored in a blinded fashion for the intensity of staining in 25 to 30 glomeruli, tubules, interstitium, and blood vessels on a scale of 0 to 3, where 0 = negative, 1 = mild scattered staining, 2 = moderate staining, and 3 = strong diffuse staining.
Measurement of anti-dsDNA antibodies
Serum anti-dsDNA antibodies were measured by enzyme-linked immunosorbent assay (ELISA), as previously described [32]. IgG anti-double-stranded (ds)DNA titers measured are expressed as units permL(U/mL), using a reference standard of pooled serum from 8-month old BWF1 mice.
Spleen cell culture
Spleen cells (5 × 10⁶ per mL) were cultured for 48 to 60 hours in a serum-free medium (AIM) (Gibco, Grand Island, NY, USA) for TGF-β assays or in RPMI medium supplemented with 10% fetal calf serum (FCS), 2 mmol/L L-glutamine, 4 mmol/L nonessential amino acid, and 1 mmol/L Hepes.
Measurement of cytokines
Cytokine levels in culture supernatants were determined by ELISA, using monoclonal antibody pairs and recombinant cytokines purchased from PharMingen, as described previously [34]. Total and endogenously active TGF-β1 were assayed on acid-treated (for total TGF-β1) and untreated (for endogenously active or free form of TGF-β1), samples, respectively, by sandwich ELISA using a kit purchased from Promega (Madison, WI, USA) following manufacturer’s instructions. In brief, multiwell ELISA plates (Maxisorp; Nunc, Naperville, IL, USA) were coated with 100 μL per well of an anti-TGF-β1 monoclonal antibody in carbonate buffer (pH 9.6) overnight at 4°C. Plates were washed three times with Tris-HCl (pH 7.6) containing 0.05% Tween 20, followed by blocking for 35 minutes at 37°C, prior to the addition of samples and recombinant TGF-β1 standard. Plates were then incubated for 90 minutes at room temperature and washed five times before the addition of 100 μL per well of an anti-TGF-β1 antibody. After 2 hours of incubation at room temperature, 100 μL of a goat antirabbit IgG conjugated to horseradish peroxidase was added to each well and the plates were incubated for an additional 2 hours. Afterward, they were washed six times and 100 μL peroxidase substrate/tetramethyl benzidine (TMB) solution was added. Fifteen minutes later, the reaction was stopped with 1 mol/L phosphoric acid and the optical density (OD) 450 nm was read using an ELISA reader.
Detection of TGF-β in kidney eluates
Frozen kidneys were homogenized in Hank’s balanced salt solution, filtered through a 0.22 μm pore membrane and centrifuged at 1200 × g to remove cell debris. TGF-β levels were measured using a TGF-β–specific kit (Promega) as described above. Eluates were analyzed for total protein concentration using the BCA Kit (Pierce, Rockford, IL, USA). Results are expressed as the TGF-β: total protein ratio in the kidneys.
Riboprobes
The riboprobes were synthesized from vectors containing fragments of murine cDNA for TGF-β1 (974 bp; nucleotides 421-1395) [35], TGF-β2 (442 bp; nucleotides 1511-1953) [36], and TGF-β3 (609 bp; nucleotides 831-1440) [37] (kind gifts from Dr. Harold Moses, Vanderbilt University, Nashville, TN). To generate antisense (sense) riboprobes, plasmid murine (pm)TGF-β plasmids were linearized using HindIII (EcoRI) for pmTGF-β1, EcoRI (XhoI) for pmTGF-β2, and HindIII (XbaI) for pmTGF-β3. T7 (SP6), SP6 (T7), and T7 (SP6)RNA polymerases were used to synthesize digoxigenin-labeled uridine triphosphate (DIG-UTP) antisense (sense) probes for TGF-β1, TGF-β2, and TGF-β3, respectively, using the manufacturer’s instructions (Roche Molecular Biochem, Indianapolis, IN, USA). All riboprobes were digested to an average length of 100 to 200 nucleotides by controlled alkaline hydrolysis before use in the in situ hybridization analysis.
In situ hybridization for detection of TGF-β1, TGF-β2, and TGF-β3 mRNA in the kidneys
Four micrometer paraffin kidney sections were cut, deparaffinized, treated with proteinase K (20 μg/mL) for 5 minute at room temperature, followed by successive washes in Tris-glycine, 2 × standard sodium citrate (SSC), and 0.1 mol/L triethanolamine/0.25% acetic anhydride, pH 8.0, for 10 minutes at room temperature each time. Afterward, the sections were washed again in 2 × SSC, and then dehydrated by 5-minute incubations in 70%, 95%, and 100% ethanol. The mouse TGF-β riboprobes were synthesized as described above using 4-thio uridine monophosphate (UMP). Sense and antisense RNA probes were generated, labeled using a S35 RNA labeling kit, denatured by boiling for 10 minutes, cooled on ice for 5 minutes, then added to hybridization buffer [50% formamide/2 × SSC/1 × Denhardt’s/20% dextran sulfate/0.75 mg/mL Herring sperm DNA (Sigma Chemical Co.)/0.75 mg/mL tRNA (Gibco BRL)] at 6 ng/μL, and the hybridization mixture was incubated with tissue overnight at 42°C to 45°C. The tissues were then washed three times with 1 × SSC for 10 minutes each time at 50°C, treated with RNase A (50 μg/mL) and RNase T1 (40 units) for 30 minutes at 37°C. This was followed by two 10-minute washes in 2 × SSC at 50°C and two 60-minute washes in 2 × SSC and dithiothreitol (DTT)/formamide, one 10-minute wash in 0.5 × SSC and DTT, and two 10- to 30-minute washes in 0.1 × SSC and DTT at 55°C. After further dehydration and air drying of tissues, the S35 label in the samples was detected by autoradiography, with the slides being exposed to NTB-2 emulsion (Kodak, Rochester, NY, USA) for 7 to 14 days, as described by the manufacturer. Sections were counterstained with H&E, mounted in permount, and air-dried and examined using a light microscope.
Statistical analysis
Differences in cytokine and antibody production between groups were compared using Graphpad InState or SAS softwares. Depending on the distribution of continuous data, Student t test or a Mann-Whitney U statistic was used for analysis. Differences of categorical data between groups were assessed using the two-sided Fisher’s exact test and the log-likelihood ratio test. Differences in the time to onset of proteinuria between groups was tested for signficant differences using survival analysis and log-rank tests.
RESULTS
Treatment of prenephritic BWF1 mice with captopril inhibits the development of chronic lupus nephritis
To assess the effect of ACE inhibitors on the development of spontaneous lupus nephritis, 16-week-old prenephritic BWF1 mice that tested positive for circulating IgG anti-dsDNA antibodies, but had no detectable proteinuria, were treated with captopril dissolved in normal drinking water. Control mice received verapamil or were left on normal drinking water. Mice were monitored weekly for proteinuria (Fig. 1A) and sacrificed after 14 weeks of treatment to determine the effect of treatment on renal histology (Fig. 1B and C). Dosages of captopril and verapamil were adjusted to achieve a similar level of tail-cuff blood pressure (Fig. 1D). As shown in Figure 1A, development of severe proteinuria was delayed in captopril-treated mice as compared with verapamil-treated or untreated control animals. By 30 weeks of age, six of ten untreated and five of ten verapamil-treated mice, but only one of 12 captopril treated mice, had developed severe proteinuria (P < 0.02).
Fig. 1. Captopril treatment delays the onset of proteinuria and inhibits chronic lupus nephritis in BWF1 mice.
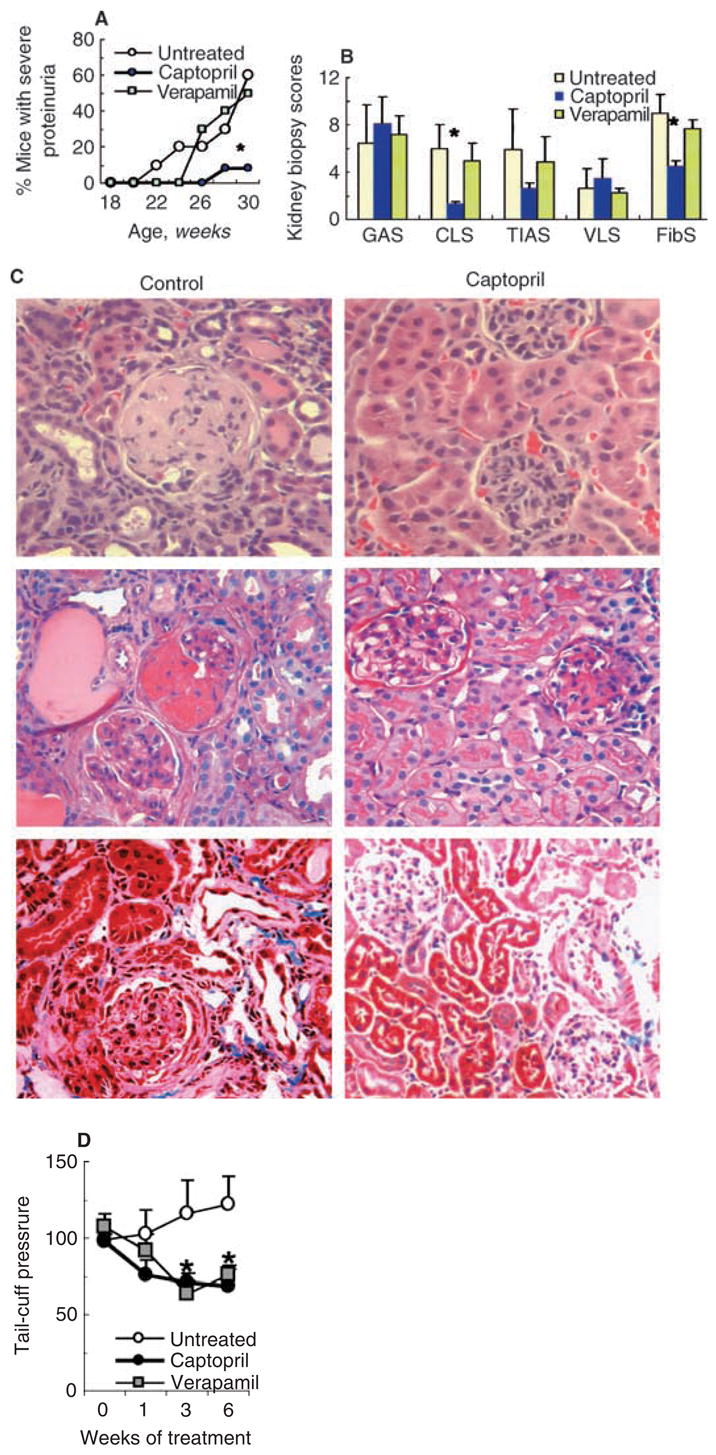
Sixteen-week-old BWF1 mice were treated with captopril (N = 12), verapamil (N = 10), or left on normal drinking water (N = 10) for 14 weeks. (A) Mice were monitored for proteinuria by Albustix. Results are expressed as the cumulative frequency of severe proteinuria (≥ 3+ on two consecutive occasions). *P < 0.02 captopril-treated versus verapamil-treated or untreated groups. (B) At 30 weeks of age, mice were sacrificed to analyze the effect of treatment on renal histology. Individual kidney biopsy scores, including glomerular activity score (GAS), chronic lesion score (CLS), tubulointerstitial activity score (TIAS), and vascular lesion score (VLS) are expressed as the mean ± SE. Immunofluorescence in glomeruli, blood vessels and tubules were scored on a scale of 0 to 3 in kidney sections stained with fluoroscein isothiocyanate (FITC) antifibrinogen; the individual scores were summed to obtain a fibrinogen score (FibS). *P < 0.05. (C) Representative renal sections stained with hematoxylin and eosin (H&E) (upper panel), periodic acid-Schiff (PAS) (middle panel), and Masson’s trichrome (lower panel) are shown. (D) Blood pressure measurements are shown as the mean ± SE of the mean tail-cuff pressure on the 4th day of consecutive daily recordings. *P < 0.05 to < 0.01 in the untreated versus captopril- or verapamil-treated mice.
At 30 weeks of age, kidneys were harvested from the treated and control mice and stained with H&E, PAS, and Masson’s trichrome. Stained sections were scored for active and chronic lesions using a kidney biopsy scoring system described in the Methods section. We found that while activity and vascular lesion scores, GAS, TIAS, and VLS, were not significantly different between the captopril-treated and control mice, chronic lesions (CLS) were significantly lower in captopril-treated mice than in both control groups (P < 0.05) (Fig. 1B). In particular, glomerulosclerosis, interstitial fibrosis, and tubular atrophy were markedly decreased in captopril-treated mice as compared with control animals (Fig. 1C, and data not shown).
A selective decrease in chronic renal lesions prompted us to further examine the effect of captopril treatment on renal matrix deposition. Frozen kidney sections were stained with a conjugated antifibrinogen antibody. The average staining scores were significantly lower in captopril-treated mice than in the control animals (Fig. 1B).
These data suggest that ACE inhibitors can delay the onset of proteinuria by selectively preventing the development of chronic renal lesions, including glomerulosclerosis and tubulointerstitial fibrosis.
Captopril treatment retards and even reverses renal disease in MRL-lpr/lpr and BWF1 mice
We next asked the question whether captopril treatment can retard the development of lupus nephritis in lupus-prone mice that have already developed disease. Fifteen-week-old MRL-lpr/lpr mice that had already begun to develop kidney disease were treated with captopril and monitored for the progression of disease. As shown in Figure 2A, while all nine untreated mice progressed to advanced renal disease and died, four of six captopril-treated mice remained aproteinuric during 3 months of follow up. The proportion of animals with severe proteinuria (≥ 300 mg/dL on two consecutive occasions) was significantly lower in the treated group than in the control untreated group (P < 0.05). While kidneys from all untreated mice showed advanced lesions, four of six captopril-treated mice had markedly reduced glomerular and tubular lesions (data not shown). Log-rank analysis supports a significantly increased survival among captopril-treated mice as compared to control animals (P < 0.01).
Fig. 2. Treatment with captopril retards and even reverses lupus renal disease in some mice.
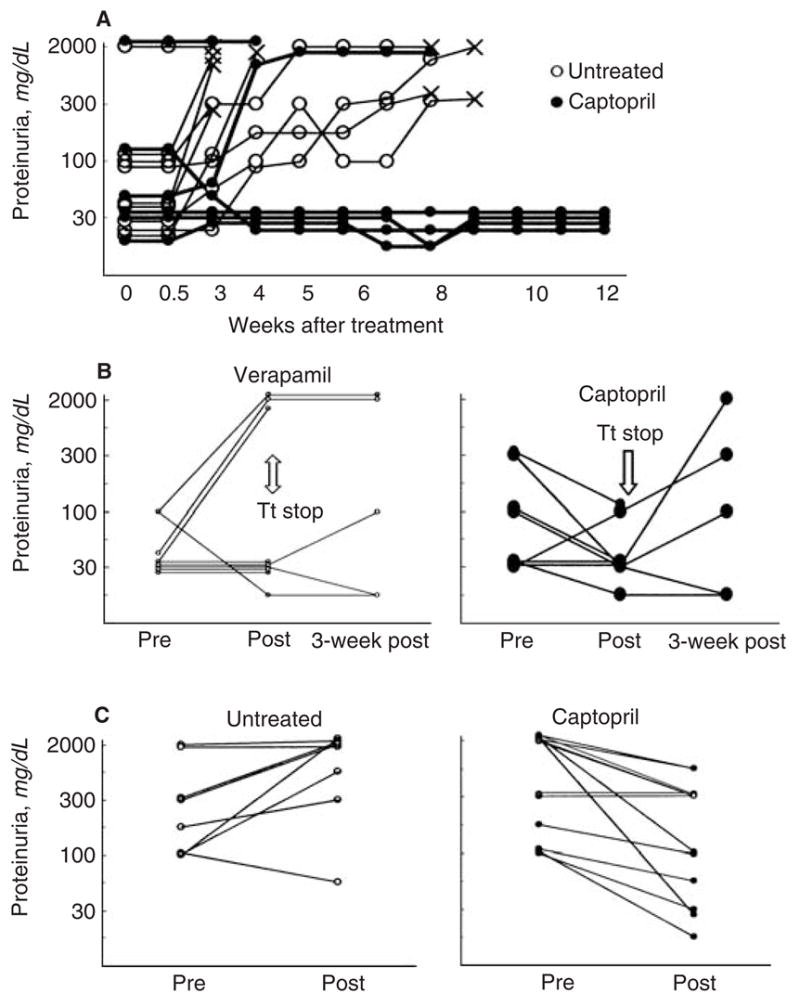
MRL-lpr/lpr (A) or BWF1 (B and C) mice were treated with captopril. Animals treated with verapamil (B) or those left on normal drinking water (A and C) served as controls. Results are expressed as the mean Albustix proteinuria readings from two consecutive assessments (0 = negative; trace <30 mg/dL; 1=30 mg/dL; 2=100 mg/dL; 3= 300 mg/dl; and 4=2000 mg/dL). Each line represents an individual mouse. (A)Treatment of 15-week-old MRL-lpr/lpr mice with captopril retards the development of nephritis (N = 9 untreated and 6 captopril-treated mice). Mice were sacrificed when they appeared to be terminally sick (×). (B) Five-month-old BWF1 mice were treated with captopril (N = 8) or verapamil (N = 9) for 4 weeks. After discontinuing the treatment, five mice in each group were monitored for another 3 weeks. Abbreviationa are: Pre, at treatment onset; post, immediately after completing treatment; Tt stop, treatment stop. (C) Treatment of BWF1 mice having advanced renal disease. Nine to 12-month-old BWF1 mice that had proteinuria readings of ≥ 100 mg/dL for two consecutive weeks were randomized to receive captopril or normal water for 2 weeks. Results are representative of two independent experiments. Abbreviations are: pre, at treatment onset; post, after treatment.
Similar results were obtained in 5-month-old female BWF1 mice that had high levels of IgG anti-dsDNA antibodies and occasionally proteinuria at the onset of treatment. At the end of 4 weeks of treatment, mean proteinuria levels were lower in captopril-treated than in verapamil-treated control animals (Fig. 2B). Three of nine mice in the verapamil-treated group, but none in the captopril-treated group, developed severe proteinuria at the end of treatment (P < 0.05). Upon discontinuation of the treatment, proteinuria reoccurred in the captopril-treated group (Fig. 2B). Taken together, these data suggest that captopril treatment may halt or even reverse renal disease in BWF1 mice having early disease.
To further examine whether captopril treatment could reverse advanced disease, aged (9 to 12 months old) and nephritic (>100 mg/dL proteinuria for at least 2 consecutive weeks) BWF1 mice were treated with captopril for 2 weeks (Fig. 2C). Nonparametric analyses were performed to compare proteinuria grades before and after treatment as well as to compare the change in proteinuria grades from the pretreatment level. Remarkably, the severity of proteinuria decreased in some captopril-treated mice, while untreated mice for the most part experienced worsening of proteinuria. At the end of treatment, animals in the captopril group had significantly lower grades of proteinuria than animals in the control group (P < 0.05). The change (decrease) in proteinuria grades was also greater in captopril-treated mice than in control animals (P < 0.05).
Serum autoantibody levels remain elevated in captopril-treated lupus mice
Studies in humans and mice with SLE suggest that kidney damage in SLE is caused, at least in part, by IgG anti-DNA antibodies [1]. Therefore, we examined whether the improvement in lupus nephritis in captopril-treated mice is related to the reduction of serum autoantibody levels. We found that captopril treatment had no significant effect on serum IgG anti-dsDNA antibody levels in BWF1 and MRL-lpr/lpr mice in six of seven experiments (Fig. 3, and data not shown). In the remaining one experiment in BWF1 mice and in another experiment in normal BPF1 mice, captopril-treated animals had modestly increased levels of IgG anti-dsDNA antibodies, but the differences were not statistically significant (data not shown). There was also no significant effect of captopril treatment on serum levels of rheumatoid factor and anti-cardiolipin autoantibodies and on IgG anti-dsDNA antibody production by spleen cells in vitro (data not shown). Thus, captopril treatment improves lupus nephritis by mechanism(s) other than the reduction of autoantibody production.
Fig. 3. Effect of captopril on serum IgG anti-dsDNA antibody levels.
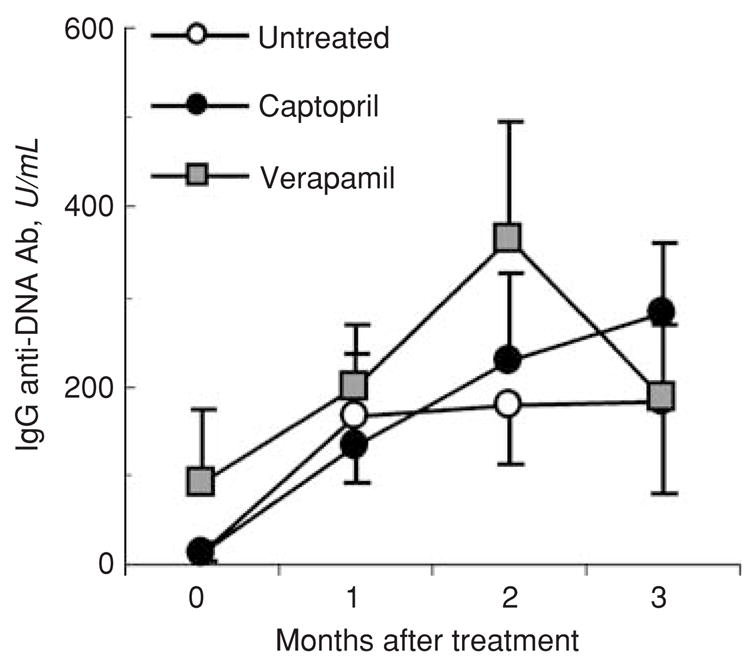
16-week-old BWF1 mice were treated with captopril or verapamil or were left on normal drinking water (n = 10–12 mice per group). Their sera were collected once a month for detection of IgG anti-dsDNA antibody levels. Results are shown as the mean ± SE U/mL. Data shown are representative of six independent experiments.
Captopril treatment selectively decreases the mRNA expression of the TGF-β1 and TGF-β2, but not of the TGF-β3 isoform, in the kidneys of lupus mice
In primary chronic nephropathy models, angiotensin II inhibitors are believed to exert renoprotective effect via their inhibitory effects on TGF-β production [5]. It is not known if a similar mechanism is operative in renal protection conferred by captopril treatment in lupus. There are three known mammalian isoforms of TGF-β (i.e., TGF-β1, -β2 and -β3), all of which signal through the TGF-β receptors type II and type I, and Smad signaling proteins [38]. It is unclear which of the three TGF-β isoforms contributes the most to the development of kidney disease. Captopril treatment may differentially affect the expression or activity of one or more isoforms of this important growth factor, thus leading to improvement in kidney disease. Here we used in situ hybridization analysis to localize and define the sites of TGF-β isoform expression in the kidneys from captopril-treated and untreated mice. Sixteen-week-old BWF1 mice were treated with captopril for 14 weeks. Their kidneys were harvested at the end of treatment and examined for mRNA expression and localization for the three TGF-β isoforms. Representative sections are shown in Figure 4A to C. The resulting images were also scored semiquantitatively for the expression of the various isoforms and a summary of scores is shown in Figure 4D. In the kidneys of untreated BWF1 mice, we detected a strong TGF-β1 mRNA signal in the glomeruli and lymphoid infiltrates (Fig. 4A, panels A and C), TGF-β2 mRNA was localized in the periglomerular region (Fig. 4B, panel A) and in isolated tubular cells (Fig. 4B, panels C and D), and TGF-β3 mRNA expression was uniformly distributed in the distal tubules (Fig. 4C, panels A, C, and D). In captopril-treated mice, TGF-β1 mRNA expression was markedly decreased in the glomeruli of all treated animals and modestly decreased in the lymphoid infiltrates. TGF-β2 mRNA expression in the periglomerular regions was also markedly decreased, but there was no effect of captopril treatment on the intense TGF-β2 mRNA signal in isolated tubular cells. TGF-β3 mRNA expression levels were not significantly different between the treated and control animals (see Fig. 4A to D, panel B). Thus, captopril-treated mice had a selective reduction in the expression of TGF-β1 and TGF-β2 isoforms only in certain renal structures.
Fig. 4. In situ hybridization for the detection of TGF-β1, TGF-β2, and TGF-β3 isoforms in kidneys of lupus mice.
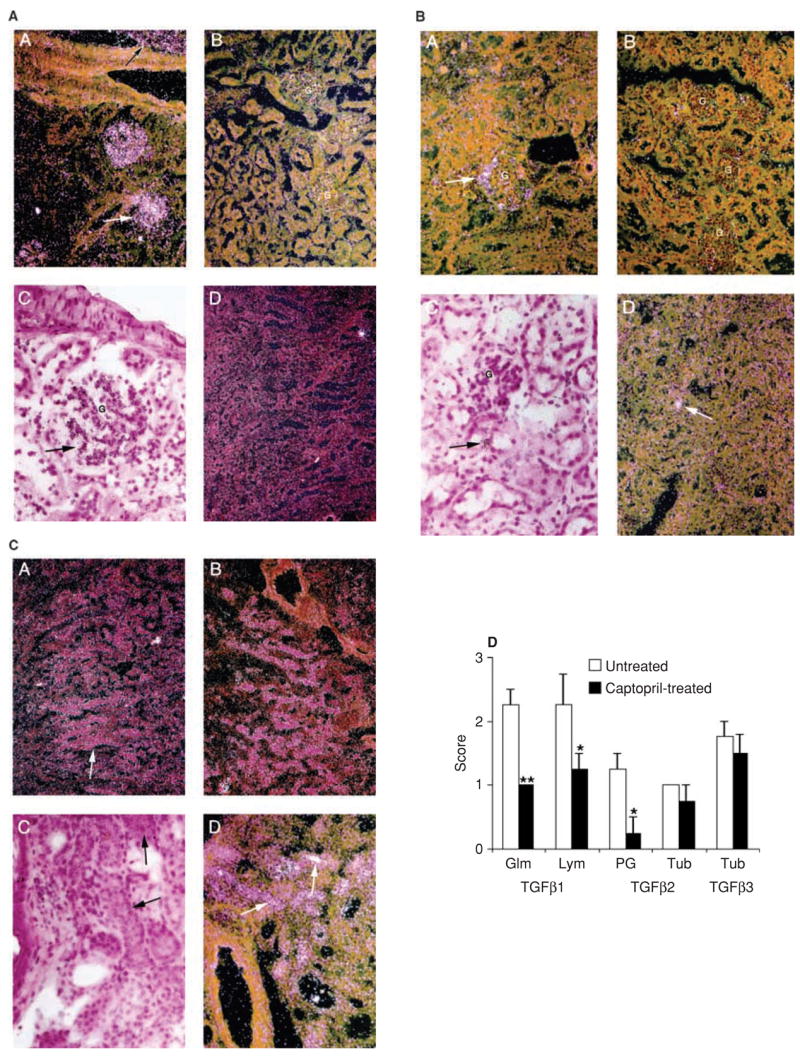
In situ hybridization was used to define the sites of TGF-β1, TGF-β2, and TGF-β3 mRNA expression in the kidneys of captopril-treated and untreated control animals. 16-week-old female BWF1 mice were treated with captopril for 14 weeks. At the end of treatment, their kidneys were analyzed for mRNA expression of the three TGF-β isoforms. Representative kidney sections from the untreated control [panels A, C and D in (A to C)] and captopril-treated mice [panel B in (A to C)] are shown. A, B and D, dark field; C, bright field. (A) TGF-β1 mRNA expression. Note intense expression in the glomeruli (G; see A and C) and lymphoid infiltrates (see A) in the kidneys of untreated mice, but not in the kidney of treated mice (B). The lack of staining with the control sense probe is shown in D. (B) TGF-β2 expression is noted in the periglomerular region (A) and isolated tubules (C and D) of kidneys from untreated mice (see arrow), but not in the kidneys of treated mice (B). (C) TGF-β3 is expressed uniformly in distal tubules of kidneys from both untreated (A, C, D) and treated (B) mice; no difference is noted between the treated and control mice. (D) Kidney sections from the treated and control mice were also scored for TGF-β1, TGF-β2, and TGF-β3 mRNA expression on a scale of 0–3, where 0 = no expression, 1 = mild, 2 = moderate, and 3 = marked expression. *P < 0.05; **P < 0.01. Glm = glomerular; Lym = lymphoid infiltrates; PG = periglomerular; Tub = tubular.
Effect of captopril treatment on TGF-β protein in the kidneys of lupus mice
We next examined the effect of captopril treatment on TGF-β protein localization in the kidneys of lupus-prone mice using immunostaining. In young BWF1 mice with early nephritis, renal TGF-β localization was lower in captopril-treated mice than in verapamil-treated animals (Fig. 5). TGF-β protein localization, however, was not consistently decreased in captopril-treated mice as compared to untreated control mice, when the treatment was initiated in older nephritic BWF1 mice (data not shown). For a more quantitative assessment of kidney TGF-β expression, we measured TGF-β protein levels in kidney eluates from captopril-treated and untreated BWF1 mice. To normalize for the variation in the size of kidney pieces used, total protein content was determined for each eluate. The levels of total and active TGF-β as well as the ratios of TGF-β to total protein in kidney eluates showed a decreasing trend in captopril-treated mice as compared to untreated mice, but the differences did not reach statistical significance (data not shown). Thus, captopril treatment inhibited renal TGF-β protein expression in young BWF1 mice, but had minimal effect on TGF-β protein expression in older BWF1 mice.
Fig. 5. Immunohistochemistry for renal TGF-β protein expression in lupus mice.
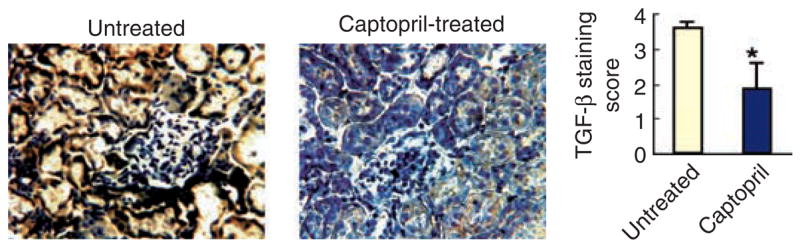
Five-mo-old BWF1 mice were treated with captopril. At the end of 6 weeks of treatment, their kidneys were stained with a conjugated anti-TGF-β1 Ab. Representative kidney sections from untreated control and captopril-treated mice are shown. Staining in glomeruli, tubules and blood vessels was separately scored on a scale of 0–3 and summed to obtain a single staining score for each mouse. Results are shown as the mean ± SE of staining scores from 9 mice in each group (*P < 0.05).
Effect of captopril treatment on circulating levels of TGF-β1
We were concerned that ACE inhibitor treatment may decrease systemic levels of TGF-β1, which may in turn aggravate the autoimmune manifestations of lupus [39]. We therefore examined the effect of captopril treatment on serum levels of TGF-β1 (data not shown). In younger BWF1 mice, although the captopril treatment had no effect on total TGF-β1 serum levels, it significantly decreased the levels of active TGF-β1 in three independent experiments. In older BWF1 mice, captopril treatment had only a minimal (15% to 20% decrease in two experiments; P = NS) or no (in three experiments) effect on serum levels of active or total TGF-β1. This may be because TGF-β1 levels were already relatively low to begin with in these mice.
Effect of captopril treatment on spleen cell production of TGF-β1
To evaluate the effect of captopril treatment on TGF-β1 production by lymphoid cells, lupus-prone BWF1 and nonautoimmune CWF1 mice of different ages were treated with captopril for varying periods (2 to 14 weeks). At the end of treatment, their spleen cells were cultured in serum-free medium for 60 hours and supernatants were evaluated for TGF-β1 levels (data not shown). We found that the spleen cell production of TGF-β1 was slightly lower in both BWF1 and CWF1 mice in captopril-treated group than in the untreated group; none of these differences were statistically significant, however.
Spleen cell production of type 2 cytokines is decreased in captopril-treated mice
IL-4 plays an important role in the development of glomerulosclerosis in lupus-prone mice [8]. Since captopril-treated mice had a selective decrease in chronic fibrotic kidney lesions, we reasoned that captopril treatment might reduce kidney disease by reducing the production of type 2 cytokines. Indeed, IL-4 and IL-10 levels were significantly reduced in spleen cell cultures from captopril-treated BWF1 mice as compared with untreated control animals (Fig. 6). There was no statistically significant effect of captopril treatment on the levels of the type 1 cytokines, interferon-gamma (IFN-γ) or IL-2. The inhibitory effect of captopril treatment on splenic IL-4 and IL-10 production was observed in BWF1 mice of all ages (Fig. 6 and data not shown).
Fig. 6. Effect of captopril treatment on cytokine production in BWF1 mice.
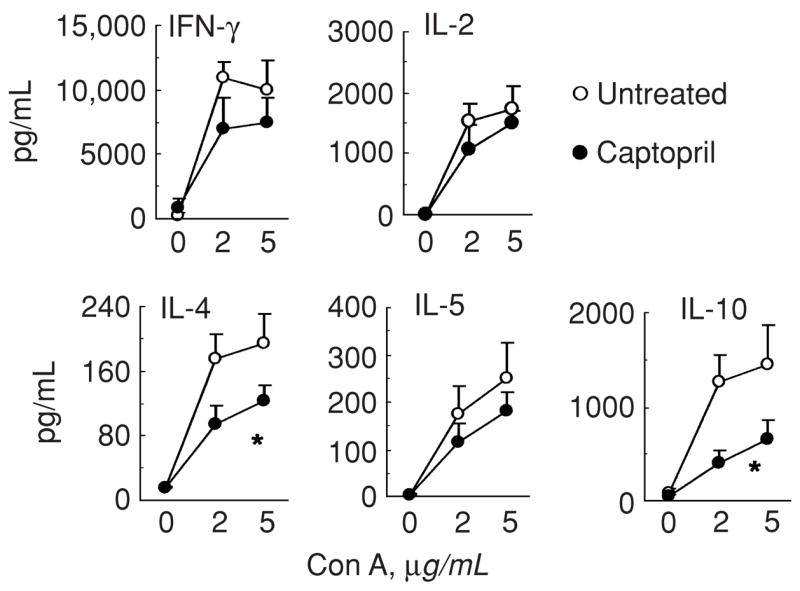
16-week-old female BWF1 mice were treated with captopril for 14 weeks. At the end of treatment, their spleen cells were cultured in serum-free medium without or with Con A for 48 to 60 hours. Culture supernatants were tested for IFN-γ, IL-2, IL-4, IL-5 and IL-10. Results from 7 captopril-treated and 5 untreated mice are shown as the mean ± SE values (*P<0.05). Similar results were obtained in four independent experiments performed in BWF1 mice of different ages, which were treated for 2 to 14 weeks.
To exclude the possibility that the decrease in type 2 cytokine production in captopril-treated mice was secondary to improvement in lupus in BWF1 mice, we treated nonautoimmune BPF1 and CWF1 mice with captopril. As shown in Figure 7, IL-4 levels were decreased in captopril-treated mice of both strains. This suggests that ACE inhibitors may intrinsically affect the production of type 2 cytokines.
Fig. 7. Effect of captopril treatment on cytokine production in nonautoimmune mice.
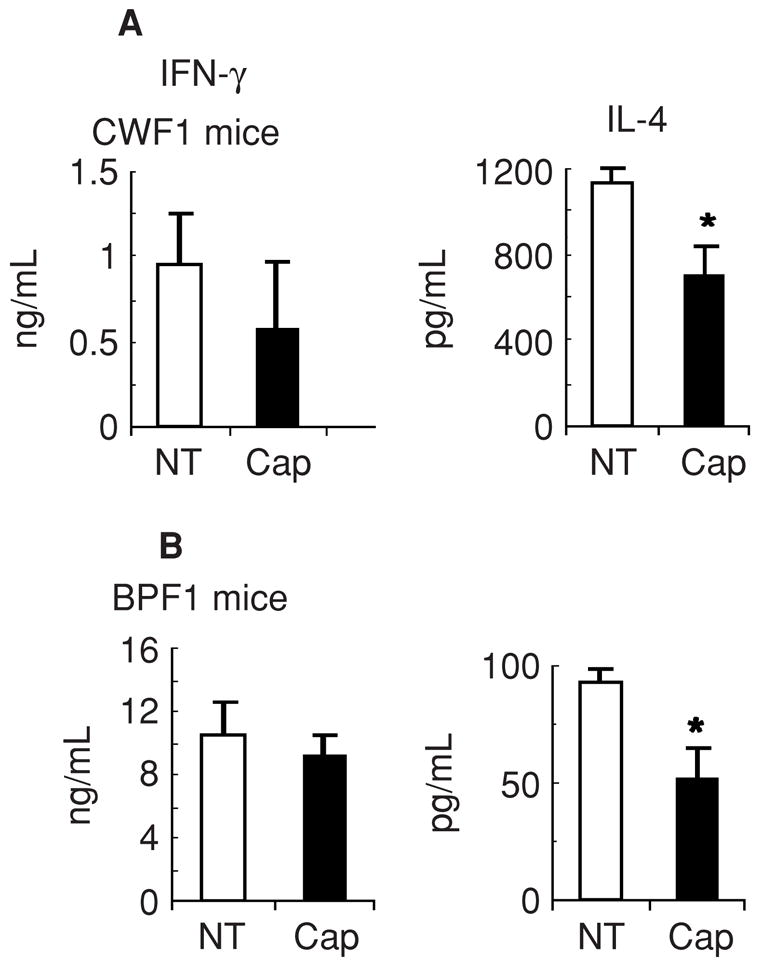
Non-autoimmune CWF1 (A) and BPF1 (B) mice were treated with captopril for 10 and 2 weeks, respectively. At the end of treatment, their spleen cells were cultured in serum free medium with Con A for 60 hours. Supernatants were tested for cytokines. Results from six each of untreated (NT) and captopril (Cap)-treated mice are expressed as the mean ± SE values. Note that IL-4 levels are lower in captopril-treated mice than in untreated control mice (*P < 0.05 for BPF1 and 0.06 for CWF1 mice). Results are representative of three independent experiments.
In vitro exposure to captopril reduces spleen cell production of IL-4, IL-10, and TGF-β
To further investigate the possibility that the captopril may have a direct modulatory effect on immune cells, we cultured spleen cells from lupus-prone BWF1 and normal CWF1 mice with increasing concentrations of captopril in vitro and determined the levels of IL-4, IL-10, IFN-γ, and active and total TGF-β1 (Fig. 8). Results show that IL-4 production was dramatically and consistently reduced in the presence of captopril in a dose-dependent manner in both lupus-prone and normal animals (Fig. 8A). IL-10 production was also consistently reduced by two- to threefold in a dose-dependent manner in both lupus-prone and normal animals (Fig. 8B). In contrast, IFN-γ levels were slightly increased or unaffected (Fig. 8C and D). Levels of total and active TGF-β1 were reduced only in captopril-exposed cultures from lupus-prone mice, but not from the control animals (Fig. 8E). These observations suggest that captopril treatment may directly affect the functions of immune cells and that IL-4 production, in particular, is profoundly affected by captopril treatment.
Fig. 8. Effect of in vitro culture with captopril on cytokine production.
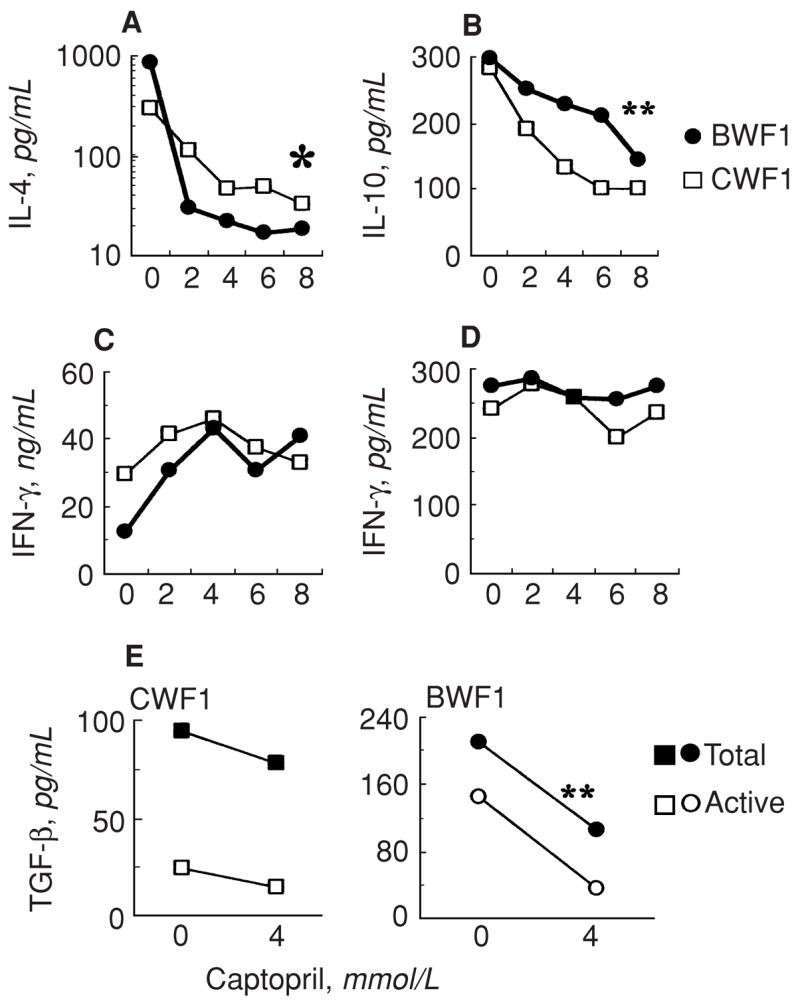
Spleen cells pooled from three each of lupus-prone BWF1 or nonautoimmune CWF1 mice were cultured in serum-free medium without or with Con A and varying concentrations of captopril. Supernatants were tested for cytokines. Results are shown as the mean triplicate values of IL-4 (A), IL-10 (B), IFN-γ (C) and TGFβ1 (E) in Con A-stimulated cultures or of IFN-γ in unstimulated cultures (D). IL-4 and IL-10 levels were low to undetectable in unstimulated cultures. Note that IL-4 levels were 9–44-fold lower (*) and IL-10 levels were 2–3-fold lower (**) in captopril-exposed cultures than in control cultures in both BWF1 and CWF1 mice; and total and active TGF-β1 levels were reduced by about 2-fold in BWF1 mice only (**). Results represent three independent experiments.
DISCUSSION
In this article, we describe the effects that captopril treatment has on the development of lupus nephritis in murine models of SLE. Captopril treatment was found to delay the onset of proteinuria, and retard the progression, and even reverse advanced renal disease by reducing the degree of glomerulosclerosis and renal fibrosis. The beneficial effect of captopril treatment is associated with a previously unreported cytokine modulatory effect of captopril (i.e., increasing captopril dosage is correlated with a reduction in the production of IL-4 and IL-10 by spleen cells). This effect was detected in both lupus-prone strains and normal stains. Additionally, captopril treatment differentially reduced the renal expression of certain TGF-β isoforms in specific locations in the kidneys of lupus-prone mice. Such an effect of ACE inhibitors on TGF-β isoform expression has not been reported previously to the best of our knowledge.
Upon signaling through the angiotensin II receptor, angiotensin II stimulates fibroblasts [10, 25], suggesting a possible role of angiotensin II in tissue fibrosis, including glomerulosclerosis and renal tubulointerstitial fibrosis. Consistent with this role of angiotensin II, germline deletion of angiotensin II or treatment with angiotensin II inhibitors reduces or even reverses the development of glomerulosclerosis in models of primary renal diseases [5, 9, 12–14] and in autoimmune diseases such as lupus [16–22] (Figs. 1 and 2).
The mechanisms by which angiotensin II inhibitors exert antifibrotic and renoprotective effect in glomerulonephritis and other models of renal injury are not well understood. It is known that angiotensin II stimulates TGF-β production [24, 25] and its conversion from the latent to a bioactive form [11]. Moreover, angiotensin II–induced extracellular matrix expression is blocked by anti-TGF-β antibody or TGF-β antisense oligonucleotides [24, 25]. Thus, angiotensin II–mediated stimulation of TGF-β production may play an important role in the development of glomerulosclerosis and renal fibrosis. Treatment with angiotensin II inhibitors may halt this process by restricting the production of TGF-β. In lupus mice, however, captopril treatment had only a modest effect on total or systemic TGF-β protein expression; a small decrease in TGF-β was only detected in lupus-prone mice when treatment was initiated at an early age but was not detected if the treatment was delayed until after the mice exhibited full-blown nephritis (Fig. 5, and data not shown). One possibility is that the effect of captopril on TGF-β may not be apparent in lupus-prone mice as these mice undergo spontaneous changes in TGF-β expression [33] (manuscript in preparation). Alternatively, the effect of ACE inhibitors on TGF-β expression may be restricted to certain TGF-β isoforms and may occur only in certain locations in the target organ (i.e., in the kidneys of affected mice). Indeed, we found that captopril treatment markedly reduced TGF-β1 expression in the glomeruli and TGF-β2 expression in the periglomerular region, but only modestly decreased TGF-β1 expression in infiltrating cells, and had little or no effect on TGF-β2 expression in isolated tubules. TGF-β3 isoform expression was generally unaffected by captopril treatment (Fig. 4). Such differential effects suggest that the three TGF-β isoforms may play unique and non-overlapping roles in the development of lupus nephritis. These observations are in agreement with genetic data indicating that in animal knockout models for the individual TGF-β isoforms, differential phenotypes are seen [40], suggesting that the three TGF-β isoforms have different functions in vivo.
Interestingly, TGF-β1 mRNA expression was detected mostly in glomeruli and lymphoid infiltrates in the kidneys of BWF1 mice (Fig. 4A), whereas TGF-β1 protein was found to localize primarily in tubules (Fig. 5) except in early stages of disease when TGF-β1 protein was also detected in glomeruli (data not shown). The reason for this discrepancy is unclear. One possibility is that TGF-β1 is mainly produced in glomeruli and lymphoid infiltrates; the secreted TGF-β1, however, may drain and localize in tubules where we find its maximal staining.
We have recently described that TGF-β–producing T cells derived from normal animals inhibit anti-DNA antibody production [33]. The production and/or induction of such regulatory T cells are defective in lupus mice [33]. Additionally, TGF-β1–deficient T cells are spontaneously activated in vivo [41], which causes severe multiorgan inflammatory disease in TGF-β1 knockout mice (reviewed in [40]). We were concerned that if treatment with ACE inhibitors reduces TGF-β production in the lymphoid and other tissues, it might exacerbate autoantibody production and promote inflammatory disease. Contrary to our initial expectations, however, captopril treatment had only a minimal or no effect on circulating levels or spleen cell production of TGFβ (data not shown). Moreover, captopril treatment did not significantly exacerbate autoantibody production in most lupus-prone and normal mice (Fig. 3, and data not shown). Drug treatment also did not induce any obvious inflammatory lesions in lupus-prone (BWF1 and MRL-lpr/lpr) and normal strains (CWF1 and BPF1 mice).
As mentioned above, captopril treatment was not always associated with a significant inhibitory effect on renal TGF-β expression. In some experiments, improvement in glomerulosclerosis and renal fibrosis after captopril treatment occurred in the absence of any decrease in TGF-β levels in the experimental animals. This suggests that the protective effects of ACE inhibitors in lupus nephritis might be mediated, at least in part, through other mechanisms. In this regard, we have recently found that the cytokine, IL-4, and STAT6, a transcription factor that mediates the production and functions of IL-4, play important roles in the development of glomerulosclerosis in a lupus-prone strain of mice [8]. Therefore, we investigated the effect of captopril treatment on the production of type 2 cytokines in the experiments reported here. We found that almost all mice treated with captopril exhibited a decrease in IL-4 production by spleen cells (Figs. 6 and 7). Additionally, captopril-treated mice exhibit a reduction in spleen cell production of IL-10 (Figs. 6 and 7). It has been reported previously that IL-10 production is increased in peripheral blood cell cultures from patients with SLE and in serum of BWF1 mice [42]. Furthermore, IL-10 exacerbates and anti-IL-10 antibody ameliorates disease in certain mouse models of lupus [43, 44]. Treatment with an anti-IL-10 antibody has also been shown to improve disease in patients with SLE [45]. Thus, reduction in IL-10 production may be partly responsible for the beneficial effects on renal disease observed here in captopril-treated lupus mice.
The mechanisms by which decreases in IL-4 and IL-10 production by the immune system may contribute to renal disease improvement in captopril-treated lupus mice are not clear. IL-4 is known to promote fibroblast proliferation, collagen gene expression, and collagen synthesis [46–48]. Another type 2 cytokine, IL-13, which is also significantly increased in lupus-prone mice as compared with nonautoimmune mice (our unpublished data), can increase type 1 procollagen synthesis in vitro [49]. Type 2 cytokines have been implicated in the development of lung fibrosis [6, 7, 49, 50]. Furthermore, IL-4 may serve as a growth factor for cells that secrete TGF-β [51], which, in turn, may lead to tissue fibrosis [52]. Significantly, IL-4 transgenic mice exhibit increased renal TGFβ expression and develop glomerulosclerosis, independent of Ig deposition [52]. IL-10 may also promote tissue fibrosis by suppressing the action or expression of type 1 cytokines and hence tip the balance in favor of type 2 cytokine responses [6]. It remains to be determined how decreased IL-4 and IL-10 production modulates the development of renal disease in captopril-treated mice. In future experiments, we hope to determine the effect of captopril treatment on the expression of these cytokines and their receptors in the kidneys, and investigate whether type 2 cytokines, in general, directly affect renal fibrogenesis or modulate the production of other profibrotic cytokines and growth factors.
Our observations do not exclude the possibility that the improvement in renal disease induced by ACE inhibitors may reflect their hemodynamic effects. Interestingly, however, emerging evidence suggests a link between the cytokines, IL-4 and TGF-β, and blood pressure. For example, IL-4 blockade can inhibit the increase in mean arterial blood pressure in lupus-prone BWF1 mice [53], and overexpression of TGF-β1 protein and mRNA has been found in patients with essential hypertension (reviewed in [54]). Moreover, an association between certain polymorphisms in the TGF-β1 gene (e.g., the Arg25 allele) and higher blood pressure has been reported (reviewed in [54]). Thus, it is possible that the cytokine, hemodynamic, and therapeutic effects of ACE inhibitors may all be interrelated in immune-mediated kidney diseases.
At least three potential mechanisms may explain the effect of captopril on the cytokine profile that we observed. First, the changes in cytokine pattern may be secondary to improvement in disease in lupus mice. This, however, is unlikely since treatment of normal animals also resulted in a similar cytokine profile (Fig. 7). Second, the immunologic effects of captopril could be related to the sulfhydril group on the compound [22]. Recent reports in primary renal diseases, however, indicate that angiotensin II receptor blockers and ACE inhibitors that lack a sulfhydril group also inhibit renal disease through their effects on growth factors [5, 9, 14, 24], suggesting a direct role of angiotensin II inhibition in nephritis. Third, angiotensin II inhibitors may directly influence lymphoid cells via their effects on angiotensin II, which may influence immune responses [30, 31]. Evidence suggests that mononuclear leukocytes synthesize angiotensinogen and upon activation contain large amounts of angiotensin II [26, 27]. In addition, it is known that macrophages express angiotensin receptors [29]. Finally, angiotensin II inhibitors may directly interfere with T-cell activation and apoptosis signals [30].
CONCLUSION
We have observed that captopril treatment inhibits the production of type 2 cytokines in the lymphoid system, and differentially affects TGF-β isoform expression in the kidneys of lupus mice. Since type 2 cytokines promote TGF-β production [51] and exacerbate lupus glomerulosclerosis [8, 55], the decreased IL-4 and IL-10 production detected here may be related to the renoprotective effects of ACE inhibitors in lupus nephritis. Our future investigations will focus on how ACE inhibitors affect lymphoid cell functions, and how their effect on cytokine production contributes to the reduction in chronic renal lesions. We propose that angiotensin II may act as a bridge in the vascular/angiotensin-immune system axis. Treatment with angiotensin II inhibitors may modulate this axis and thus may retard the progression and eventual severity of immune-mediated renal and vascular diseases. In conclusion, ACE inhibitors may act both as systemic immunomodulators of the immune system, having a broad effect on immunity and autoimmunity, and as specific inhibitors of renal TGF-β expression.
Acknowledgments
This work was supported in part by grants from the National Institutes of Health [Pilot and Feasibility grant from the Rheumatic Disease Core Center (P30 AR47363, RO1 AR47322, and RO1 AR050797)] and the Cincinnati Kidney Foundation of greater Cincinnati. D.A.A. was supported by the Universidade Federal de Mato Grosso, Cuiaba, Brazil. We sincerely thank Fred Finkelman for insightful discussions, John Lorenz of the Mouse Physiology Core Laboratory, University of Cincinnati, for assistance with blood pressure measurements, Harold Moses for providing riboprobes for the three TGF-β isoforms, Pam Groen, Srinivasa Kakumanu, Kathy Saalfeld, and Frost Smith for technical help, and Chris Woods for photography.
References
- 1.Hahn BH. Antibodies to DNA. N Engl J Med. 1998;338:1359–1368. doi: 10.1056/NEJM199805073381906. [DOI] [PubMed] [Google Scholar]
- 2.Grande JP. Mechanisms of progression of renal damage in lupus nephritis: Pathogenesis of renal scarring. Lupus. 1998;7:604–610. doi: 10.1191/096120398678920721. [DOI] [PubMed] [Google Scholar]
- 3.Ignotz RA, Massague J. Transforming growth factor-β stimulates the expression of fibronectin and collagen and their incorporation into extracellular matrix. J Biol Chem. 1986;261:4337–4345. [PubMed] [Google Scholar]
- 4.Sanderson N, Factor V, Nagy P, et al. Hepatic expression of mature transforming growth factor β1 in transgenic mice results in multiple tissue lesions. Proc Natl Acad Sci USA. 1995;92:2572–2576. doi: 10.1073/pnas.92.7.2572. [DOI] [PMC free article] [PubMed] [Google Scholar]
- 5.Peters H, Border WA, Noble NA. Targeting TGF-β overexpression in renal disease: Maximizing the antifibrotic action of angiotensin II blockade. Kidney Int. 1998;54:1570–1580. doi: 10.1046/j.1523-1755.1998.00164.x. [DOI] [PubMed] [Google Scholar]
- 6.Sime PJ, O’Reilly KM. Fibrosis of the lung and other tissues: New concepts in pathogenesis and treatment. Clin Immunol. 2001;99:308–319. doi: 10.1006/clim.2001.5008. [DOI] [PubMed] [Google Scholar]
- 7.Lukacs NW, Hogaboam C, Chensue SW, et al. Type 1/type 2 cytokine paradigm and the progression of pulmonary fibrosis. Chest. 2001;120:5S–8S. doi: 10.1378/chest.120.1_suppl.s5. [DOI] [PubMed] [Google Scholar]
- 8.Singh RR, Saxena V, Zang S, et al. Differential contribution of IL-4 and STAT6 vs STAT4 to the development of lupus nephritis. J Immunol. 2003;170:4818–4825. doi: 10.4049/jimmunol.170.9.4818. [DOI] [PMC free article] [PubMed] [Google Scholar]
- 9.Taal MW, Brenner BM. Renoprotective benefits of RAS inhibition: From ACEI to angiotensin II antagonists. Kidney Int. 2000;57:1803–1817. doi: 10.1046/j.1523-1755.2000.00031.x. [DOI] [PubMed] [Google Scholar]
- 10.Klahr S, Morrissey JJ. Angiotensin II and gene expression in the kidney. Am J Kidney Dis. 1998;31:171–176. doi: 10.1053/ajkd.1998.v31.pm9428470. [DOI] [PubMed] [Google Scholar]
- 11.Klahr S, Morrissey JJ. The role of vasoactive compounds, growth factors and cytokines in the progression of renal disease. Kidney Int. 2000;57(Suppl 75):S7–S14. [PubMed] [Google Scholar]
- 12.Hisada Y, Sugaya T, Yamanouchi M, et al. Angiotensin II plays a pathogenic role in immune-mediated renal injury in mice. J Clin Invest. 1999;103:627–635. doi: 10.1172/JCI2454. [DOI] [PMC free article] [PubMed] [Google Scholar]
- 13.Satoh M, Kashihara N, Yamasaki Y, et al. Renal interstitial fibrosis is reduced in angiotensin II type 1a receptor-deficient mice. J Am Soc Nephrol. 2001;12:317–325. doi: 10.1681/ASN.V122317. [DOI] [PubMed] [Google Scholar]
- 14.Nakamura T, Obata J, Kimura H, et al. Blocking angiotensin II ameliorates proteinuria and glomerular lesions in progressive mesangioproliferative glomerulonephritis. Kidney Int. 1999;55:877–889. doi: 10.1046/j.1523-1755.1999.055003877.x. [DOI] [PubMed] [Google Scholar]
- 15.Akai Y, Sato H, Iwano M, et al. Association of an insertion polymorphism of angiotensin-converting enzyme gene with the activity of lupus nephritis. Clin Nephrol. 1999;51:141–146. [PubMed] [Google Scholar]
- 16.Herlitz H, Edeno C, Mulec H, et al. Captopril treatment of hypertension and renal failure in systemic lupus erythematosus. Nephron. 1984;38:235–256. doi: 10.1159/000183318. [DOI] [PubMed] [Google Scholar]
- 17.Ortega G, Molina Boix M, Vidal JB, et al. Treatment of arterial hypertension with captopril in lupus nephropathy. Ann Med Intern. 1992;9:72–75. [PubMed] [Google Scholar]
- 18.Tareeva IE, Shvetsov MI, Kutyrina IM, Gerasimenko OI. Hemodynamic mechanisms of lupus nephritis progression. Ter Arkh. 1998;70:11–14. [PubMed] [Google Scholar]
- 19.Shapira Y, Mor F, Friedler A, et al. Antiproteinuric effect of captopril in a patient with lupus nephritis and intractable nephrotic syndrome. Ann Rheum Dis. 1990;49:725–727. doi: 10.1136/ard.49.9.725. [DOI] [PMC free article] [PubMed] [Google Scholar]
- 20.Herlitz H, Svalander C, Tarkowski A, Westberg G. Influence of antihypertensive treatment on renal and extrarenal lupus manifestations in MRL/lpr mice. Scand J Urol Nephrol. 1988;108(Suppl):65–70. [PubMed] [Google Scholar]
- 21.Herlitz H, Tarkowski A, Svalander C, et al. Beneficial effect of captopril on systemic lupus erythematosus-like disease in MRL/lpr mice. Int Arch Allergy Appl Immunol. 1988;85:272–277. doi: 10.1159/000234517. [DOI] [PubMed] [Google Scholar]
- 22.Tarkowski A, Carlsten H, Herlitz H, Westberg G. Differential effects of captopril and enalapril, two angiotensin converting enzyme inhibitors, on immune reactivity in experimental lupus disease. Agents Actions. 1990;31:96–101. doi: 10.1007/BF02003227. [DOI] [PubMed] [Google Scholar]
- 23.Ruiz-Ortega M, Gonzalez S, Seron D, et al. ACE inhibition reduces proteinuria, glomerular lesions and extracellular matrix production in a normotensive rat model of immune complex nephritis. Kidney Int. 1995;48:1778–1791. doi: 10.1038/ki.1995.476. [DOI] [PubMed] [Google Scholar]
- 24.Wolf G. Link between angiotensin II and TGF-β in the kidney. Miner Electrolyte Metab. 1998;24:174–180. doi: 10.1159/000057367. [DOI] [PubMed] [Google Scholar]
- 25.Kagami S, Border WA, Miller DE, Noble NA. Angiotensin II stimulates extracellular matrix protein synthesis through induction of transforming growth factor-beta expression in rat glomerular mesangial cells. J Clin Invest. 1994;93:2431–2437. doi: 10.1172/JCI117251. [DOI] [PMC free article] [PubMed] [Google Scholar]
- 26.Gomez RA, Norling LL, Wilfong N, et al. Leukocytes synthesize angiotensinogen. Hypertension. 1993;21:470–475. doi: 10.1161/01.hyp.21.4.470. [DOI] [PubMed] [Google Scholar]
- 27.Kitazono T, Padgett RC, Armstrong ML, et al. Evidence that angiotensin II is present in human monocytes. Circulation. 1995;91:1129–1134. doi: 10.1161/01.cir.91.4.1129. [DOI] [PubMed] [Google Scholar]
- 28.Potter DD, Sobey CG, Tompkins PK, et al. Evidence that macrophages in atherosclerotic lesions contain angiotensin II. Circulation. 1998;98:800–807. doi: 10.1161/01.cir.98.8.800. [DOI] [PubMed] [Google Scholar]
- 29.Thomas DW, Hoffman MD. Identification of macrophage receptors for angiotensin: A potential role in antigen uptake for T lymphocyte responses? J Immunol. 1984;132:2807–2812. [PubMed] [Google Scholar]
- 30.Odaka C, Mizuochi T. Angiotensin-converting enzyme inhibitor captopril prevents activation-induced apoptosis by interfering with T cell activation signals. Clin Exp Immunol. 2000;121:515–522. doi: 10.1046/j.1365-2249.2000.01323.x. [DOI] [PMC free article] [PubMed] [Google Scholar]
- 31.Krivosikova Z, Dusinska M, Spustova V, et al. DNA damage of lymphocytes in experimental chronic renal failure: beneficial effects of losartan. Kidney Int. 2001;59(Suppl 78):S212–S215. doi: 10.1046/j.1523-1755.2001.59780212.x. [DOI] [PubMed] [Google Scholar]
- 32.Fan GC, Singh RR. Vaccination with minigenes encoding VH-derived major histocompatibility class I-binding epitopes activates cytotoxic T cells that ablate autoantibody-producing B cells and inhibit lupus. J Exp Med. 2002;196:731–741. doi: 10.1084/jem.20020223. [DOI] [PMC free article] [PubMed] [Google Scholar]
- 33.Singh RR, Ebling FM, Albuquerque DA, et al. Induction of autoantibody production is limited in nonautoimmune mice. J Immunol. 2002;169:587–594. doi: 10.4049/jimmunol.169.1.587. [DOI] [PubMed] [Google Scholar]
- 34.Singh RR, Hahn BH, Sercarz EE. Neonatal peptide exposure can prime T cells, and upon subsequent immunization induce their immune deviation: Implications for antibody-vs T cell-mediated autoimmunity. J Exp Med. 1996;183:1613–1622. doi: 10.1084/jem.183.4.1613. [DOI] [PMC free article] [PubMed] [Google Scholar]
- 35.Derynck R, Jarrett JA, Chen EY, Goeddel DV. The murine transforming growth factor-beta precursor. J Biol Chem. 1986;261:4377–4379. [PubMed] [Google Scholar]
- 36.Miller DA, Lee A, Pelton RW, et al. Murine transforming growth factor-beta 2 cDNA sequence and expression in adult tissues and embryos. Mol Endocrinol. 1989;3:1108–1114. doi: 10.1210/mend-3-7-1108. [DOI] [PubMed] [Google Scholar]
- 37.Miller DA, Lee A, Matsui Y, et al. Complementary DNA cloning of the murine transforming growth factor-beta 3 (TGF beta 3) precursor and the comparative expression of TGF beta 3 and TGF beta 1 messenger RNA in murine embryos and adult tissues. Mol Endocrinol. 1989;3:1926–1934. doi: 10.1210/mend-3-12-1926. [DOI] [PubMed] [Google Scholar]
- 38.Miyazono K, ten Dijke P, Heldin CH. TGF-beta signaling by Smad proteins. Adv Immunol. 2000;75:115–157. doi: 10.1016/s0065-2776(00)75003-6. [DOI] [PubMed] [Google Scholar]
- 39.Prud’homme GJ, Piccirillo CA. The inhibitory effects of transforming growth factor-beta-1 (TGF-β1) in autoimmune disease. J Autoimmun. 2000;14:23–42. doi: 10.1006/jaut.1999.0339. [DOI] [PubMed] [Google Scholar]
- 40.Doetschman T. Interpretation of phenotype in genetically engineered mice. Lab Animal Science. 1999;49:137–143. [PubMed] [Google Scholar]
- 41.Bommireddy R, Saxena V, Ormsby I, et al. Transforming growth factor β1 regulates lymphocyte homeostasis by preventing activation and subsequent apoptosis of peripheral lymphocytes. J Immunol. 2003;170:4612–4622. doi: 10.4049/jimmunol.170.9.4612. [DOI] [PubMed] [Google Scholar]
- 42.Houssiau FA, Lefebvre C, Vanden Berghe M, et al. Serum interleukin 10 titers in systemic lupus erythematosus reflect disease activity. Lupus. 1995;4:393–395. doi: 10.1177/096120339500400510. [DOI] [PubMed] [Google Scholar]
- 43.Ishida H, Muchamuel T, Sakaguchi S, et al. Continuous administration of anti-interleukin 10 antibodies delays onset of autoimmunity in NZB/W F1 mice. J Exp Med. 1994;179:305–310. doi: 10.1084/jem.179.1.305. [DOI] [PMC free article] [PubMed] [Google Scholar]
- 44.Llorente L, Zou W, Levy Y, et al. Role of interleukin 10 in the B lymphocyte hyperactivity and autoantibody production of human systemic lupus erythematosus. J Exp Med. 1995;181:839–844. doi: 10.1084/jem.181.3.839. [DOI] [PMC free article] [PubMed] [Google Scholar]
- 45.Llorente L, Richaud-Patin Y, Garcia-Padilla C, et al. Clinical and biologic effects of anti-interleukin-10 monoclonal antibody administration in systemic lupus erythematosus. Arthritis Rheum. 2000;43:1790–1800. doi: 10.1002/1529-0131(200008)43:8<1790::AID-ANR15>3.0.CO;2-2. [DOI] [PubMed] [Google Scholar]
- 46.Gillery P, Fertin C, Nicolas JF, et al. Interleukin-4 stimulates collagen gene expression in human fibroblast monolayer cultures. Potential role in fibrosis. FEBS Lett. 1992;302:231–234. doi: 10.1016/0014-5793(92)80448-p. [DOI] [PubMed] [Google Scholar]
- 47.Postlethwaite AE, Holness MA, Katai H, Raghow H. Human fibroblasts synthesize elevated levels of extracellular matrix proteins in response to interleukin-4. J Clin Invest. 1992;90:1479–1485. doi: 10.1172/JCI116015. [DOI] [PMC free article] [PubMed] [Google Scholar]
- 48.Sempowski GD, Beckmann MP, Derdak S, Phipps RP. Subsets of murine lung fibroblasts express membrane-bound and soluble IL-4 receptors. Role of IL-4 in enhancing fibroblast proliferation and collagen synthesis. J Immunol. 1994;152:3606–3614. [PubMed] [Google Scholar]
- 49.Lee CG, Homer RJ, Zhu Z, et al. Interleukin-13 induces tissue fibrosis by selectively stimulating and activating transforming growth factor beta(1) J Exp Med. 2001;194:809–821. doi: 10.1084/jem.194.6.809. [DOI] [PMC free article] [PubMed] [Google Scholar]
- 50.Buttner C, Skupin A, Reimann T, et al. Local production of interleukin-4 during radiation-induced pneumonitis and pulmonary fibrosis in rats: Macrophages as a prominent source of interleukin-4. Am J Respir Cell Mol Biol. 1997;17:315–325. doi: 10.1165/ajrcmb.17.3.2279. [DOI] [PubMed] [Google Scholar]
- 51.Seder RA, Marth T, Sieve MC, et al. Factors involved in the differentiation of TGF-beta-producing cells from naïve CD4+ T cells: IL-4 and IFN-γ have opposing effects, while TGF-β positively regulates its own production. J Immunol. 1998;160:5719–5728. [PubMed] [Google Scholar]
- 52.Ruger BM, Erb KJ, He Y, et al. Interleukin-4 transgenic mice develop glomerulosclerosis independent of immunoglobulin deposition. Eur J Immunol. 2000;30:2698–2703. doi: 10.1002/1521-4141(200009)30:9<2698::AID-IMMU2698>3.0.CO;2-1. [DOI] [PubMed] [Google Scholar]
- 53.van Heuven-Nolsen D, De Kimpe SJ, Muis T, et al. Opposing role of interferon-gamma and interleukin-4 on the regulation of blood pressure in mice. Biochem Biophys Res Commun. 1999;254:816–820. doi: 10.1006/bbrc.1998.8742. [DOI] [PubMed] [Google Scholar]
- 54.Lijnen PJ, Petrov VV, Fagard RH. Association between transforming growth factor-β and hypertension. Am J Hypertens. 2003;16:604–611. doi: 10.1016/s0895-7061(03)00847-1. [DOI] [PubMed] [Google Scholar]
- 55.Singh RR. IL-4 and many roads to lupus-like autoimmunity [editorial] Clin Immunol. 2003;108:73–79. doi: 10.1016/s1521-6616(03)00145-1. [DOI] [PubMed] [Google Scholar]