Abstract
It is well accepted that atherosclerosis initiation and progression correlate positively with low and oscillating flow wall shear stresses (FSS). However, this mechanism cannot explain why advanced plaques continue to grow under elevated FSS conditions. In vivo magnetic resonance imaging (MRI)-based 2D/3D multi-component models with fluid-structure interactions (FSI, 3D only) for human carotid atherosclerotic plaques were introduced to quantify correlations between plaque progression measured by wall thickness increase (WTI) and plaque wall (structure) stress (PWS) conditions. A histologically validated multi-contrast MRI protocol was used to acquire multi-year in vivo MRI images. Our results using 2D models (200–700 data points/patient) indicated that 18 out of 21 patients studied showed significant negative correlation between WTI and PWS at time 2 (T2). The 95% confidence interval for the Pearson correlation coefficient is (−0.443, −0.246), p < 0.0001. Our 3D FSI model supported the 2D correlation results and further indicated that combining both plaque structure stress and flow shear stress gave better approximation results (PWS, T2: R2 = 0.279; FSS, T1: R2 = 0.276; Combining both: R2 = 0.637). These pilot studies suggest that both lower PWS and lower FSS may contribute to continued plaque progression and should be taken into consideration in future investigations of diseases related to atherosclerosis.
Keywords: Plaque progression, blood flow, atherosclerosis, plaque rupture, fluid-structure interaction
1. Introduction
Atherosclerotic plaque progression are believed to be related to multiple factors such as mechanical forces, plaque morphology and inflammation, vessel remodeling, and blood conditions, chemical environment, and lumen surface condition (Friedman, 1987, 1993; Giddens et al., 1993; Ku, 1997; Ku et al., 1985; Naghavi et al., 2003a, 2003b; Ravn and Falk, 1999; Ross, 1993). The role of mechanical factors in plaque progression using sequential patient tracking data, however, has not been well documented. The governing mechanisms are not well understood. The difficulty is partially due to the fact that atherosclerosis is a slow process and patient-specific data showing plaque progression takes a long time to acquire. It has been well accepted that low and oscillating flow shear stresses correlate positively with intimal thickening and atherosclerosis progression (Friedman, 1987, 1993; Giddens et al., 1993; Ku et al., 1985, 1992). This “low shear stress” (LSS) hypothesis has influenced the atherogenesis research field considerably in recent years. However, as plaque progression continues, stenosis becomes more severe and lumen narrowing will eventually occur which are often associated with elevated high shear stress conditions (Tang et al., 2001, 2004a, 2005b). The LSS hypothesis cannot explain why intermediate and advanced plaques continue to grow under elevated high shear stress conditions. Several research groups reported findings controversial to the LSS hypothesis and suggested the growing importance of searching for other mechanical factors such as plaque wall (structure) stresses (PWS) and new hypotheses for mechanisms governing plaque progression process (Joshi et al., 2004; Wentzel et al., 2003, 2005). The purpose of this investigation is to quantify possible correlation between human carotid atherosclerotic plaque progression and PWS conditions by using 2D and 3D multi-component plaque models based on in vivo magnetic resonance images (MRI) data taken from patients at multiple time points. MRI-based atherosclerotic plaque models have been introduced by several groups (Holzapfel, 2002; Huang et al., 2001; Kaazempur-Mofrad et al., 2002; Long et al., 1997, 2000; Steinman et al, 2002) and our group (Tang et al., 2004b, 2005b). In this paper, both 2D and 3D models were solved by a commercial finite element package ADINA (ADINA R & D, Inc., Watertown, MA) to obtain plaque stress/strain conditions (Bathe, 1996; Bathe, 2002). Linear regression analysis was performed to quantify correlations between plaque maximum principal stress (Stress-P1) and plaque progression measured by wall thickness increase (WTI). Statistically significant negative correlations were found in 18 out of 21 patients studied.
2. Methods
2.1 In vivo Serial MRI Data Acquisition and Segmentation
To quantify possible correlations between plaque progression and selected mechanical factors, the first step was to scan patients with atherosclerotic plaques multiple times (serial MRI) to obtain plaque progression data. Serial MRI data of carotid atherosclerotic plaques from twenty-one (numbered as Y1–Y21; age: 54–84, mean: 70.6; 19 males, 2 females) were acquired by the University of Washington (UW) group using protocols approved by the University of Washington Institutional Review Board with informed consent obtained. Scan time intervals were 18 months for Y1–Y20 and 10 months for Y21. MRI scans were conducted on a GE SIGNA 1.5-T whole body scanner using an established protocol outlined in the paper by Yuan and Kerwin (Yuan and Kerwin, 2004). A custom-designed carotid phased-array surface coil was used for all scans. Multi-contrast images in T1, T2, proton density(PD), time-of-flight (TOF), and contrast-enhanced (CE) T1 weighted images of atherosclerotic plaques were generated to characterize plaque tissue composition and luminal and vessel wall morphology (Cai et al., 2002; Yuan and Kerwin, 2004; Yuan et al., 2001a, 2001b). The multi-contrast MRI techniques for human carotid imaging have been used and validated by histological data by Yuan and his group with several publications (Cai et al., 2002; Kerwin et al., 2003; Liu et al., 2006; Yuan and Kerwin, 2004; Yuan et al., 2001a, 2001b). A custom-designed computer package CASCADE (Computer-Aided System for Cardiovascular Disease Evaluation) developed by the Vascular Imaging Laboratory (VIL) at the University of Washington (UW) was used to perform image analysis and segmentation (Kerwin et al., 2003). Upon completion of a review, an extensive report was generated and segmented contour lines for different plaque components for each slice were stored for 2D/3D computational model reconstructions. Fig. 1 shows 10 (selected from 24) MRI slices (T1W) obtained from a human carotid plaque sample, the segmented contour plots, and the re-constructed 3D geometry. Figure 2 gives a sample plaque re-constructed from serial MRI data showing plaque progression.
Figure 1.
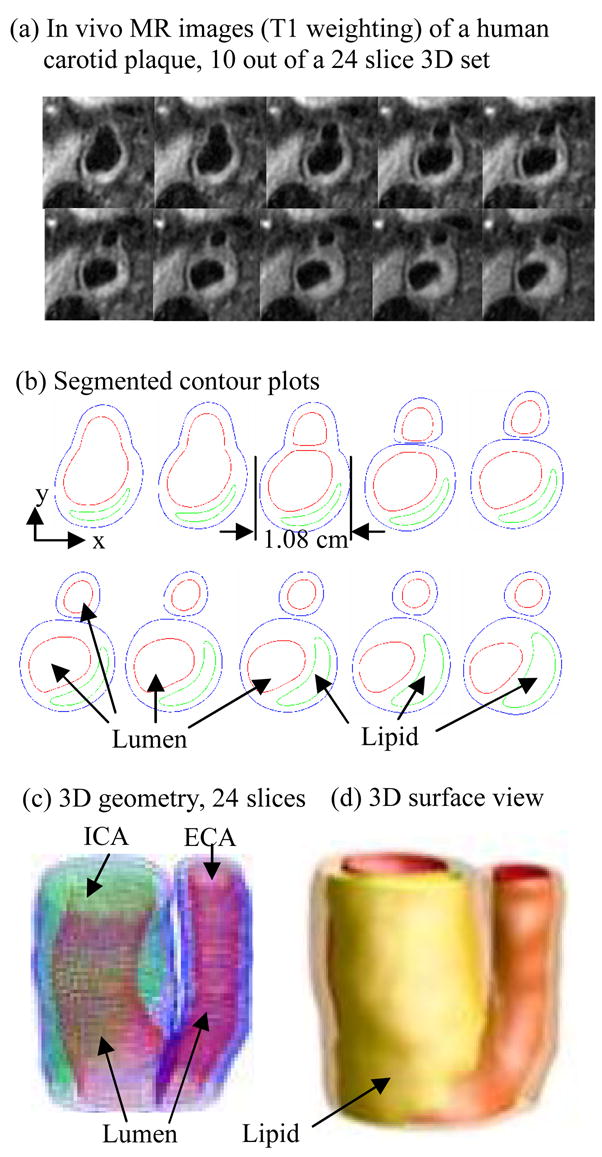
In vivo 3D MRI images of a human carotid plaque and 3D reconstruction. (a) 10 (out of 24) MRI (T1) slices; (b) segmented contour plots; (c) re-constructed 3D plaque geometry
Figure 2.
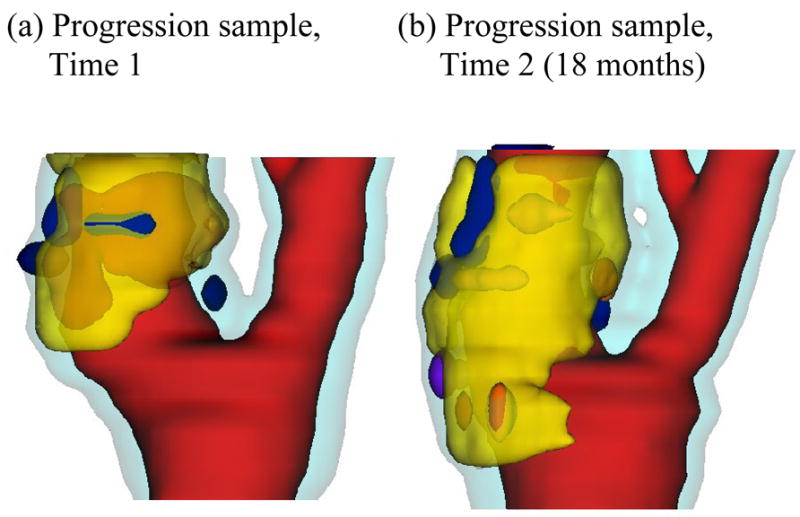
A plaque sample showing progression. Red: lumen; Yellow: necrotic core; Dark blue: calcification; Light blue: vessel outer wall.
2.2 In Vivo MRI-Based Multi-Component Plaque Models
2D multi-component models were used in this paper because they were less labor-intensive and the stress results provided reasonable accuracy for our correlation analysis. All segmented 2D slices were read into ADINA input file, pixel by pixel. To get a starting geometry from the in vivo MRI data, the original in vivo geometry was reduced by 8–10% before the data was read into ADINA so that the actual in vivo shape could be recovered when initial axial pre-stretch and pressurization were applied. The reduction rate varied from patient to patient and was numerically determined for an optimal match with in vivo shape after pressurization. The 2D geometry was then divided into many "areas" so that mesh could be made to curve-fit plaque components in the vessel wall. Computational meshes were made under ADINA computing environment. Finer mesh was used at the thin cap and other places as needed. A 3D FSI model was developed using Y21 data for validation purpose and the 3D correlation results showed good agreement with 2D models (details given in 3.2).
For 2D and 3D solid models, both artery wall (normal tissue) and plaque components (calcification, lipid core, and others) were assumed to be hyperelastic, isotropic, incompressible and homogeneous. The nonlinear modified Mooney-Rivlin model was used to describe the material properties of the vessel wall and plaque components (Bathe, 2002; Huang et al., 2001; Tang et al., 2004b). The strain energy function is given by,
| (1) |
| (2) |
where I1 and I2 are the first and second strain invariants, C = [Cij] = XTX is the right Cauchy-Green deformation tensor, X = [Xij] = [∂xi/∂aj], (xi) is current position, (ai) is original position, ci and Di are material parameters chosen to match experimental measurements and current literatures (Humphrey, 2002; Kobayashi et al., 2003). For the 3D FSI model, the flow was assumed to be laminar, Newtonian, viscous and incompressible. The incompressible Navier-Stokes equations with arbitrary Lagrangian-Eulerian (ALE) formulation were used as the governing equations. No-slip conditions, natural traction equilibrium boundary conditions and continuity of displacement were assumed on all interfaces between all components and the interface between solid and fluid. Inlet and outlet were fixed in longitudinal (axial) direction, but allowed to expand/contract with flow otherwise. The complete FSI model is given below:
| (3) |
| (4) |
| (5) |
| (6) |
| (7) |
| (8) |
| (9) |
| (10) |
where standard notations were used (Tang et al., 2004b). Material stress-stretch curves for fibrous tissue (vessel), lipid pool, and calcifications, prescribed inlet and outlet pressure conditions and the corresponding flow rates obtained from the FSI model are given by Fig. 3. Patient-specific maximum and minimum pressure values (by arm prior to MRI scan) were used to adjust the profile in Fig. 3 for each patient studied. The inlet pressure was prescribed in the lumen for all 2D models. Stress-P1 and flow shear stress values corresponding to maximum pressure were used in the correlation analysis.
Figure 3.
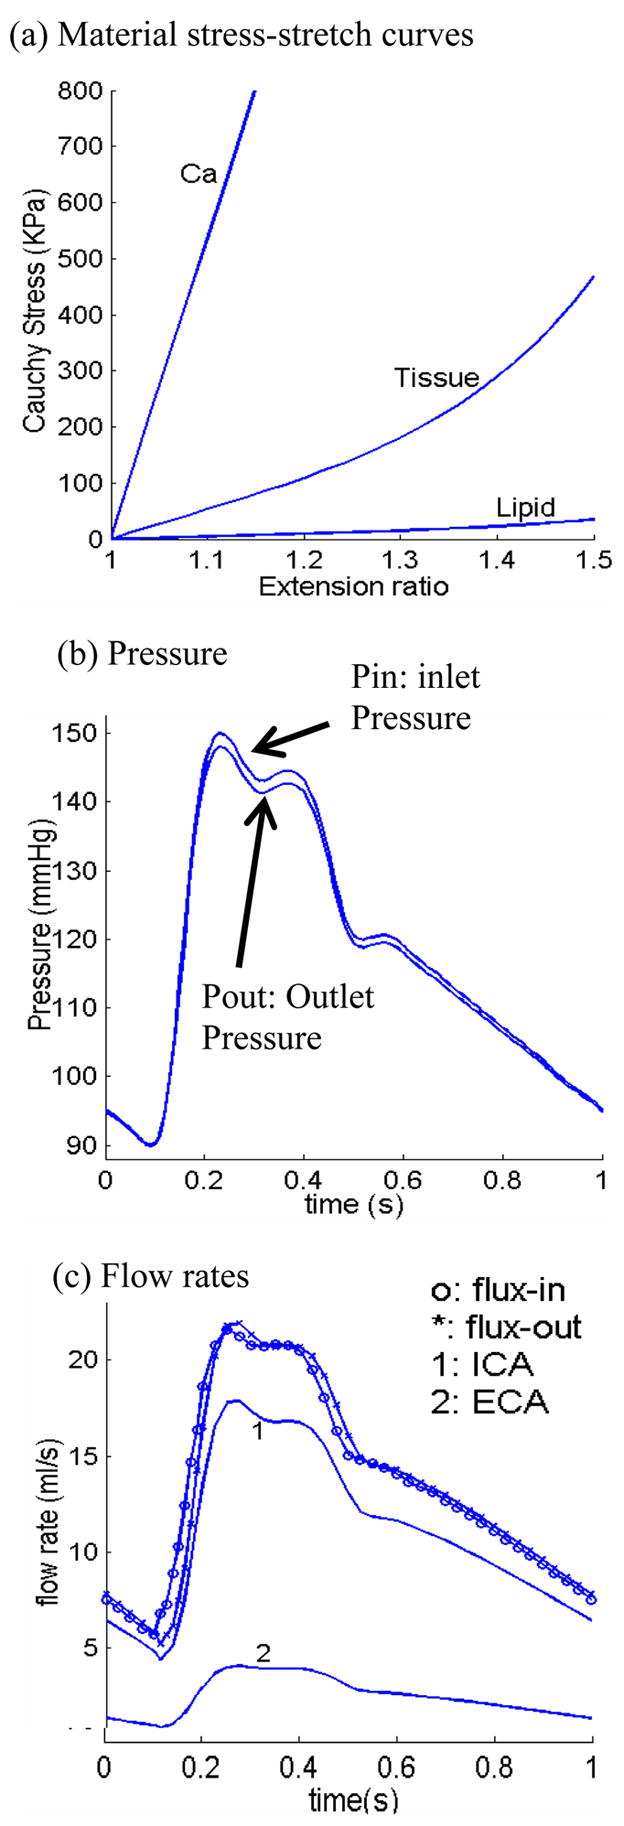
Material curves and pressure conditions for the multi-component plaque model. (a) Stress-stretch curves derived from the modified Mooney-Rivlin model. The parameters are (c2 = 0 for all materials): vessel and fibrous tissue: c1 = 368000, D1 = 144000, D2 = 2.0; lipid: c1 = 20000, D1 = 20000, D2 = 1.5; Ca: c1 = 3680000; D1 = 1440000, D2 = 2.0, unit: dyn/cm2; (b) pressure conditions specified at the inlet (CCA) and outlet (ICA and ECA); (c) flow rates obtained from the 3D plaque model solutions corresponding to the pressure conditions.
2.3 Solution Methods
The 2D (solid only) and 3D FSI models were solved by ADINA. ADINA uses unstructured finite element methods for both fluid and solid models. Nonlinear incremental iterative procedures are used to handle fluid-structure interactions. The governing finite element equations for both solid and fluid models were solved by Newton-Raphson iteration method. More details of the computational models and solution methods can be found from Tang et al. (2004b), Yang et al. (2007) and Bathe (2002).
3. Results
3.1 WTI Correlates Negatively with Stress-P1 at Time 2 Using 2D Models
For Y1–Y20, each MRI scan gave 12–14 slices with 2 mm slice thickness. For each patient, all matching internal carotid artery (ICA) slices from Time 1 (T1) and Time 2 (T2) were selected using carotid bifurcation as point of registration. We focused on ICA in this study. 100 equally spaced nodal points on the inner (lumen) boundary of each slice were selected for data collection and correlation analysis. For Y21, 40 equally spaced nodal points on the lumen boundary of each slice were selected for analysis. Fewer nodes were selected for Y21 because this sample was used to build the 3D model which had less nodal points on each slice. Vessel wall thickness increase (WTI) was defined as
| (11) |
and was selected to measure plaque progression in this paper. The daily WTI (dWTI, also called plaque daily growth rate function) was obtained by dividing WTI by the number of days of the scan interval. The term “vessel wall” or simply “wall” is used with the understanding that it includes normal artery tissue and all other plaque components. Wall thickness (WT) at a nodal point x on the lumen boundary was defined as the shortest distance between x and the vessel out-boundary curve. Numerically, the distances between x and the neighboring nodal points on the vessel out-boundary curve were calculated and the minimum was chosen to be the wall thickness at the nodal point x. A shrink-expand process was applied to all slices so that lumen circumferences were preserved under specified lumen pressure. A data set consisting of 300–700 data points (100/slice, all at inner boundary) was generated for each patient (other than Y21 which had 5 matching slices with 40 points/slice selected for analysis) which included wall thickness, values of maximum principal stress (Stress-P1) and all other stress/strain components at T1 and T2. Stress-P1 was selected as the representative quantity for plaque wall (structure) stress (PWS). PWS refers to Stress-P1 throughout this paper, unless indicated otherwise. The statistical analysis package SAS was used to determine possible correlations between WTI and the selected mechanical variables (Stress-P1 and other stress/strain components). Results from all 21 patients are summarized in Table 1. Statistically significant negative correlation was found in 18 out of the 21 cases considered. The 95% confidence interval (CI) for Pearson correlation (PC) coefficient values is (−0.443, −0.246), p < 0.0001.
Table 1.
Eighteen (18) out of twenty-one (21) patients studied showed statistically significant negative correlations between plaque progression measured by wall thickness increase (WTI) and plaque wall stress measured by Stress-P1 (taken at Time 2) obtained using 2D models. Linear approximations of the daily plaque growth functions by the least squares method are included. 95% confidence interval for correlation of the 21 patients for WTI vs. Stress- P1 at time 2 is [−0.443, −0.246].
| Case | Data Pts | Days | Daily Growth Rate (cm/day) (Unit for Stress: KPa) | Pearson Coeff. | p- value |
|---|---|---|---|---|---|
| Y1 | 700 | 569 | 6.028 E-05 – 7.083 E-07 σ | − 0.497 | < 0.0001 |
| Y2 | 400 | 533 | 6.529 E-05 – 9.962 E-07 σ | − 0.381 | < 0.0001 |
| Y3 | 600 | 525 | 1.201 E-04 – 1.796 E-06 σ | − 0.637 | < 0.0001 |
| Y4 | 500 | 534 | 4.157 E-05 – 3.202 E-07 σ | − 0.244 | < 0.0001 |
| Y5 | 300 | 1097 | 4.166 E-05 – 4.521 E-07 σ | − 0.293 | < 0.0001 |
| Y6 | 400 | 403 | 1.300 E-04 – 1.630 E-06 σ | − 0.395 | < 0.0001 |
| Y7 | 500 | 557 | − 1.278 E-05 – 5.206 E-08 σ | − 0.0414 | 0.36 |
| Y8 | 400 | 565 | 6.248 E-05 – 5.575 E-07 σ | − 0.297 | < 0.0001 |
| Y9 | 400 | 565 | 2.708 E-05 – 3.168 E-07 σ | − 0.252 | < 0.0001 |
| Y10 | 500 | 558 | 9.337E-05 – 1.633 E-06 σ | −0.51886 | < 0.0001 |
| Y11 | 300 | 277 | 2.363E-04 – 5.206 E-06 σ | −0.63663 | < 0.0001 |
| Y12 | 400 | 562 | 2.875E-04 – 5.206 E-06 σ | −0.50642 | < 0.0001 |
| Y13 | 600 | 631 | −3.082E-05 – 5.206 E-06 σ | 0.073966 | 0.07 |
| Y14 | 300 | 520 | −1.557E-04 – 5.206 E-06 σ | 0.21414 | 0.0002 |
| Y15 | 500 | 1126 | 7.465E-05 – 5.206 E-06 σ | −0.56568 | < 0.0001 |
| Y16 | 400 | 298 | 3.074E-04 – 5.206 E-06 σ | −0.30633 | < 0.0001 |
| Y17 | 500 | 495 | 9.541E-05 – 5.206 E-06 σ | −0.31474 | < 0.0001 |
| Y18 | 300 | 549 | 2.236E-04 – 5.206 E-06 σ | −0.36853 | < 0.0001 |
| Y19 | 600 | 461 | 3.668E-05 – 5.206 E-06 σ | −0.36071 | < 0.0001 |
| Y20 | 600 | 525 | 1.515E-04 – 5.206 E-06 σ | −0.39872 | < 0.0001 |
| Y21 | 200 | 304 | 1.875E-06 e−4– 2.536 E-06 σ | − 0.497 | < 0.0001 |
Fig. 4 gives a plot of WTI vs. Stress-P1 from Y3 using 600 data points from 6 slices. The PC value is −0.637 (p < 0.0001) which is the best among the twenty-one cases considered (see Table 1). The PC values for the 6 slices analyzed individually were −0.438, −0.461, −0.628, −0.754, −0.653 and −0.502 respectively, all with p < 0.0001. The linear approximation obtained using the least squares method is:
| (12) |
where σ stands for Stress-P1. The daily WTI (dWTI, also called plaque daily growth rate function) is obtained by dividing (12) by the days of the scan interval (525 days):
| (13) |
Figure 4.
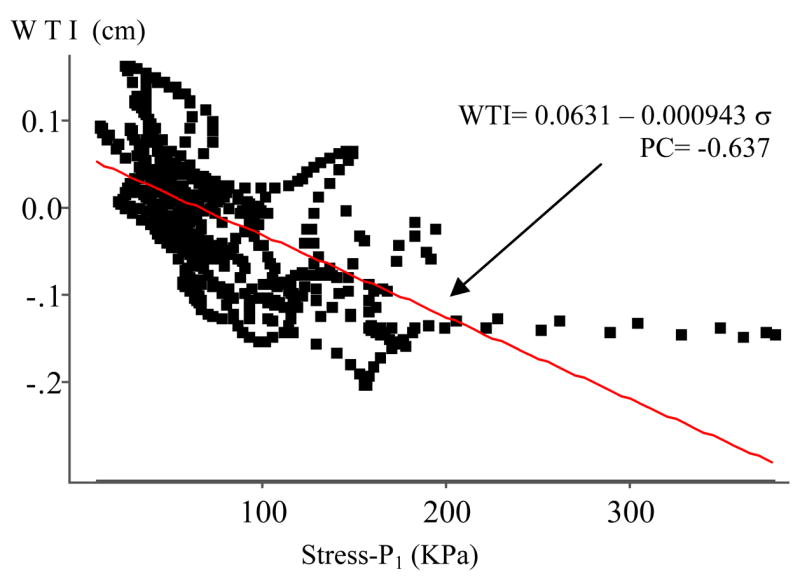
Human carotid plaque progression measured by wall thickness increase (WTI) correlates negatively with wall maximum principal stress (Stress-P1). Pearson correlation coefficient PC = −0.637 (p < 0.0001).
3.2. Correlations between WTI and Wall Thickness at T1 & T2) and Stress-P1 at T1
Correlation analysis results are reported in Table 2. Baseline average wall thickness values were also given. While a weak positive correlation between WTI and Stress-P1 at T1 was observed, only 11 cases out of 21 have PC values > 0.2 (corresponding R2 = 0.04). 2 cases showed negative correlation. WTI showed statistically significant negative correlation with WT at Time 1 (14 out of 21) and positive correlation with WT at Time 2 (18 out of 21).
Table 2.
Correlation analysis results between WTI and Stress-P1 at Time 1 and Wall Thickness at Time 1 and Time 2. 95% confidence intervals for correlation of WTI vs. Stress- P1 at Time 1: [0.0986, 0.3306]; WTI vs. wall thickness at Time 1: [−0.367,−0.0956]; WTI vs. wall thickness at Time 2 is [0.3301,0.578].
| Case | PC (WTI vs. Stress-P1 at T1) | p-value | PC (WTI vs. WT at T1) | p-value | PC (WTI vs. WT at T2) | p-value | Baseline Average WT(cm) |
|---|---|---|---|---|---|---|---|
| Y1 | 0.1705 | < 0.0001 | −0.0719 | 0.0570 | 0.6435 | < 0.0001 | 0.1031 |
| Y2 | 0.3787 | < 0.0001 | −0.3227 | < 0.0001 | 0.2719 | < 0.0001 | 0.1384 |
| Y3 | 0.1278 | 0.0017 | −0.2703 | < 0.0001 | 0.8296 | < 0.0001 | 0.2226 |
| Y4 | 0.2672 | < 0.0001 | −0.3524 | < 0.0001 | 0.7050 | < 0.0001 | 0.1182 |
| Y5 | 0.2790 | < 0.0001 | −0.3503 | < 0.0001 | 0.3933 | < 0.0001 | 0.1143 |
| Y6 | 0.0354 | 0.4800 | −0.0487 | 0.3300 | 0.3742 | < 0.0001 | 0.1683 |
| Y7 | 0.5297 | < 0.0001 | −0.4330 | < 0.0001 | 0.0960 | 0.0318 | 0.1124 |
| Y8 | 0.1795 | 0.0003 | −0.2660 | < 0.0001 | 0.4117 | < 0.0001 | 0.1056 |
| Y9 | 0.4216 | < 0.0001 | −0.7244 | < 0.0001 | 0.3770 | < 0.0001 | 0.0952 |
| Y10 | −0.2126 | < 0.0001 | 0.2332 | < 0.0001 | 0.6197 | < 0.0001 | 0.2084 |
| Y11 | −0.1482 | 0.0100 | 0.1280 | 0.0266 | 0.6928 | < 0.0001 | 0.1481 |
| Y12 | 0.3240 | < 0.0001 | −0.1651 | 0.0009 | 0.8953 | < 0.0001 | 0.1516 |
| Y13 | 0.5471 | < 0.0001 | −0.4917 | < 0.0001 | −0.0803 | 0.0490 | 0.1767 |
| Y14 | 0.5239 | < 0.0001 | −0.5400 | < 0.0001 | −0.1360 | 0.0184 | 0.2145 |
| Y15 | −0.0245 | 0.5840 | 0.2465 | < 0.0001 | 0.6658 | < 0.0001 | 0.1585 |
| Y16 | 0.0711 | 0.1560 | −0.6268 | < 0.0001 | 0.5151 | < 0.0001 | 0.1312 |
| Y17 | 0.4075 | < 0.0001 | −0.3255 | < 0.0001 | 0.6329 | < 0.0001 | 0.1532 |
| Y18 | 0.0969 | 0.0940 | 0.0632 | 0.2750 | 0.5053 | < 0.0001 | 0.1936 |
| Y19 | 0.2339 | < 0.0001 | −0.1292 | 0.0015 | 0.2696 | < 0.0001 | 0.1565 |
| Y20 | 0.6017 | < 0.0001 | −0.6454 | < 0.0001 | 0.3089 | < 0.0001 | 0.1631 |
| Y21 | −0.3040 | 0.0005 | 0.2370 | 0.0007 | 0.5400 | < 0.0001 | 0.1899 |
3.3. Validation of 2D Results Using 3D FSI Model
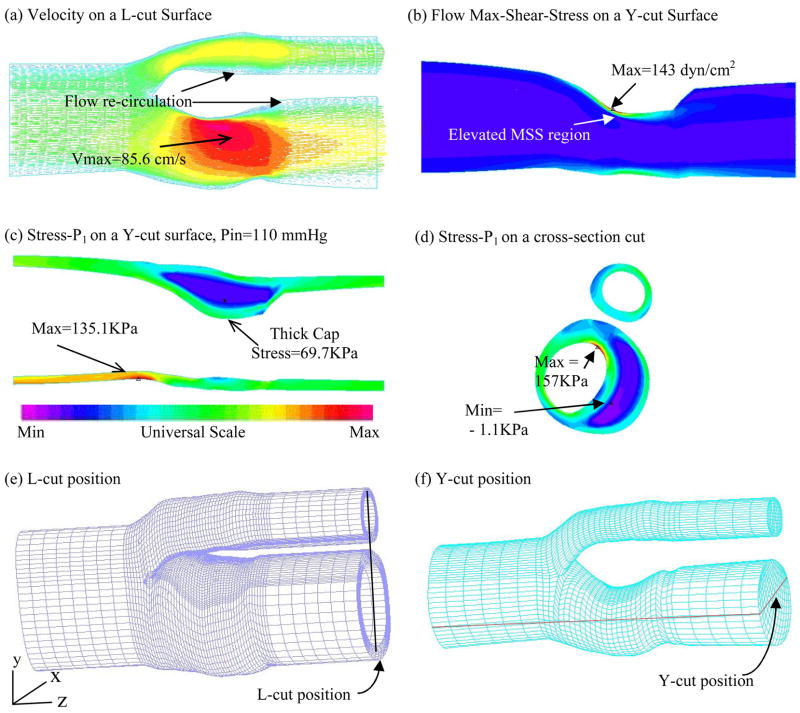
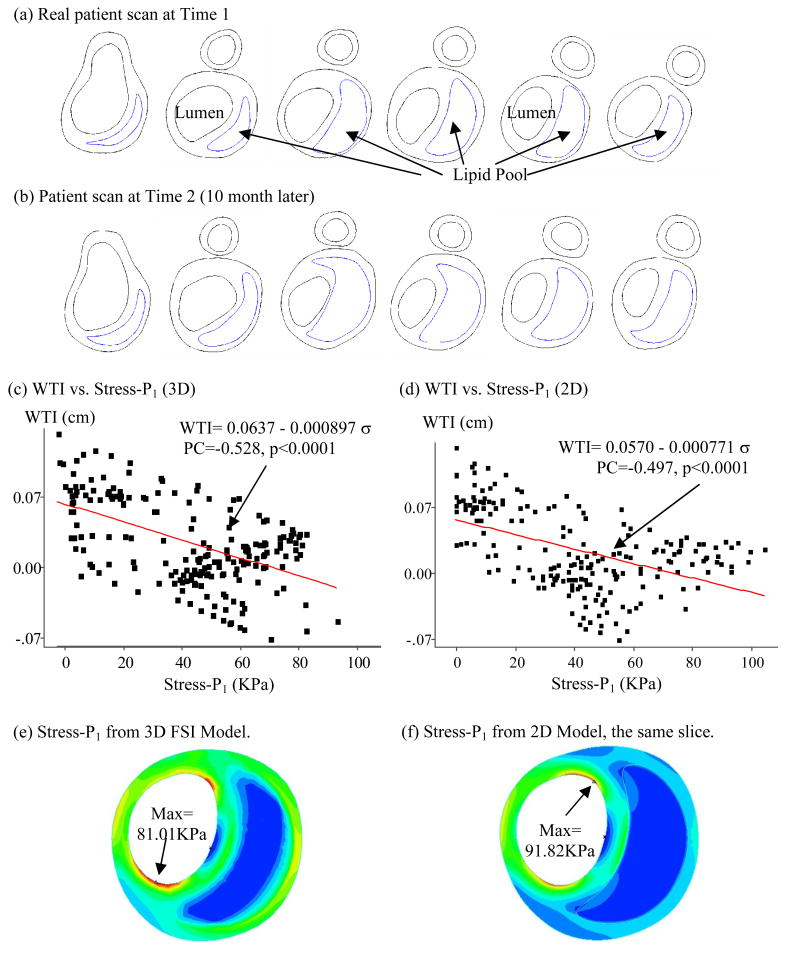
A 3D FSI model was constructed for Y21 (the plaque sample given by Fig. 1-(c)) to validate our 2D findings. Our 3D models have been validated by in vitro experimental data (Tang et al., 2003; Tang et al, 2004a). Errors of predicted radial deformation were less than 2% (with and without lipid pool) and errors for flow rate were less than 2% and 5% for no-pool and pool cases, respectively. Figure 5 presents some baseline results showing typical stress distributions and flow behaviors obtained from the 3D FSI plaque model. Elevated flow shear stress is observed in the stenotic region where vessel wall is thick. Figure 6 gives 6 matching slices (out of 11) of the plaque sample from Y21. Only the 5 ICA slices (40 points/slice, 200 data points from lumen surface) were selected for our correlation analysis. Figure 6-(c) plots WTI vs. Stress-P1 at Time 2 using results from the 3D FSI model. The PC value was − 0.528 (p < 0.0001) which is highly statistically significant. For the 5 individual slices, we have PC = −0.651 (p < 0.0001), −0.457 (p = 0.0031), −0.453 (p = 0.0033), −0.640 (p < 0.0001), −0.778 (p < 0.0001), respectively. The linear approximation given by the least squares method is:
| (14) |
Figure 5.
3D FSI model baseline solution plots showing both structure stress and flow velocity and flow maximum shear stress (FMSS) behaviors.
Figure 6.
Results from 3D FSI model show negative correlation between WTI and plaque wall stress (Stress-P1), supporting 2D correlation results.
A 95% confidence interval for the population correlation is (−0.6622, −0.421). The daily WTI (scan interval 304 days) is given by:
| (15) |
To compare 2D and 3D FSI models, Fig. 6-(d) presented WTI vs. Stress-P1 (at Time 2) using results from 2D models which gave PC = −0.497, p < 0.0001. The error between 2D and 3D PC values is only 5.87%, with 3D model giving stronger correlation.
It is known that stress values from 2D and 3D plaque models can be different because 3D model includes longitudinal stretch and slices are bonded together (Tang et al., 2004b). Greater axial stretch leads to increased 3D Stress-P1 values. At the same time, 2D model expands more in radial direction because it has no axial stretch and no bonding effect from neighboring slices. That leads to higher Stress-P1 value at inner wall (lumen) and lower Stress-P1 values at outer portion of the wall as shown by Fig. 5-(e) & (f). 3D maximum Stress-P1 (Time 1) from all slices was 426 KPa found from the bifurcating slice. This is 58% higher than that (269KPa) from the 2D models. Average 3D Stress-P1 values from all nodal points for the slice shown in Fig. 6-(e) was 33.64 KPa, while the 2D average was 19.42KPa. While 2D and 3D models do give different Stress-P1 values, Fig. 6 shows that they have similar distribution patterns and the majority of those values differ in a proportional way. 2D models could be used as a first-order approximation for our correlation analysis purposes. Our 3D example supported the correlation results given by 2D models.
4. Discussion
4.1 Correlation between WTI and Flow Maximum Shear Stress (FMSS)
The purpose of this paper is to report our findings of the negative correlations between plaque progression and plaque wall stress which is of general interest to the cardiovascular research community. To investigate the effect of flow shear stress on plaque progression, Fig. 7-(a) plots WTI vs. FMSS (maximum of the shear components of fluid stress acting on lumen surface, see Fung, 1994) using results from the 3D FSI model at T1. A negative correlation between WTI and FMSS was observed, even though wall thickness showed positive correlation with FMSS (Fig. 7(b)). The PC value (WTI vs. FMSS at T1) was −0.525, p < 0.0001. A 95% confidence interval for the population correlation was (−0.619, −0.417). For individual slices, we had PC = −0.623 (p < 0.0001), −0.766 (p < 0.0001), −0.784 (p < 0.0001), 0.303 (p = 0.057), and 0.283 (p = 0.077), respectively. Variations of PC values from slice to slice were very noticeable which may be related to local flow behaviors such as flow re-circulation regions. The linear approximation for WTI given by the least squares method is:
| (16) |
Figure 7.
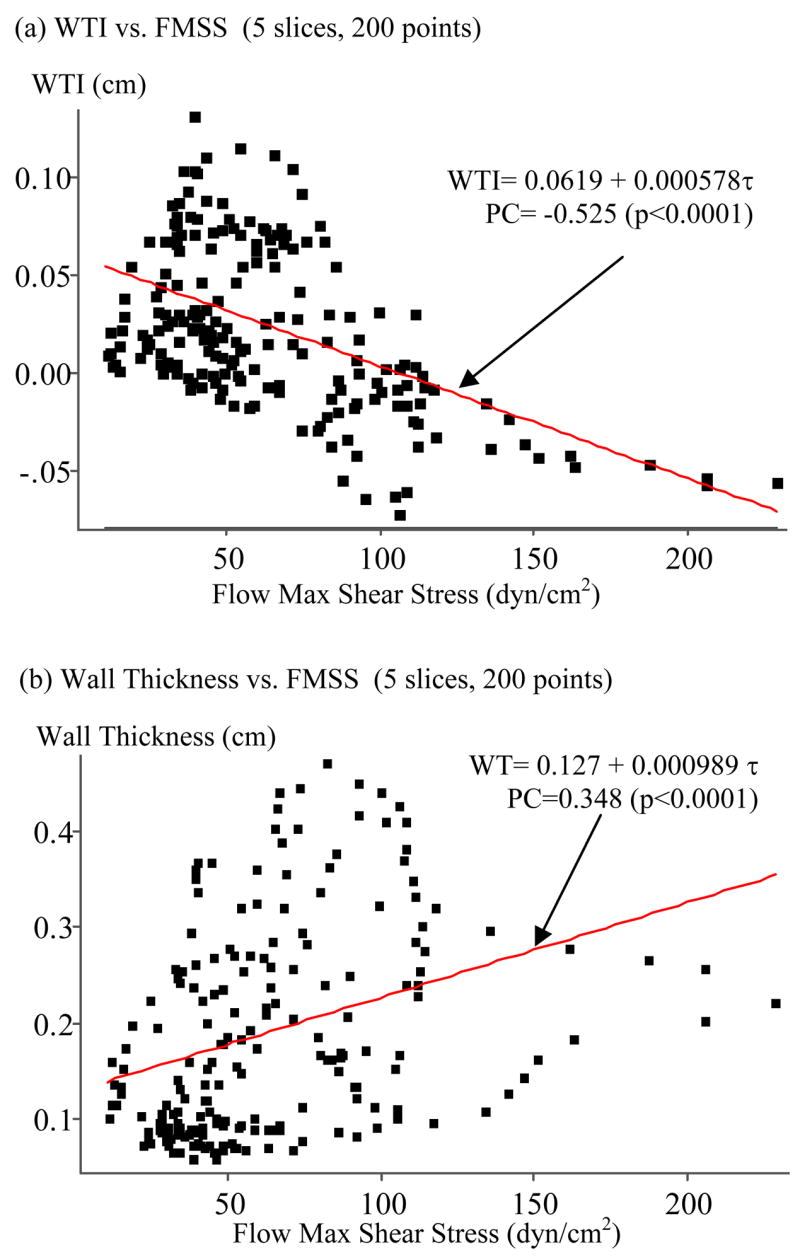
(a) Wall thickness increase (WTI) correlates negatively with flow maximum shear stress (PC = −0.525, p < 0.0001); (b) Wall thickness (WT) correlates positively with flow maximum shear stress (PC = 0.348, p < 0.0001).
Noticing WTI has statistically significant negative correlations with both Stress-P1 at Time 2 and FMSS at Time 1, multiple regression analysis was performed using both variables which led to the following formula with noticeable improvement on R2 value (R2 = 0.279, PWS only; R2 = 0.276, FMSS only):
| (17) |
The daily WTI (scan interval 304 days) is given by:
| (18) |
We are currently constructing 3D FSI models for more cases and updated results including both PWS and FMSS will be reported in our future papers.
It should be noted that when using FMSS values at Time 2, the PC value (WTI vs. FMSS) became PC = −0.260, p < 0.0001. Using both Stress-P1 and FMSS at Time 2, we have:
| (19) |
4.2. Possible Hypothesis for Plaque Progression, Mechanical and Other Related Factors
Plaque progression is a multi-faceted process. Other than mechanical factors, plaque type, component size and location, cell activities, blood conditions such as cholesterol level, diabetes, changes caused by medication such as statin, and other chemical conditions, inflammation and lumen surface condition may all have impact on plaque progression. Investigations and findings from all the channels, modalities and disciplines could be integrated together to obtain better and more thorough understanding of the complicated atherosclerotic progression process.
We are trying more complex function forms and using more time steps to better predict plaque growth. It was found that by using Stress-P1, WT at T2 (WT2) and WTI, much better predictions could be made for wall thickness at Time 3. Using a sample slice (S4) from Y1, the predicting function for WTI-23 (WT at T3 – WT at T2) for Slice 4 is given by:
| (20) |
where Stress-P1 at T2 was used. Coefficients in (20) were determined using the least-squares method to fit the MRI data. The R2 values for the 7 slices of Y1 were 0.63, 0.81, 0.78, 0.85, 0.78, 0.50, and 0.54 respectively, much better than the linear correlation results. We are still sorting things out and results will be reported in our future papers.
The purpose of our study was to quantify patient-specific plaque growth functions which will be used to simulate plaque progression using computational models. Using a progression model, plaque geometry will be updated at each numerical time step using the growth function determined based on MRI data. Since plaque grows very slowly and MRI scans are normally done on a yearly basis (18 months for participants in this paper), the most recent scan is closer to our numerical steps. That is a reason why Time 2 values were used in our correlation results reported in Table 1. More scans (MRI time points) will improve accuracy of our growth functions as indicated by (20).
4.3. Choosing WTI as measure for plaque progression
WTI and Stress-P1 at the inner boundary of the vessel are the natural choices of quantities for a first-order approximation to investigate plaque progression. It is true that tissue type (various plaque components), plaque component shape and size are all contributing factors. How each plaque component would grow in 3D setting depends on detailed local 3D stress/strain environment not available from 2D models. A first-order plaque growth function as defined in this paper (dWTI) will be a good starting point for future more challenging 3D investigations.
4.4. Locations of plaque thickening and thinning
Because thicker wall leads to lower stress level (ignoring plaque components for the time being), the negative correlation between WTI and Stress-P1 implies that plaque thickening tends to happen where the wall is thicker. That is further evidenced by the positive correlation between WTI and WT at time 2 and the growth function given by (20) which included wall thickness effect. All data points were treated equally (without referring to their locations) in this paper as required by statistical correlation analysis assumptions. Further analysis for localized plaque growth behaviors will need to include detailed location specific 3D flow and plaque stress/strain data and more accurate predictions will become possible.
4.5. Plaque progression and plaque vulnerability
The long term goal of the current work is that patient-specific quantitative plaque growth functions can be determined based on multiple annual MRI scans and used to simulate plaque progression, i.e., how the plaque would grow and would become in future years. “Future” plaque vulnerability can be assessed based on predicted future plaque morphologies by the progression models. We are adding the “time dimension” into plaque assessment technology to improve the predicting power and accuracy.
5. Conclusion
Our initial results obtained from serial MRI data and 2D models indicated that 18 out of 21 patients studied showed statistically significant negative correlation between PWS at T2 and plaque progression measured by WTI. We believe that this is the first time that quantitative human plaque growth functions (dWTI) were reported which can be used in many further investigations related to plaque progression. Our initial results support the new hypothesis that plaque progression depends on both structural stress/strain and flow shear stress conditions and that low structure stress and flow shear stress may create favorable environment for continued plaque progression. Including plaque morphological features and more time point data in the growth function may improve accuracy of predicted wall thickness changes. More data and validations are needed to confirm our findings.
Acknowledgments
This research was supported in part by NSF grant DMS-0540684, NIH grants NIH/NIBIB R01 EB004759 and NIH R01 HL073401. Many helpful discussions and advices from Professor Roger Kamm at MIT are happily acknowledged.
Footnotes
Publisher's Disclaimer: This is a PDF file of an unedited manuscript that has been accepted for publication. As a service to our customers we are providing this early version of the manuscript. The manuscript will undergo copyediting, typesetting, and review of the resulting proof before it is published in its final citable form. Please note that during the production process errors may be discovered which could affect the content, and all legal disclaimers that apply to the journal pertain.
References
- Bathe KJ. Finite Element Procedures. Prentice Hall, Inc; New Jersey: 1996. [Google Scholar]
- Bathe KJ, editor. Theory and Modeling Guide. I & II. ADINA and ADINA-F, ADINA R & D, Inc; Watertown, MA: 2002. [Google Scholar]
- Cai JM, Hatsukami TS, Ferguson MS, Small R, Polissar NL, Yuan C. Classification of human carotid atherosclerotic lesions with in vivo multicontrast magnetic resonance imaging. Circulation. 2002;106:1368–1373. doi: 10.1161/01.cir.0000028591.44554.f9. [DOI] [PubMed] [Google Scholar]
- Friedman MH. Arteriosclerosis research using vascular flow models: from 2-D branches to compliant replicas. J Biomech Eng. 1993;115:595–601. doi: 10.1115/1.2895546. [DOI] [PubMed] [Google Scholar]
- Friedman MH, Bargeron CB, Deters OJ, Hutchins GM, Mark FF. Correlation between wall shear and intimal thickness at a coronary artery branch. Atherosclerosis. 1987;68:27–33. doi: 10.1016/0021-9150(87)90090-6. [DOI] [PubMed] [Google Scholar]
- Fung YC. A First Course in Continuum Mechanics. 3. Englewood Cliffs; New Jersey: 1994. [Google Scholar]
- Giddens DP, Zarins CK, Glagov S. The role of fluid mechanics in the localization and detection of atherosclerosis. Journal of Biomechanical Engineering. 1993;115:588–594. doi: 10.1115/1.2895545. [DOI] [PubMed] [Google Scholar]
- Holzapfel GA, Stadler M, Schulze-Bause CAJ. A layer-specific three-dimensional model for the simulation of balloon angioplasty using Magnetic Resonance Imaging and mechanical testing. Annals of Biomedical Engineering. 2002;30(6):753–767. doi: 10.1114/1.1492812. [DOI] [PubMed] [Google Scholar]
- Huang H, Virmani R, Younis H, Burke AP, Kamm RD, Lee RT. The impact of calcification on the biomechanical stability of atherosclerotic plaques. Circulation. 2001;103:1051–1056. doi: 10.1161/01.cir.103.8.1051. [DOI] [PubMed] [Google Scholar]
- Humphrey JD. Cardiovascular Solid Mechanics. Springer-Verlag; New York: 2002. [Google Scholar]
- Joshi AK, Leask RL, Myers JG, Ojha M, Butany J, Ethier CR. Intimal thickness is not associated with wall shear stress patterns in the human right coronary artery. Arterioscler Thromb Vasc Biol. 2004;24(12):2408–2413. doi: 10.1161/01.ATV.0000147118.97474.4b. [DOI] [PubMed] [Google Scholar]
- Kaazempur-Mofrad MR, Isasi AG, Younis HF, Chan RC, Hinton DP, Sukhova G, Lamuraglia GM, Lee RT, Kamm RD. Characterization of the Atherosclerotic Carotid Bifurcation Using MRI, Finite Element Modeling, and Histology. Annals of Biomedical Engineering. 2004;32(7):932–946. doi: 10.1023/b:abme.0000032456.16097.e0. [DOI] [PubMed] [Google Scholar]
- Kerwin W, Hooker A, Spilker M, Vicini P, Ferguson M, Hatsukami T, Yuan C. Quantitative magnetic resonance imaging analysis of neovasculature volume in carotid atherosclerotic plaque. Circulation. 2003;107(6):851–856. doi: 10.1161/01.cir.0000048145.52309.31. [DOI] [PubMed] [Google Scholar]
- Kobayashi S, Tsunoda D, Fukuzawa Y, Morikawa H, Tang D, Ku DN. Flow and compression in arterial models of stenosis with lipid core. Proceedings of 2003 ASME Summer Bioengineering Conference; Miami, FL. 2003. pp. 497–498. [Google Scholar]
- Ku DN. Blood Flow in Arteries. Annu Rev Fluid Mech. 1997;29:399–434. [Google Scholar]
- Ku DN, Giddens DP, Zarins CK, Glagov S. Pulsatile flow and atherosclerosis in the human carotid bifurcation: positive correlation between plaque location and low and oscillating shear stress. Arteriosclerosis. 1985;5:293–302. doi: 10.1161/01.atv.5.3.293. [DOI] [PubMed] [Google Scholar]
- Liu F, Xu D, Ferguson MS, Chu B, Saam T, Takaya N, Hatsukami TS, Yuan C, Kerwin WS. Automated in vivo segmentation of carotid plaque MRI with morphology-enhanced probability maps. Magn Reson Med. 2006;55:659–668. doi: 10.1002/mrm.20814. [DOI] [PubMed] [Google Scholar]
- Long Q, Xu XY, Ariff B, Thom SA, Hughes AD, Stanton AV. Reconstruction of blood flow patterns in a human carotid bifurcation: A combined CFD and MRI study. Journal of Magnetic Resonance Imaging. 2000;11:299–311. doi: 10.1002/(sici)1522-2586(200003)11:3<299::aid-jmri9>3.0.co;2-m. [DOI] [PubMed] [Google Scholar]
- Long Q, Xu XY, Collins MW, Griffith TM, Bourne M. Fluid dynamics of the aortic bifurcation using magnetic resonance imaging and computational fluid dynamics. Internal Medicine (Clinical and Laboratory) 1997;5:35–42. [Google Scholar]
- Naghavi M, Libby P, Falk E, Casscells SW, Litovsky S, Rumberger J, Badimon JJ, Stefanadis C, Moreno P, Pasterkamp G, Fayad Z, Stone PH, Waxman S, Raggi P, Madjid M, Zarrabi A, Burke A, Yuan C, Fitzgerald PJ, Siscovick DS, de Korte CL, Aikawa M, Juhani Airaksinen KE, Assmann G, Becker CR, Chesebro JH, Farb A, Galis ZS, Jackson C, Jang IK, Koenig W, Lodder RA, March K, Demirovic J, Navab M, Priori SG, Rekhter MD, Bahr R, Grundy SM, Mehran R, Colombo A, Boerwinkle E, Ballantyne C, Insull W, Jr, Schwartz RS, Vogel R, Serruys PW, Hansson GK, Faxon DP, Kaul S, Drexler H, Greenland P, Muller JE, Virmani R, Ridker PM, Zipes DP, Shah PK, Willerson JT. From vulnerable plaque to vulnerable patient: a call for new definitions and risk assessment strategies: Part I. Circulation. 2003a;108(14):1664–1672. doi: 10.1161/01.CIR.0000087480.94275.97. [DOI] [PubMed] [Google Scholar]
- Naghavi M, Libby P, Falk E, Casscells SW, Litovsky S, Rumberger J, Badimon JJ, Stefanadis C, Moreno P, Pasterkamp G, Fayad Z, Stone PH, Waxman S, Raggi P, Madjid M, Zarrabi A, Burke A, Yuan C, Fitzgerald PJ, Siscovick DS, de Korte CL, Aikawa M, Juhani Airaksinen KE, Assmann G, Becker CR, Chesebro JH, Farb A, Galis ZS, Jackson C, Jang IK, Koenig W, Lodder RA, March K, Demirovic J, Navab M, Priori SG, Rekhter MD, Bahr R, Grundy SM, Mehran R, Colombo A, Boerwinkle E, Ballantyne C, Insull W, Jr, Schwartz RS, Vogel R, Serruys PW, Hansson GK, Faxon DP, Kaul S, Drexler H, Greenland P, Muller JE, Virmani R, Ridker PM, Zipes DP, Shah PK, Willerson JT. From vulnerable plaque to vulnerable patient: a call for new definitions and risk assessment strategies: Part II. Circulation. 2003b;108(15):1772–1778. doi: 10.1161/01.CIR.0000087481.55887.C9. [DOI] [PubMed] [Google Scholar]
- Nerem RM. Vascular fluid mechanics, the arterial wall, and atherosclerosis. J Biomech Engng. 1992;114:274–282. doi: 10.1115/1.2891384. [DOI] [PubMed] [Google Scholar]
- Ravn HB, Falk E. Histopathology of plaque rupture. Cardiology Clinics. 1999;17:263–70. doi: 10.1016/s0733-8651(05)70073-4. [DOI] [PubMed] [Google Scholar]
- Ross R. The pathogenesis of atherosclerosis: a perspective for the 1990’s. Nature. 1993;362:801–809. doi: 10.1038/362801a0. [DOI] [PubMed] [Google Scholar]
- Steinman DA, Thomas JB, Ladak HM, Milner JS, Rutt BK, Spence JD. Reconstruction of carotid bifurcation hemodynamics and wall thickness using computational fluid dynamics and MRI. Magn Reson Med. 2002;47(1):149–159. doi: 10.1002/mrm.10025. [DOI] [PubMed] [Google Scholar]
- Tang D, Yang C, Kobayashi S, Ku DN. Steady flow and wall compression in stenotic arteries: a 3-D thick-wall model with fluid-wall interactions. Journal of Biomechanical Engineering. 2001;123:548–557. doi: 10.1115/1.1406036. [DOI] [PubMed] [Google Scholar]
- Tang D, Yang C, Kobayashi S, Zheng J, Vito RP. Effects of stenosis asymmetry on blood flow and artery compression: a 3-D FSI model. Annals of Biomedical Engineering. 2003;31:1182–1193. doi: 10.1114/1.1615577. [DOI] [PubMed] [Google Scholar]
- Tang D, Yang C, Kobayashi S, Ku DN. Effect of a Lipid Pool on Stress/Strain Distributions in Stenotic Arteries: 3D FSI Models. J Biomech Engng. 2004a;126:363–370. doi: 10.1115/1.1762898. [DOI] [PubMed] [Google Scholar]
- Tang D, Yang C, Zheng J, Woodard PK, Saffitz JE, Sicard GA, Pilgram TK, Yuan C. Quantifying effects of plaque structure and material properties on stress behaviors in human atherosclerotic plaques using 3D FSI models. Journal of Biomechanical Engineering. 2005b;127(7):1185–1194. doi: 10.1115/1.2073668. [DOI] [PMC free article] [PubMed] [Google Scholar]
- Tang D, Yang C, Zheng J, Woodard PK, Sicard GA, Saffitz JE, Yuan C. 3D MRI-based multi-component FSI models for atherosclerotic plaques, a 3-D FSI model. Annals of Biomedical Engineering. 2004b;32(7):947–960. doi: 10.1023/b:abme.0000032457.10191.e0. [DOI] [PubMed] [Google Scholar]
- Wentzel JJ, Janssen E, Vos J, Schuurbiers JC, Krams R, Serruys PW, de Feyter PJ, Slager CJ. Extension of increased atherosclerotic wall thickness into high shear stress regions is associated with loss of compensatory remodeling. Circulation. 2003;108(1):17–23. doi: 10.1161/01.CIR.0000078637.21322.D3. [DOI] [PubMed] [Google Scholar]
- Wentzel JJ, Corti R, Fayad ZA, Wisdom P, Macaluso F, Winkelman MO, Fuster V, Badimon JJ. Does shear stress modulate both plaque progression and regression in the thoracic aorta? Human study using serial magnetic resonance imaging. J Am Coll Cardiol. 2005;45(6):846–854. doi: 10.1016/j.jacc.2004.12.026. [DOI] [PubMed] [Google Scholar]
- Yang C, Tang D, Yuan C, Hatsukami TS, Zheng J, Woodard PK. In Vivo/Ex Vivo MRI-Based 3D Models with Fluid-Structure Interactions for Human Atherosclerotic Plaques Compared with Fluid/Wall-Only Models. CMES: Computer Modeling in Engineering and Sciences. 2007;19(3):233–245. [PMC free article] [PubMed] [Google Scholar]
- Yuan C, Kerwin WS. MRI of atherosclerosis. Journal of Magnetic Resonance Imaging. 2004;19(6):710–719. doi: 10.1002/jmri.20070. [DOI] [PubMed] [Google Scholar]
- Yuan C, Mitsumori LM, Beach KW, Maravilla KR. Special review: carotid atherosclerotic plaque: noninvasive MR characterization and identification of vulnerable lesions. Radiology. 2001a;221:285–299. doi: 10.1148/radiol.2212001612. [DOI] [PubMed] [Google Scholar]
- Yuan C, Mitsumori LM, Ferguson MS, Polissar NL, Echelard DE, Ortiz G, Small R, Davies JW, Kerwin WS, Hatsukami TS. In vivo accuracy of multispectral MR imaging for identifying lipid-rich necrotic cores and intraplaque hemorrhage in advanced human carotid plaques. Circulation. 2001b;104:2051–2056. doi: 10.1161/hc4201.097839. [DOI] [PubMed] [Google Scholar]


