Abstract
Integrating surface plasmon resonance analysis with mass spectrometry allows detection and characterization of molecular interactions to be complemented with identification of interaction partners. We have developed a procedure for Biacore®3000 that automatically performs all steps from ligand fishing and recovery to sample preparation for matrix-assisted laser desorption/ionization (MALDI) mass spectrometry including on-target digestion. In the model system used in this study a signal transduction protein, calmodulin, was selectively captured from brain extract by one of its interaction partners immobilized on a sensor chip. The bound material was eluted, deposited directly onto a MALDI target, and analyzed by mass spectrometry both as an intact protein and after on-target tryptic digestion. The procedure with direct deposition of recovered material on the MALDI target reduces sample losses and, in combination with automatic sample processing, increases the throughput of surface plasmon resonance mass spectrometry analysis.
Keywords: Surface plasmon resonance, biomolecular interaction assay, mass spectrometry, ligand fishing, protein complexes
In light of the recent developments in functional proteomics the cell environment is emerging as a complex network of interacting biomolecules. Delineating this network by identifying unknown interaction partners and complexes can significantly improve our understanding of cell physiology as well as provide new targets for directed control of cell functioning. Biomolecular interaction analysis is a well-established technique for highly sensitive detection, real-time monitoring, and characterization of biomolecular interactions, and is based on the phenomenon of surface plasmon resonance (SPR). One of the interaction partners is immobilized on a sensor chip using one of a number of available chemistries. Solution containing another interaction partner is then brought into contact with the chip, which, in Biacore SPR instruments, is achieved by conducting the analyte through a flow cell with one of the walls formed by the sensor chip. If the interaction partners of a protein need to be identified, a protein mixture representing the physiological environment of the test protein can be injected. In this case the SPR sensor will detect interaction, if any, and the bound material can be recovered from the chip. But identification of the bound protein will require SPR to be complemented with an additional analytical step. Here, mass spectrometry (MS) appears to be the most suitable tool, since it is the most sensitive and specific method for protein identification.
A number of successful attempts to combine SPR with MS have been reported, with low femtomole amounts of the captured material shown to be sufficient for secure identification of the captured proteins.1–10 To further streamline the SPR-MS interface, we have developed a fully automated procedure for a ligand fishing experiment which sequentially performs the steps of ligand capture, recovery, deposition onto a matrix-assisted laser desorption/ionization (MALDI) target, and sample preparation for MALDI time-of-flight (TOF) MS including on-target tryptic digestion. To demonstrate the performance of this technique we describe a model experiment with a protein captured from a complex biological environment by its interaction partner immobilized on a sensor chip.
MATERIALS AND METHODS
Chemicals
Calmodulin and the calmodulin-binding domain (CBD) of myosin light-chain kinase were purchased from Calbiochem (San Diego, California, USA). Bovine brain acetone powder was from Sigma-Aldrich (Stockholm, Sweden). Nitrocellulose Trans-Blot membrane was from BioRad (Sundbyberg, Sweden). Peptide calibration standards and α-cyano hydroxycinnamic acid (HCCA) were from Bruker Daltonik (Bremen, Germany). Acetonitrile was from Lab-Scan (Dublin, Ireland). Acetone and trifluoroacetic acid (TFA) were from Merck (Darmstadt, Germany). Sequencing-grade modified trypsin was from Promega (Madison, Wisconsin, USA). Also used were the following chemicals and consumables supplied by Biacore (Uppsala, Sweden): HBS-EP buffer (0.01 M HEPES, pH 7.4, 0.15 M NaCl, 3 mM EDTA, 0.005% surfactant P20), HBS-N buffer (0.01 M HEPES, pH 7.4, 150 mM NaCl), amine coupling kit, 50 mM NaOH solution, sensor chip CM5 (research grade).
SPR Analysis and Analyte Recovery
All experiments were carried out using Biacore 3000 SPR sensor (Biacore) with control software version 4.0 and Sensor Chip CM5 (carboxymethylated dextran surface). All assays were carried out at 25°C. CBD was immobilized via amine groups in all of the four available flow cells. To this end the chip surface was first activated following a standard EDC/NHS protocol11 with Biacore HBS-EP buffer used as the running buffer. CBD at a concentration of 0.1 mg/mL in 10 mM K-phosphate buffer, pH 7.4, was then injected for 10 min followed by a 7-min injection of 1 M ethanolamine, pH 8.5, to inactivate the residual active groups. Finally, the surface was treated with 10 half-minute pulses of 50 mM NaOH in order to remove non-covalently bound CBD. Typically, about 1600 RU of CBD was immobilized per flow cell. This corresponds to 1.6 ng or 700 fmol of the peptide per flow cell.
Bovine brain acetone powder (10 mg) was vortexed for 5 min in 1 mL of HBS-N buffer supplied with 2 mM CaCl2. The insoluble residue was pelleted by centrifugation and discarded. The supernatant was diluted tenfold in the same buffer (in the following this preparation is referred to as brain extract), and 200 μL was injected at a flow rate of 20 μL/min. All four flow cells were used for analyte capture and recovery. The flow system was then washed with 50 mM NaOH, rinsed with 50 mM NH4HCO3, and the flow cells were rinsed with 50 mM NH4HCO3, 2 mM CaCl2. The bound material was eluted with 2 μL of 0.5% TFA for the analysis of intact protein or a mixture of 50 mM NH4HCO3 and 2 mM EGTA for the analysis of tryptic digest. HBS-N buffer supplied with 2 mM CaCl2 was used as the running buffer.
MALDI-TOF MS of Intact Protein
This experiment was set up using the Analyte Recovery wizard of Biacore 3000. The material eluted from the chip with 0.5% TFA was deposited onto a Bruker Daltonics MALDI target covered with a thin layer of HCCA and nitrocellulose. To prepare the thin layer, 20 mg/mL nitrocellulose in acetone was mixed with an equal volume of isopropanol, and the resulting mixture was added to four parts of HCCA saturated in acetone. A 50-μL drop of the mixture was applied on the target manually, and a thin matrix layer was formed upon solvent evaporation. The mass spectrum was recorded on an Autoflex MALDI-TOF mass spectrometer (Bruker Daltonics) operated in the linear mode.
On-target Digestion and Sample Preparation for MALDI MS
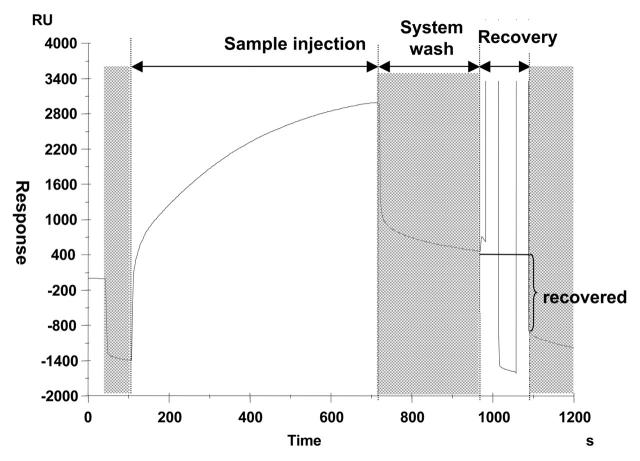
In this experiment, the capture and recovery of the target protein as well as sample preparation for MALDI MS were steered entirely by a program written in Biacore Method Definition Language. The brain extract was injected using the MS_INJECT command (Figure 1). The MS_INJECT routine starts with the injection of a user-specified MS compatible buffer (50 mM NH4HCO3, 2 mM CaCl2 in the present study) to record the baseline, followed by sample injection. The abrupt changes in response immediately before and after the injection are due to bulk refractive index changes when the MS_INJECT routine switches between the running buffer and a user-specified MS-compatible buffer. This buffer is injected to minimize the contamination of the recovered material with the components of the running buffer.
FIGURE 1.
Sensorgram of calmodulin capture on, and recovery from, a chip derivatized with calmodulin-binding domain. Shaded areas correspond to the steps where the running buffer is automatically exchaged for a user-defined MS-compatible buffer. HBS-N buffer supplied with 2 mM EGTA was used for recovery.
After the end of injection the flow cells are washed with the above buffer for a period of 6 sec, and the flow cell valves are shut. The fluidic system was then washed using the MS_WASH command. The MS_WASH routine washes the flow channels, but not the flow cells, with three user-specified solutions to prevent carry over from the injected sample. In the present study 50 mM NaOH was used as solution 1 and the above MS compatible buffer as solutions 2 and 3. Finally, the bound analyte was eluted from the chip with 50 mM NH4HCO3, 2 mM EGTA and deposited onto a 0.8-mm spot of the AnchorChip™ target (Bruker Daltonics) using the MS_RECOVER command. MS_RECOVER starts with an 8-sec wash of the flow cells with the MS compatible buffer, and 2 μL of the recovery solution is then placed over the flow cells and left in contact with the surface for a user-specified period of time (30 sec in the present study).
The solution is then withdrawn back to the autosampler needle and deposited onto a MALDI target (as in the present study) or, optionally, to a vial in a sample rack. One microliter of 15 μg/mL trypsin in acetonitrile:water (60:40) was added to the deposited material using the MICROTRANSFER command, allowing the transfer of 1–10 μL of solution between any two positions in the reagent racks and MALDI holder. The sample was allowed to dry by pausing program execution for 20 min by means of the WAIT command. One microliter each of 0.5% TFA and 0.5 mg/mL HCCA in ethanol:acetone (2:1) was then placed on the spot using the MICROTRANSFER command and allowed to dry.
MALDI-TOF MS and Protein Identification by Peptide Mass Fingerprint
The mass spectrum was recorded on an Autoflex MALDI-TOF mass spectrometer (Bruker Daltonik) operated in the reflector mode. Bruker Daltonik peptide calibration standard was used for external calibration. The peptide masses were submitted to the MSDB database via the Mascot database search engine (Matrix Science) for protein identification.
Peptide Sequencing and Identification of Posttranslational Modifications by MS/MS
The MS/MS spectra were acquired and analyzed on an Ultraflex MALDI-TOF/TOF mass spectrometer (Bruker Daltonik).
RESULTS
Capture of Calmodulin from Brain Extract and Recovery from Chip
To demonstrate the feasibility of integrating SPR analysis with MS in a typical ligand fishing experiment, a model system was chosen consisting of calmodulin and the CBD of myosin light-chain kinase. Calmodulin is a ubiquitous regulatory protein involved in a number of signal transduction pathways. Myosin light-chain kinase is one of its interaction partners to which calmodulin binds in the presence of Ca2+ ions. CBD, a 20-mer fragment of the kinase responsible for the interaction with calmodulin, was immobilized on a CM5 chip via amine coupling. The goal of the experiment was to capture calmodulin on the chip from a crude biological mixture represented by bovine brain extract followed by the recovery and identification of the captured material.
Figure 1 presents a typical sensorgram (plot of SPR response vs. time) obtained after the injection of brain extract over a CBD-derivatized chip, wash of the fluidic system, and recovery of the bound material. These three operations were accomplished by the consecutive execution of the commands MS_INJECT, MS_WASH, and MS_RECOVER (see Materials and Methods for details of command operation).
About 2400 RU (2.4 ng, 140 fmol) of calmodulin per flow cell was captured. With 700 fmol of CBD immobilized (see Materials and Methods), this means that approximately 20% of the binding sites are occupied at the given analyte concentration and interaction time. The amount of recovered material, approximately 1300 RU per flow cell, corresponds to 75 fmol, which gives a total of 300 fmol of calmodulin recovered from four flow cells. However, the actual amount delivered to the MALDI target can be slightly lower since some material can be lost by adsorption in the flow system on the way from the chip to the MALDI target. No attempt to estimate these losses was made in the present study.
The fact that the baseline after recovery returns to the initial level (compare response levels in the first and third shaded segments on Figure 1) indicates that complete recovery is achieved.
No binding of any material from the brain extract to the unmodified surface was observed. Nor was there any binding to CBD-modified surface in the absence of CaCl2 (data not shown). Together with the fact that all material captured in the presence of CaCl2 could be efficiently eluted with EGTA (Figure 1), this means that the binding is highly specific.
MALDI-TOF MS of Intact Protein
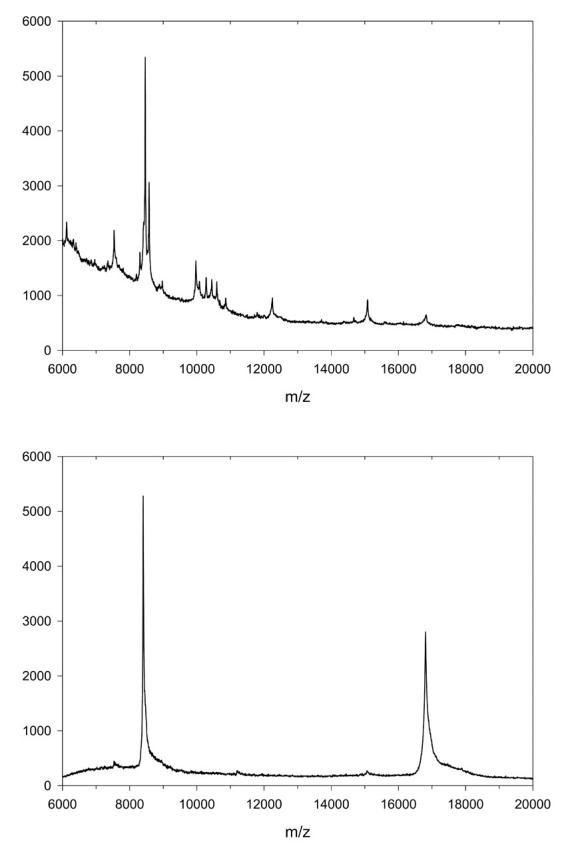
Figure 2 shows a mass spectrum obtained after direct deposition of the material recovered from four flow cells onto a MALDI target covered with a thin layer of HCCA/nitrocellulose. The only two detectable peaks correspond to the single- and double-protonated species of calmodulin, demonstrating that the CBD-derivatized chip acts as a highly specific and efficient affinity separation medium.
FIGURE 2.

MALDI-TOF MS spectrum of bovine brain extract (top panel) and material eluted from CBD-derivatized chip after injection of bovine brain extract (bottom panel).
On-target Digestion, MALDI-TOF MS, and Protein Identification by Peptide Mass Fingerprint
In this experiment calmodulin was eluted from the chip with 50 mM NH4HCO3 buffer supplemented with 2 mM EGTA, with EGTA acting by chelating the Ca2+ ions necessary for calmodulin binding to CBD. The MS_RECOVER routine delivers 2 μL of the eluate, and it was programmed to deposit this material onto a 0.8-mm spot of the Bruker AnchorChip target mounted on a Biacore MALDI Holder. This was followed by the transfer of 1 μL of trypsin solution in 60% acetonitrile to the same position to give a final sample volume and acetonitrile concentration at the beginning of digestion of 3 μL and 20%, respectively. Preliminary experiments showed that it takes 15–17 min for a drop of such a composition to dry at room temperature, so program execution after trypsin addition was halted for 20 min. After this time, the sample was acidified and mixed with the matrix by transferring 1 μL each of the TFA and HCCA solutions to the spot.
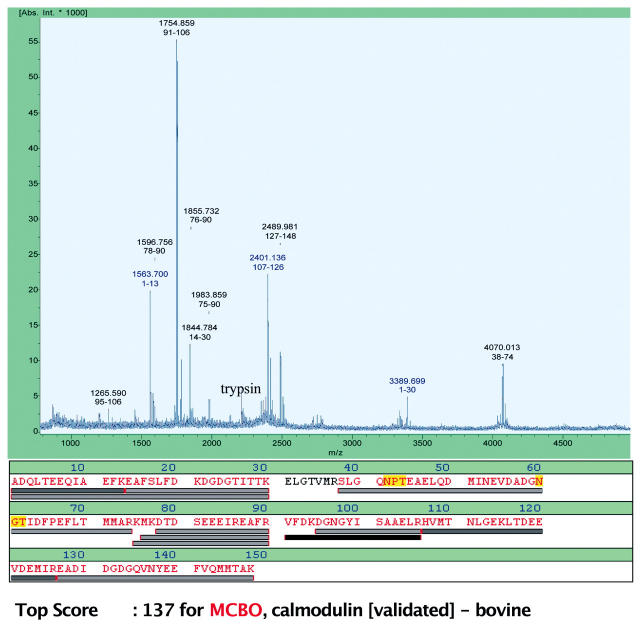
After drying, the sample was analyzed by MALDI-TOF MS. Figure 3 shows the resulting MS spectrum and the sequence coverage map obtained after the eluted protein had been identified as bovine calmodulin. The database query included an option of acetylated N-terminus (as is the case with calmodulin), which helped identify two of the peaks (1563.7 and 3389.7 Da). Bovine calmodulin was identified as the top match with a Mowse score of 137. An additional peak (2401.1 Da) was identified by matching the mass spectrum with the in silico digest containing another known modification of calmodulin, trimethylation of Lys 115. The overall sequence coverage was 95%.
FIGURE 3.
MALDI-TOF MS spectrum, peptide coverage map, and result of database query for a ligand fishing experiment. Bovine brain extract was injected over a CBD-derivatized chip. The bound material was eluted with NH4HCO3/EGTA and deposited onto an AnchorChip MALDI target. The sample was then digested with trypsin on the target and prepared for MS analysis as described in the text.
Peptide Sequencing and Identification of Posttranslational Modifications by MS/MS
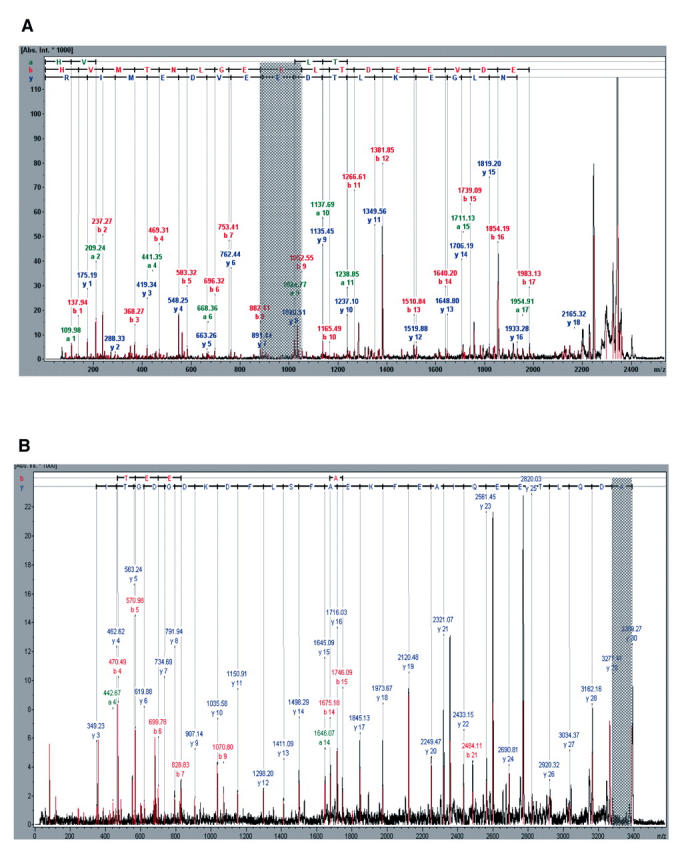
MS/MS is a tool complementing peptide mass data with amino acid sequence. Besides making protein identification much more confident, this allows one to detect post-translationally modified amino acids and determine the type of modification. Figure 4 shows the MS/MS spectra of the peptides with molecular masses of 2401.1 and 3389.7 Da. In addition to the complete sequence, two modifications have been detected. A lysine in the former peptide corresponding to Lys 114 in bovine calmodulin is either trimethylated or acetylated (these two modifications give the same mass increment), and the N-terminal alanine in the latter peptide is acetylated. This agrees with the known fact that Ala 1 is acetylated and Lys 114 trimethylated in calmodulin.
FIGURE 4.

MS/MS spectra of two of the tryptic fragments obtained in the ligand fishing experiment. The fragments correspond to amino acids 107–126 (A) and 1–30 (B) of the calmodulin sequence. The mass differences pointing to post-translational modifications of Lys 114 (A) and Ala 1 (B) are shaded.
DISCUSSION
We have demonstrated that when using the Biacore 3000 it is possible to devise a ligand fishing experiment with all steps from ligand capture to sample preparation for MALDI-TOF MS performed in a fully automated regimen. The fact that calmodulin was the only species detected when intact protein was analyzed by MALDI-TOF MS demonstrates that the CBD-derivatized chip is a very specific and efficient affinity separation medium. The selective capture and recovery of the target protein without contaminants significantly increases the chances of unambiguous identification by peptide fingerprinting.
For identification by peptide fingerprinting, proteins are routinely incubated with proteases for several hours in a sealed vial. In addition to the long time it takes, this approach involves a series of sample transfer operations inevitably leading to sample losses by adsorption, especially marked when protein concentrations are low. To avoid this and to develop a technique with all the operations from ligand fishing to sample preparation for MALDI MS carried out automatically by the Biacore 3000 autosampler, a protocol for on-target digestion and sample preparation was developed. On-target digestion protocols described earlier12,13 are difficult to adapt to the Biacore 3000 instrument environment since they involve incubation at 37°C for 30–60 min in a moist chamber. Instead, advantage was taken of the observation that the presence of organic solvents in the incubation mixture can dramatically increase the rate and extent of tryptic digestion, extensive cleavage being achieved within a few minutes at room temperature.14 Using this protocol we were able to achieve extensive digestion of calmodulin within the time it takes a drop of the enzyme-sample mixture to dry (15–20 min).
Besides reduced losses, a protocol with on-target deposition and sample preparation has the advantage of increased throughput. A large number of samples, e.g., chromatographic fractions, can be screened in an unattended run.
As reported earlier,14 acetonitrile concentrations as high as 80% can be successfully used with trypsin, and this may be necessary with proteins more resistant to proteolytic attack than calmodulin. On conventional stainless steel targets liquid drops with high contents of organic solvents tend to spread over a large area with reduced sensitivity as a result. This is however not the case with AnchorChip since its hydrophobic coating ensures that all material is concentrated to the small hydrophilic anchor upon drying, even if the surface tension in the drop is very low.
The robustness of the procedure was confirmed by running repeated ligand fishing cycles, with calmodulin being invariably and securely identified as the recovered material. Calmodulin contains no disulfide bonds, which allows one to skip the disulfide bond reduction step before digestion. Should a test protein contain such bonds, their reduction could improve proteolytic susceptibility and increase chances for unambiguous identification. Current research is focused on integrating a step of on-target reduction of disulfide bonds into the experimental protocol.
REFERENCES
- 1.Sönsken CP, Nordhoff E, Jansson Ö, Malmqvist M, Roepstorff P. Combining MALDI mass spectrometry and biomolecular interaction analysis using a biomelocular interaction analysis instrument. Anal Chem 1998;70:2731–2736. [DOI] [PubMed] [Google Scholar]
- 2.Nelson RW, Jarvik JW, Taillon BE, Tubbs KA. BIA/MS of epitope-tagged peptides directrly from E. coli lysate: Multiplex detection and protein identification at low-femtomole to subfemtomole levels. Anal Chem 1999;71:2858–2865. [DOI] [PubMed] [Google Scholar]
- 3.Natsume T, Nakayama H, Jansson O, Isobe T, Takio K, Mikoshiba K. Combination of biomolecular interaction analysis and mass spectrometric amino acid sequencing. Anal Chem 2000;72:4193–4198. [DOI] [PubMed] [Google Scholar]
- 4.Williams C, Addona TA. The integration of SPR biosensors with mass spectrometry: Possible applications for proteome analysis. Trends Biotechnol 2000;18:45–48. [DOI] [PubMed] [Google Scholar]
- 5.Nedelkov D, Nelson RW. Analysis of human urine protein biomarkers via biomelocular interaction analysis mass spectrometry. Am J Kidney Dis 2001;38:481–487. [DOI] [PubMed] [Google Scholar]
- 6.Nedelkov D, Nelson RW. Delineation of in vivo assembled multiprotein complexes via biomolecular interaction analysis mass spectrometry. Proteomics 2001;1:1441–1446. [DOI] [PubMed] [Google Scholar]
- 7.Natsume T, Taoka M., Manki H, Kume S, Isobe T, Mikoshiba K. Rapid analysis of protein interactions: On-chip micropurification of recombinant protein expressed in Escherichia coli. Proteomics 2002;2: 1247–1253. [DOI] [PubMed] [Google Scholar]
- 8.Gilligan JJ, Schuck P, Yergey AL. Mass spectrometry after capture and small volume elution of analyte from a surface plasmon resonance biosensor. Anal Chem 2002;74:2041–2047. [DOI] [PubMed] [Google Scholar]
- 9.Nedelkov D, Nelson RW. Delineating protein–protein interactions via biomolecular interaction analysis–mass spectrometry. J Mol Recognit 2003;16:9–14. [DOI] [PubMed] [Google Scholar]
- 10.Lopez F, Pichereaux C, Burlet-Schiltz O, Pradayrol L Nonsarrat B, Esteve J-P. Improved sensitivity of biomolecular interaction analysis mass spectrometry for the identification of interacting molecules. Proteomics 2003;3:402–412. [DOI] [PubMed] [Google Scholar]
- 11.Johnson B, Lofas S, Lindquist G. Immobilization of proteins to a carboxymethyldextran-modified gold surface for biospecific interaction analysis in surface plasmon resonance sensors. Anal Biochem 1991;198:268–277. [DOI] [PubMed] [Google Scholar]
- 12.Kussmann M, Roepstorff P. Sample preparation techniques for peptides and proteins analyzed by MALDI-MS. In Chapman JR (ed): Methods in Molecular Biology, vol. 146. Totowa: Humana Press, 2000:405–424. [DOI] [PubMed]
- 13.Bergquist J, Andersen O, Westman A. Rapid method to characterize mutations in transthyretin in cerebrospinal fluid from familial amyloidotic polyneuropathy patients by use of matrix-assisted laser desorption/ionization time-of-flight mass spectrometry. Clin Chem 2000; 46: 1293–1300. [PubMed] [Google Scholar]
- 14.Russell WK, Park Z-Y, Russell DH. Proteolysis in mixed organic-aqueous solvent systems: Applications for peptide mass mapping using mass spectrometry. Anal Chem 2001; 73:2682–2685. [DOI] [PubMed] [Google Scholar]


