Abstract
The most commonly used method for protein identification with two-dimensional (2D) online liquid chromatography-mass spectrometry (LC/MS) involves the elution of digest peptides from a strong cation exchange column by an injected salt step gradient of increasing salt concentration followed by reversed phase separation. However, in this approach ion exchange chromatography does not perform to its fullest extent, primarily because the injected volume of salt solution is not optimized to the SCX column. To improve the performance of strong cation exchange chromatography, we developed a new method for 2D online nano-LC/MS that replaces the injected salt step gradient with an optimized semicontinuous pumped salt gradient. The viability of this method is demonstrated in the results of a comparative analysis of a complex tryptic digest of the yeast proteome using the injected salt solution method and the semicontinuous pump salt method. The semicontinuous pump salt method compares favorably with the commonly used injection method and also with an offline 2D-LC method.
Keywords: Proteomics, online 2D-LC/MS, 2D-LC/MS, multidimensional LC, yeast proteome
In order to identify proteins from a complex mixture of 5 × 10³ to 5 × 10⁴ with a dynamic range of at least 105, it is crucial to develop technologies that have extremely good resolving power as well as extraordinary sensitivity. The most frequently used high-performance liquid chromatographic approach for the separation of peptides from protein digests in complex proteomics applications is two-dimensional (2D) nano-liquid chromatography–mass spectrometry (LC/MS). In this approach, a strong cation exchange (SCX) column is used for the first dimension and a reversed phase (RP) column for the second.1,2 The sample peptides bound on the SCX columns are then eluted by injected salt solution plugs of increasing concentration, trapped on a short enrichment column, and subsequently analyzed on a nano-RP column.
This method is capable of delivering valuable results for proteomics research. For instance, it has been used successfully in elucidating the yeast proteome and the proteome of other microorganisms.3,4 Even the comprehensive analysis of subproteomes consisting of few proteins in a background of several hundred has recently been achieved.5,6 However, because the injected volume of salt solution is not optimized to the SCX column, the SCX column is cannot work to its fullest potential. This lack of optimization results in the distribution of the peptides over more than one fraction, which can dilute them below their detection level or suppress their ionization in nanoelectrospray by higher abundant peptides in the mass spectrometric analysis.
To overcome these limitations we developed an improved method for online 2D-LC. In this method the optimized semicontinuous salt solution gradient for the elution of the peptides from the SCX column is delivered very precisely with a capillary pump, and the SCX column is always kept under conditions very close to the optimum state. The eluted peptides are trapped rotatory on two enrichment columns and are subjected to RP separation followed by MS/MS analysis. The principle of this method is illustrated in Figure 1.
FIGURE 1.
Principle of 2D nano LC-MS/MS with semicontinuous gradient.
In this paper, the improved method for 2D nano-LC/MS is explained in detail. To show the full performance of the method, a complex tryptic digest of the yeast proteome was analyzed and the results compared with those obtained by analysis using the injected salt solution method in current use as well as an offline 2D LC method.
MATERIALS AND METHODS
Equipment: Agilent (Walbronn, Germany) 1100 Series nanoflow pump with micro-vacuum degasser, 1100 Series thermostatted micro well-plate autosampler, micro 2-position/10-port switching valve box with holder, 1100 Series capillary pump with micro vacuum degasser, 1100 Series LC/MSD Trap XCT with orthogonal nanospray ion source. Software: ChemStation A10.01, Ion Trap Software 4.2, Spectrum Mill MS Proteomics Workbench. Chromatography columns: Agilent BioSCX Series II, 0.30 × 35 mm, 3.5 μm particles; Zorbax 300 SB C18, 75 μm × 150 mm, 3.5 μm particles; Zorbax 300 SB C18, 0.3 mm × 5 mm, 5.0 μm particles.
System Description
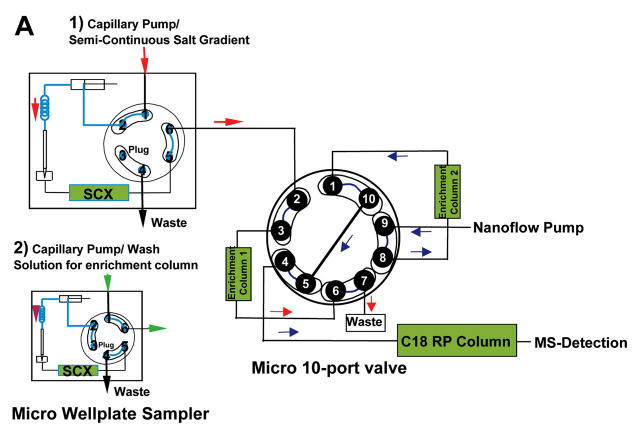
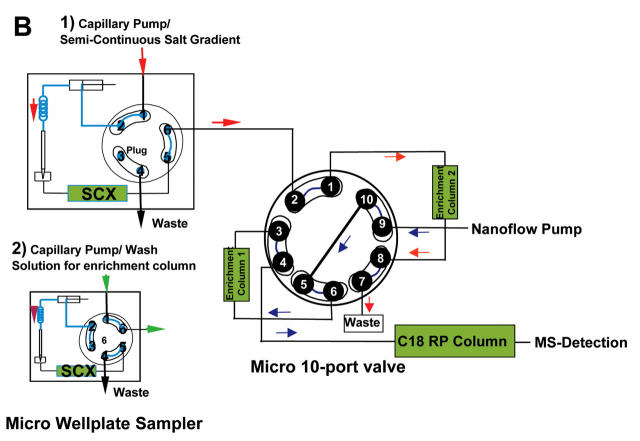
The micro 2-position/10-port valve included in the LC-System (Fig. 2) is connected with two enrichment columns. This valve is also connected directly to the nanoflow pump and to the nanocolumn. The second pump used in the system, the capillary pump, is connected to the micro 2-position/6-port valve in the micro well-plate autosampler, which is also connected with the micro 10-port valve (Fig. 3). The sample peptides retained on the SCX column are eluted stepwise with a semicontinuous salt solution gradient pumped by the capillary pump and subsequently trapped on the enrichment column currently inline with the SCX column (Fig. 3A-1). Each step of the semicontinuous salt solution gradient starts with the end concentration of the foregoing step and ends with the starting concentration of the following step. After each step the SCX column is bypassed by switching the micro valve in the autosampler (Fig. 3A-2) to retain the current salt concentration in the SCX column. In this state the enrichment column is still inline with the capillary pump, which starts to pump water to wash out salt residues from the capillaries and the enrichment column prior to the RP separation and the MS analysis. The salt-free enrichment column is then switched into the nanoflow path and exchanged with the second enrichment column, also located at the micro 10-port valve, and the cycle starts over again (Fig. 3B).
FIGURE 2.
Nano LC/MS system for online 2D LC/MS with semicontinuous gradient for proteomics applications.
FIGURE 3.
Flow diagram for semicontinuous gradient in online nano 2D LC. A1: Continuous salt elution from SCX column on enrichment column. A2: Bypassing of SCX column, washing of enrichment column 1, and analysis of peptides from enrichment column 2. B1: Continuous salt elution from SCX column on enrichment column 2. B2: Bypassing of SCX column, washing of enrichment column 2, and analysis of peptides from enrichment column 1.
Chromatographic Method
For the chromatographic separation in the first- and second dimension it is necessary to set up two different methods, one for the SCX chromatography and another one for the RP separation. The semicontinuous salt solution gradient for the elution of the peptides from the SCX column is delivered from the capillary pump and the gradient for the RP separation is delivered from the nanoflow pump (Fig. 4). The nanoflow gradient starts with 5% acetonitrile and increases up to 65% acetonitrile with a slope of 1%/min for each RP analysis. The salt gradient is pumped in steps beginning at 0% to 2.5% of a 500- mM NaCl solution for the first step. The following steps start with the end concentration of the foregoing step and end with the starting concentration of the following step. The salt solution gradient is developed for 15 min in each step and then, prior to the washing step, the SCX column is switched to bypass with the micro 6-port valve in the autosampler to retain the current condition. Therefore, each step contributes to a semicontinuous salt gradient on the SCX column (Fig. 4).
FIGURE 4.
Control method of the 2D online semicontinuous gradient LC. Blue: Reversed phase gradient. Brown: semicontinuous salt solution gradient.
To obtain a good separation for the majority of peptides eluting at lower salt concentration, the slope is shallower in this area and steeper in the area of higher salt concentrations. The micro 6-port valve in the autosampler switches the SCX column into the salt solution flow at the beginning of each step and switches the SCX column to bypass at the and of each salt step (Figure 4). At the starting point of each RP analysis cycle the charged enrichment column is exchanged against the empty one by a switch of the micro 10-port valve (Fig. 3). The detailed gradient settings for the SCX and the RP chromatography, the valve switching points for the autosampler micro 6-port valve, and the micro 10-port valve are outlined in Table 1.
TABLE 1.
Detailed Gradient Settings for the Strong Cation Exchange and the Reverse Phase Chromatography: Valve Switching Points for the Autosampler Micro 6-Port Valve and the Micro 10-Port Valve
| NANOFLOW PUMP | |||||||||||||||||||||
| Time [min] | 0 | 10 | 70 | 70.01 | 85 | 145 | 145.01 | 160 | 220 | 220.01 | 235 | 295 | 295.01 | 310 | 370 | 370.01 | 385 | ||||
| % Solvent B | 5 | 5 | 65 | 5 | 5 | 65 | 5 | 5 | 65 | 5 | 5 | 65 | 5 | 5 | 65 | 5 | 5 | ||||
| Time [min] | 445 | 445.01 | 460 | 520 | 520.01 | 535 | 595 | 595.01 | 610 | 675 | 675.01 | 685 | 745 | 745 | 760 | 820 | 820.01 | ||||
| % Solvent B | 65 | 5 | 5 | 65 | 5 | 5 | 65 | 5 | 5 | 65 | 5 | 5 | 65 | 5 | 5 | 65 | 5 | ||||
| CAPILLARY PUMP | |||||||||||||||||||||
| Time [min] | 0 | 15 | 15.01 | 30 | 30.01 | 90 | 90.01 | 105 | 105.01 | 165 | 165.01 | 180 | 180.01 | 240 | 240.01 | 255 | 255.01 | 315 | 315.01 | 330 | 330.01 |
| % Solvent B | 0 | 0 | 0 | 2.5 | 0 | 0 | 2.5 | 5 | 0 | 0 | 5 | 7.5 | 0 | 0 | 7.5 | 10 | 0 | 0 | 10 | 15 | 0 |
| Time [min] | 390 | 390.01 | 405 | 405.01 | 465 | 465.01 | 480 | 480.01 | 540 | 540.0 | 555 | 555.01 | 615 | 615.01 | 630 | 630.01 | 690 | 690.01 | 705 | 705.01 | 820.01 |
| % Solvent B | 0 | 15 | 20 | 0 | 0 | 20 | 30 | 0 | 0 | 30 | 50 | 0 | 0 | 50 | 100 | 0 | 0 | 100 | 100 | 0 | 0 |
| 10-PORT VALVE | |||||||||||||||||||||
| Switch Position | 1 | 2 | 1 | 2 | 1 | 2 | 1 | 2 | 1 | 2 | 1 | 2 | |||||||||
| Time [min] | 0 | 10 | 85 | 160 | 235 | 310 | 385 | 460 | 535 | 610 | 685 | 760 | |||||||||
| MICRO WELL-PLATE AUTOSAMPLER 6-PORT VALVE | |||||||||||||||||||||
| Mainpass time [min] | 0 | 90 | 165 | 240 | 315 | 390 | 465 | 540 | 615 | 695 | 765 | ||||||||||
| Bypass time [min] | 30 | 105 | 180 | 255 | 330 | 405 | 480 | 555 | 630 | 705 | |||||||||||
Nanoflow Pump
The solvents are A = water + 0.1% formic acid and B= acetonitrile + 0.1% formic acid. The primary flow is 200–500 μL/min, and the column flow is 300 nL/min. The stop time is 825 min and post time is 15 min.
Capillary Pump
The solvents are A = water + 3% acetonitrile + 0.1% formic acid and B = 500 mM NaCl + 3% acetonitrile + 0.1% formic acid. The primary flow is 500–800 μL/min, and the column flow 10 μL/min.
MS Conditions
The ionization mode is positive nanoelectrospray with an Agilent orthogonal source. Drying gas flow is 5 L/min and drying gas temperature is 300°C. Vcap is typically 1800–2000 V, skim 1 is 30 V, and capillary exit offset is 75 V. The trap drive is 85 V with averages of 1 or 2. ICC is on; maximum accumulation time is 150 ms, smart target is 125,000, and MS scan range is 300–2200.
Automatic MS/MS is in peptide scan mode, with the number of parents 3 or 4, averages of 2, fragmentation amplitude of 1.3 V, SmartFrag on (30–200%), active exclusion on (after 2 spectra for 1 min), prefer +2 on, MS/MS scan range of 100–1800, and ultra scan on.
Sample Preparation
Lyophilized yeast cells (Saccharomyces cerevisiae), resuspended in cooled 50 mM NH4HCO3 containing 8 M urea, were disrupted in a bead beater with 0.5 mm glass beads (Bead beater, BioSpec Products, Bartlesville, OK). After centrifugation to remove cell debris, proteins in the supernatant were reduced with 1 mM DTT at 37°C for 1 h, alkylated in the dark with 10 mM iodoacetamide for 30 min at RT, ultrafiltrated for buffer exchange, and tryptically digested with TPCK trypsin at 37°C for 16 h. Finally, the sample was lyophilized in a SpeedVac (Bachofer, Reutingen, Germany) and dissolved in 5% acetonitrile, 0.03% formic acid prior to analysis.
RESULTS AND DISCUSSION
For the regular online 2D LC method, which is working with an injected salt step gradient, the peptide MS/MS spectra obtained from a single salt step elution are stored individually. Hence, a complete 2D LC/MS run yields as many data files as fractions are taken. In contrast, during the newly developed semicontinuous 2D LC run, all MS/MS data are saved into one single data file. Therefore, the whole 820-min run can be displayed in one chromatogram (Fig. 5). As an example, a whole yeast proteome digest was subjected to analysis with this technique. The obtained base peak chromatogram (Fig. 5) indicates that, besides the peptides in the unbound fraction, the majority of the peptides are eluted in the semicontinuous salt gradient up to a salt concentration of 100 mM. Therefore, this concentration range was divided into smaller salt elution steps and the region from 100 mM up to 500 mM into larger salt elution intervals. There are only a few remaining strongly binding peptides that require high salt concentrations for elution.
FIGURE 5.
Base peak chromatogram obtained from separation of a yeast proteome digest with online 2D LC working with semicontinuous salt gradient and subsequent nano reversed phase chromatography.
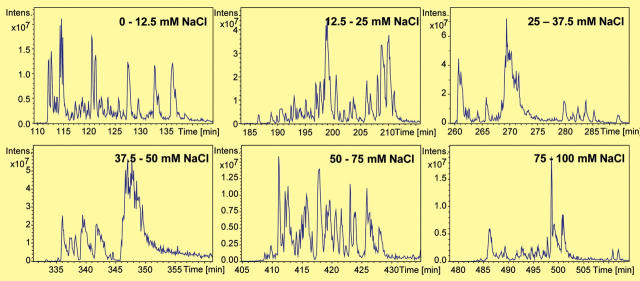
Figure 6 shows the magnified base peak chromatograms obtained after RP separation for all semicontinuous salt elution steps up to 100 mM. The peptides resulting from each salt step are separated within 30 min in subsequent RP gradient runs. In the same time frame the associated MS/MS spectra necessary for the database search are acquired.
FIGURE 6.
Base peak chromatograms obtained after reversed phase separation for the semicontinuous salt elution steps up to 100 mM.
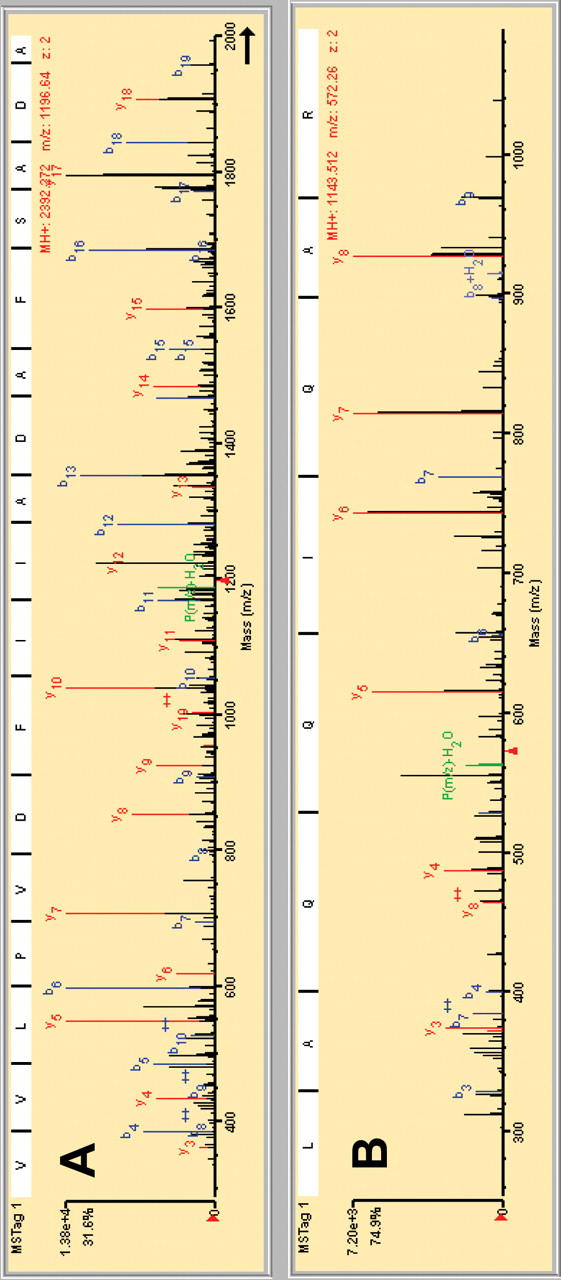
During the entire run time more than 30,000 MS/MS spectra were recorded. From those spectra only the peptide MS/MS spectra were extracted with the spectra extractor of the Spectrum Mill software within a few minutes. After the subsequent database search and validation of the obtained protein hits, 122 proteins were identified with high confidence. The 21 top score proteins are presented in Table 2. Their resulting score indicates high-quality MS/MS spectra and a high percentage of sequence coverage. Despite of the fact that only a few peptides were identified for proteins at the end of the list (positions 120–222), the quality of the corresponding MS fragmentation spectra are still sufficiently convincing for the unequivocal identification of the corresponding proteins. To provide an estimate of the reliability of the identified proteins obtained from database search, exemplary MS/MS spectra are shown for peptides identified for the first and last protein from the score hit list. The tryptic peptide (GVE)VVLPVDFIIADAFSADA(NTK), which according to the top score is protein phosphoglycerate kinase, shows a complete fragmentation pattern with all y- and b-series ions (Fig. 7A). The same holds true for the fragmentation pattern of a tryptic peptide (SQ)LAQQIQAR from protein hit number 120, polyadenylate-binding protein (Fig. 7B).
TABLE 2.
Twenty-one Top Score Proteins and Three Proteins from the End of the Significant Hit Area Identified from a Yeast Cell Lysate Analyzed with Online Semicontinuous Gradient 2D LC/MS
| Hit no. | Protein name | Score | Peptides | Spectra (no.) | % AA coverage | Protein MW (Da) | Protein pI |
| 1 | Phosphopyruvate hydratase | 142.37 | 8 | 78 | 29 | 46802.3 | 6.16 |
| 2 | Phosphoglycerate kinase | 137.35 | 9 | 29 | 33 | 44738.6 | 7.11 |
| 3 | Pyruvate kinase | 115.12 | 7 | 9 | 28 | 54599 | 8.00 |
| 4 | Pyruvate decarboxylase | 112.05 | 7 | 8 | 21 | 61495.7 | 5.80 |
| 5 | Reading frame | 84.38 | 4 | 114 | 28 | 35731.9 | 6.46 |
| 6 | Heat-shock protein 26 kDa | 84.12 | 5 | 9 | 30 | 23879.7 | 5.32 |
| 7 | Aldehyde dehydrogenase | 72.17 | 5 | 6 | 18 | 56723.9 | 6.31 |
| 8 | Hexokinase A | 71.71 | 4 | 6 | 14 | 53738.7 | 5.28 |
| 9 | Alcohol dehydrogenase I | 57.18 | 4 | 12 | 16 | 36823.3 | 6.26 |
| 10 | Triosephosphate isomerase | 49.69 | 4 | 4 | 30 | 26795.6 | 5.74 |
| 11 | Ketol-acid reductoisomerase | 46.82 | 3 | 3 | 12 | 44368.7 | 9.11 |
| 12 | Phosphoglycerate mutase | 44.71 | 3 | 4 | 19 | 27608.7 | 8.81 |
| 13 | 60S ribosomal protein L4-B | 38.32 | 3 | 3 | 17 | 39062.2 | 10.64 |
| 14 | Glucose kinase | 35.38 | 2 | 2 | 7 | 55377.7 | 5.80 |
| 15 | Hexokinase PII | 33.32 | 2 | 2 | 14 | 27485.6 | 5.19 |
| 16 | Pyrophosphatase | 32.77 | 3 | 3 | 11 | 32315.8 | 5.36 |
| 17 | 60S ribosomal protein L5 | 31.08 | 2 | 2 | 13 | 33743 | 6.36 |
| 18 | BMH1 | 29.17 | 2 | 4 | 15 | 30176.6 | 4.87 |
| 19 | Translation elongation factor eEF-1 | 28.39 | 2 | 10 | 7 | 50032.9 | 9.14 |
| 20 | Citrate (si)-synthase | 25.16 | 2 | 2 | 5 | 53360.3 | 8.23 |
| 21 | Superoxide dismutase | 24.66 | 2 | 2 | 27 | 15854.7 | 5.62 |
| 120 | Polyadenylate-binding protein | 9.10 | 1 | 1 | 1 | 64344.5 | 5.71 |
| 121 | Ribosomal protein S15 | 9.06 | 1 | 1 | 13 | 16001.9 | 10.70 |
| 122 | Ribosomal protein S14 | 9.03 | 1 | 1 | 7 | 14649.8 | 10.54 |
FIGURE 7.

Fragmentation pattern of a tryptic peptide from phosphoglycerate kinase (A) and polyadenylate-binding protein (B).
To evaluate this new methodology, the results obtained by the semicontinuous salt gradient approach were compared with those obtained by the conventional injected salt step gradient as well as with those obtained by high resolution off-line 2D methodology, which also works with a linear continuous salt gradient elution in the first dimension.7 For this comparison, sample and columns used were identical. Salt steps for the online 2D LC, the semicontinuous 2D LC, and the linear gradients with fraction collection for the offline 2D LC were adjusted so that they covered comparable salt concentration ranges. The results of these experiments are summarized in Table 3. The number of identified proteins as well as the number of corresponding peptides increased from the injected step gradient approach to the semicontinuous gradient approach. It is also evident that the off-line methodology is superior to the on-line variants, which is related to higher investment efforts for instrumentation. These results demonstrate clearly the significant improvement which can be achieved with slight modifications of the instrumental system setup and the elaborated 2D LC protocol.2
TABLE 3.
Protein Hits and Corresponding Peptides Identified from an Analysis of a Yeast Cell Lysate with Different 2D LC/MS Methods
| Method | Online 2D LC with injected salt steps | Online 2D LC with pumped semicontinuous salt gradient | Off-line 2D LC with pumped continuous salt gradient |
| Identified proteins | 101 | 122 | 144 |
| Assigned peptides | 179 | 207 | 269 |
CONCLUSION
In this work we demonstrate that the performance of the classical approach of 2D LC/MS for protein identification, which works with injected salt solution plugs of increasing concentration to elute peptides of digested proteome samples from the first dimension SCX column, can be improved significantly. This improvement can be attributed mainly to the semicontinuous salt solution gradient, which keeps the SCX column in an optimum state during peptide elution of the first dimension. In this state, peptides elute in much sharper peaks and therefore lower abundant proteins are identified more easily. To utilize this effect only a minor hardware investment is necessary—mainly a precise second pump and a micro 10-port valve with two enrichment columns. Table 4 shows a summary of the semicontinuous gradient online 2D LC method in comparison to the injected step gradient on-line 2D LC method and to the offline 2D LC method.
TABLE 4.
Comparison of Different 2D LC/MS Methods
| Method | Online 2D LC with injected salt steps | Online 2D LC with pumped semicontinuous salt gradient | Off-line 2D LC with pumped continuous salt gradient |
| SCX Resolution | low | high | very high |
| Automation | high | high | medium |
| Complexity of set-up | medium | high | medium |
| Investment | low | medium | high |
| Effort | medium | medium | high |
| Access to SCX fractions | no | no | yes |
| Flexibility | low | low | high |
The described method offers the opportunity to analyze real-life proteomics samples with high complexity in a highly automated manner with maximum results. Moreover, this approach has the potential for further improvement by the adaptation of the method to a true continuous salt gradient for the first dimension SCX chromatography.
REFERENCES
- 1.Davis MT, Beierle J, Bures ET, McGinley, et al. Automated LC-LC—MS-MS platform using binary ion-exchange and gradient reversed-phase chromatography for improved proteomic analyses. J Chromatogr B 2001;752:281–291. [DOI] [PubMed] [Google Scholar]
- 2.Nägele E, Vollmer M, Hörth P. Two-dimensional nano-liquid chromatography-mass spectrometry system for applications in proteomics. J Chromatogr A 2003;1009:197–205. [DOI] [PubMed] [Google Scholar]
- 3.Washburn MP, Wolters D, Yates III JR. Large-scale analysis of the yeast proteome by multidimensional protein identification technology. Nat Biotechnol 2001;19:242–247. [DOI] [PubMed] [Google Scholar]
- 4.Florens L, Washburn MP, Raine JD, et al. A proteomic view of the Plasmodium falciparum life cycle. Nature 2002;419:520–526. [DOI] [PubMed] [Google Scholar]
- 5.Vollmer M, Nägele E, Hörth P. Differential proteome analysis: Two-dimensional nano LC/MS of E. coli proteome grown on different carbon sources. J Biomol Techn 2003; 14: 128–135. [PMC free article] [PubMed] [Google Scholar]
- 6.Hörth P, Nägele E, Vollmer M. Proteome profiling of E. coli: Effect of heat-shock conditions on protein expression pattern. LC/GC Europe 2003;16:641–647. [Google Scholar]
- 7.Moritz R. Vollmer M. Nägele E. On-line and off-line 2D LC-ESI-MS/MS methods in proteomic analysis. Pharmagenomics 2004; accepted for publication.


