Abstract
In an effort to simplify a complex mixture of soluble proteins from Escherichia coli, methods to fractionate the samples prior to two-dimensional (2D) gel electrophoresis were developed. These methods involve the use of DEAE-Sepharose, SP-Sepharose, and phenyl Sepharose chromatographic columns and the fractionation of the protein mixtures based on differential anionic, cationic, and hydrophobic properties of the proteins, respectively. Fractionation of the soluble proteins from an E. coli extract with DEAE-Sepharose resulted in a threefold increase in the number of detectable 2D gel spots. These gel spots were amenable to protein identification by using in-gel trypsin digestions, matrix-assisted laser desorption/ionization time-of-flight mass spectrometry, and peptide mass fingerprinting. Significantly, the DEAE-Sepharose column fractionation effectively partitioned the soluble proteins from the cell extracts. Similarly, an SP-Sepharose column was used to fractionate the soluble proteins from E. coli and resulted in over a twofold increase in the number of detectable gel spots. Lastly, fractionation of the cell extract with the phenyl Sepharose column resulted in a threefold increase in the number of detectable 2D gel spots. This work describes an easy, inexpensive way to fractionate the soluble proteins in E. coli and a way to better profile the E. coli proteome.
Keywords: E. coli, fractionation, DEAE-Sepharose, SP-Sepharose, phenyl Sepharose
Progress in genomics has not only dramatically revolutionized our understanding of the number and nature of genes but has also opened the door for a global and comprehensive study of cellular components and metabolic pathways. Efforts have been made to analyze the levels of gene expression by using microarrays and DNA chip methods.1 Specifically, DNA array data have been used to profile the levels of mRNA within a particular cell type. However, gene expression is very complex, and the direct correlation of mRNA levels to the protein content is not often possible.2
Proteomics, which traditionally involved the use of two-dimensional (2D) gels to display large sets of proteins, has become increasingly popular as it integrated the use of mass spectrometry (MS) and database searching to identify the proteins corresponding to 2D gel spots.1 However, because of the heterogeneity of samples and the large differences in relative protein concentrations, the detection and identification of all of the proteins in a proteome is still a challenge. Recently, there have been efforts to develop better identification and quantification methods for the large number of proteins present in 2D gels. The development of easy, yet effective, sample fractionation methods prior to isoelectric focusing (IEF) on immobilized pH gradient (IPG) strips has become a focus area.3–7
Different approaches have been taken to improve the resolution and the level of detection in 2D gels. Narrow-range IPG strips and larger-sized gels have been used to improve the resolution and separation of gel spots.8–10 To address the issue of protein detection levels, fractionation strategies such as cellular localization11 and anion exchange chromatography12 have been used to simplify cell extracts before electrophoresis. Herein, we describe an approach to fractionating Escherichia coli cell extracts before 2D gel electrophoresis (2DGE) by using different chromatographic columns, which separate proteins in terms of their ionic and hydrophobic properties.
MATERIALS AND METHODS
Materials
Diethylaminoethyl (DEAE) Sepharose, sulfopropyl (SP) Sepharose, and phenyl Sepharose were purchased from Amersham Biosciences (Piscataway, NJ). d-(+)-Glucose and bovine serum albumin were procured from Sigma (St. Louis, MO). All other chemicals were obtained from Fisher Scientific (Liberty Lane Hampton, NH). Immobilized pH gradient strips, carrier ampholytes, ReadyPrep 2-D Cleanup Kit, Bio-Rad Protein Assay Dye, and Criterion Precast Gels were purchased from Bio-Rad (Hercules, CA).
Preparation of Soluble Protein Extracts from E. coli
A 50-mL culture of E. coli BL21 (DE3) was grown overnight in minimal media13 by shaking at 37°C. The minimal media contained 2.5 g/L d-(+)-glucose; 5 g/L casamino acids; 10.8 g/L K2HPO4; 5.5 g/L KH2PO4; 10 g/L NaCl; 1 g/L (NH4)2SO4; 2 mg/L thiamine; 1 mg/L biotin; and 1 mL/L of metal mix containing 124 mg/mL MgSO4 • 7H2O, 74 μg/mL CaCl2 • 2H2O, 20 μg/mL MnCl2 • 4H2O, 31 μg/mL H3BO3, 1.2 μg/mL (NH4)6Mo7O24 • 4H2O, and 1.6 μg/mL CuSO4. This preculture was used to inoculate 8 × 1-L cultures containing the minimal media. Cells were grown by shaking the culture flasks at 37°C for 3 h and were harvested by centrifugation for 15 min at 8275 g. The cell pellets were resuspended in 15 mL of 50 mM Tris-HCl, pH 7.5, and lysed by two passages through a French press at 16,000 psi. The cell debris was removed by centrifugation for 15 min at 32,583 g. A Bradford protein assay was used to quantitate proteins using Bio-Rad Protein Assay Dye.14
Fractionation with DEAE Sepharose
The DEAE-Sepharose column was made by packing 5 mL of DEAE-Sepharose resin into a 1.0 × 10-cm Flex-column. The resin bed was washed with five volumes of water and about 10 volumes of column buffer A (25 mM Tris-HCl, pH 7.5, containing 0.5% Tween 20 and 10% glycerol). The cell extract containing not more than 100 mg of total protein was then loaded onto the column, and the flow-through fraction was collected. The column was then washed with two column volumes of column buffer A. Bound proteins were eluted with 6 mL of 25-mM Tris-HCl, pH 7.5, containing 10% glycerol and 0.15 M NaCl and then with 6 mL of 25-mM Tris-HCl, pH 7.5, containing 10% glycerol and 1.0 M NaCl. The resulting fractions were collected and used in subsequent steps.
Fractionation with SP-Sepharose
An SP-Sepharose column was made by packing 3 mL of SP-Sepharose resin into a 0.7 × 10-cm Flex-column. The resin bed was washed with 5 column volumes of water and 10 column volumes of 50 mM Tris-HCl, pH 7.0. A cell extract containing not more than 50 mg of total protein was then loaded onto the column, and the flow-through was collected. The column was then washed with two column volumes of 50 mM Tris-HCl, pH 7.0. Bound proteins were eluted from the column with 6 mL of 50 mM Tris-HCl, pH 7.0, containing 1 M NaCl.
Fractionation with Phenyl Sepharose
A phenyl Sepharose column was made by packing 3 mL of phenyl Sepharose resin into a 0.7 × 10-cm Flex-column. The resin bed was washed with 5 column volumes of water and 10 column volumes of 50 mM Tris-HCl, pH 7.5, containing 1.0 M (NH4)2SO4. A fraction of proteins from a cell extract containing not more than 50 mg of total protein was precipitated by making the solution 2.0 M in (NH4)2SO4. The precipitate was separated by centrifugation, the supernatant was loaded onto the equilibrated phenyl Sepharose column, and the flow-through was discarded. The column was then washed with two column volumes of 50 mM Tris-HCl, pH 7.5, containing 1.0 M (NH4)2SO4. Bound proteins were eluted from the column with 6 mL of 50 mM Tris-HCl, pH 7.5.
Acetone Precipitation and Sample Cleanup for 2D Gels
The sample (not less than 0.1 mg/mL) to be precipitated was mixed with an equal volume of prechilled acetone at −20°C, and the tube was vortexed to mix the sample. The mixture was incubated on ice for 30 min and was centrifuged at top speed in a refrigerated microfuge for 30 min. The pellet was dried and resuspended very thoroughly in IEF sample buffer containing containing 8 M urea, 50 mM dithiothreitol, 4% CHAPS, 0.2% carrier ampholytes, and 0.0002% bromophenol blue. A 500-μg sample was used in the gel cleanup procedure using BioRad’s ReadyPrep 2-D Cleanup Kit.
Isoelectric Focusing and Second Dimension SDS-PAGE Gel Electrophoresis
Protein samples (100–300 μg) were dissolved in rehydration/sample buffer containing 8 M urea, 50 mM dithiothreitol, 4% CHAPS, 0.2% carrier ampholytes, and 0.0002% bromophenol blue. Isoelectric focusing was conducted on 11-cm IPG strips (pH 4–7) by using a Protean IEF Cell (Bio-Rad). These samples required 80,000–100,000 volt-hours for optimum focusing. After focusing, the IPG strips were stored at −80°C until used in subsequent steps. A conditioning step was conducted by treating the strips in equilibration buffer I (6 M urea, 2% SDS, 0.05 M Tris-HCl, pH 8.8, 20% glycerol, and 2% dithiothreitol) and equilibration buffer II (6 M urea, 2% SDS, 0.05 M Tris-HCl, pH 8.8, 20% glycerol, and 2.5% iodoacetamide). The second dimension SDS-PAGE gel was run by using Criterion Precast Gels (Tris-HCl, 8–16% resolving, 4% stacking), and the gels were stained with Coomassie blue.
Imaging and Image Analysis
Images of gels were collected by using the VersaDoc Imaging System (Bio-Rad) and analyzed by using the PDQuest 2-D Analysis Software 7.1.1 (BioRad). The number of protein spots was ascertained by using the Spot Detection Wizard in the PDQuest software package.
In-Gel Trypsin Digestions, MALDI-MS Analyses, and Database Searching
Protein spots were excised and vortexed with 100 μL of 25 mM NH4HCO3/50% acetonitrile solutions for 10 min. This step was repeated at least twice before drying the gels completely by using a Speed Vac (Savant Instruments, Holbrook, NY). The dried gel pieces were then treated with 25 μL of 10 mM dithiothreitol in 25 mM NH4HCO3 and incubated at 56°C for 1 h. The supernatant was removed, 25 μL of 55 mM iodoacetamide was added onto the gels, and the mixture was incubated at room temperature for 45 min in the dark. The supernatants were discarded, the dried gel pieces were treated with 25 μL of 12.5 ng/μL trypsin in 25 mM NH4HCO3, and the mixtures were incubated overnight at 37°C. The supernatants from the trypsin-digested mixtures were collected in separate tubes, and peptides were extracted twice by treating the gel pieces with 30 μL 50% acetonitrile/5% formic acid and centrifuging the samples for 5 min. The extract was dried to a 10-μL volume by using a Speed Vac.
A 2-μL sample of the peptide extract was mixed with 2 μL of 10 mg/mL α-cyano-4-hydroxycinnamic acid in 50% acetonitrile/0.05% trifluoroacetic acid, and 2 μL of this mixture was loaded onto a matrix-assisted laser desorption/ionization (MALDI) target. A Bruker Reflex III MALDI-MS instrument was employed for MALDI-time-of-flight (TOF)-MS analysis of trypsin-digested peptides. The instrument was calibrated by using angiotensin II (human) with an m/z value of 1046.5423 and ACTH fragment 18–39 (human) with an m/z value of 2465.1989. Both of the standard peptides were obtained from Sigma. Mass spectra were obtained by setting the instrument in reflectron mode with reflectron detector voltage of 1.45 kV. Spectra were collected in the m/z range of 1000–2600 Da. Peptide mass fingerprints obtained by MALDI-TOF analysis were used to search E. coli databases in SWISS-PROT (http://us.expasy.org) and NCBI and GenBank (www.ncbi.nlm.nih.gov), and assigned using ProFound (http://prowl.rockefeller.edu) and MASCOT (www.matrixscience.com). The parameters used for the searches were as follows: variable modifications were considered (cysteine as the S-carboamidomethyl derivate and methionine in oxidized form); up to two missed cleavage sites were allowed; and restriction was placed on pI range 4–7. At least five peptides, representing a minimum of 20% sequence coverage, were considered as the minimum criteria for protein identity.
RESULTS AND DISCUSSION
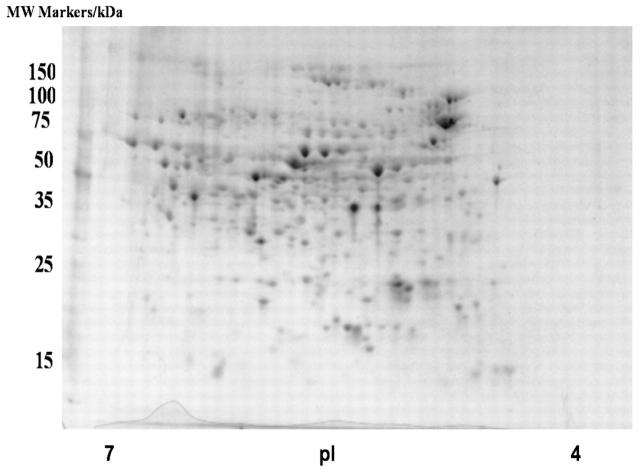
Recently, we have been using proteomics to profile E. coli protein expression in different growth media and in the presence/absence of certain metabolites. It has been predicted that the E. coli K-12 genome consists of 4288 protein-coding genes,15 making the profiling of all of these proteins with 2D gels a daunting task. For example, the 2D gel of E. coli proteins, grown in a chemically defined medium and isoelectrically focused on IPG strips between pH 4-7, contains 258 distinct gel spots (Fig. 1, Table 1). To check the quality of spots on the 2D gel, we conducted in-gel trypsin digestions, MALDI-TOF-MS analyses, and peptide identifications on several random spots (Table 2).
FIGURE 1.
Two-dimensional gel image of soluble proteins in E. coli BL21(DE3) with no fractionation steps.
TABLE 1.
Total Number of Proteins Detected in 2D Gels
| Technique | No. of Resolved Spots in 2D Gels |
| Cell lysate without fractionation | 258 |
| Fractionation with DEAE-Sepharose | 884 |
| Fractionation with SP-Sepharose | 683 |
| Fractionation with Phenyl Sepharose | 748 |
TABLE 2.
Proteins Identified from 2D Gels of Unfractionated Soluble Proteins from E. coli
| Protein | Size (kDa) |
| Putative protease maturation protein | 68.1 |
| Fructose-bisphosphate aldolase | 42.6 |
| Elongation factor Tu | 41.7 |
| Phosphoglycerate kinase | 43.4 |
| ADP-l-glycero-d-mannoheptose-6-epimerase | 34.9 |
| Outer membrane protein precursor | 35.0 |
| Adenylate kinase | 25.7 |
| Ribosome releasing factor | 20.6 |
| Ribomosal protein L9 | 15.6 |
| Protein chain elongation factor EF-TS | 30.5 |
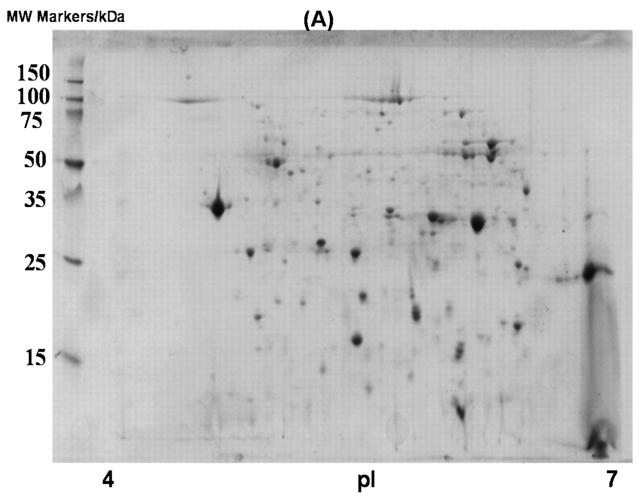
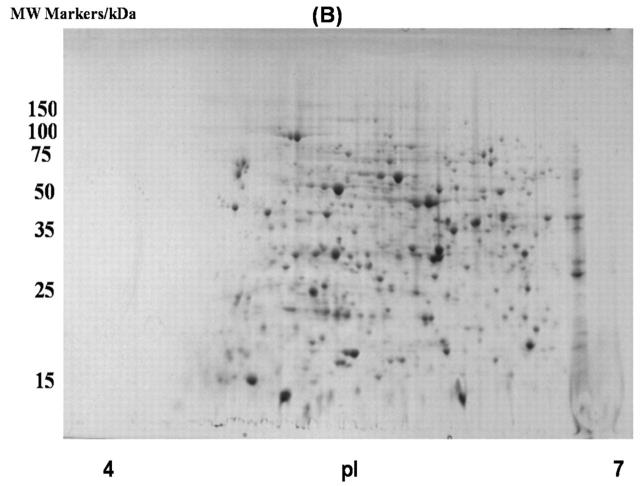
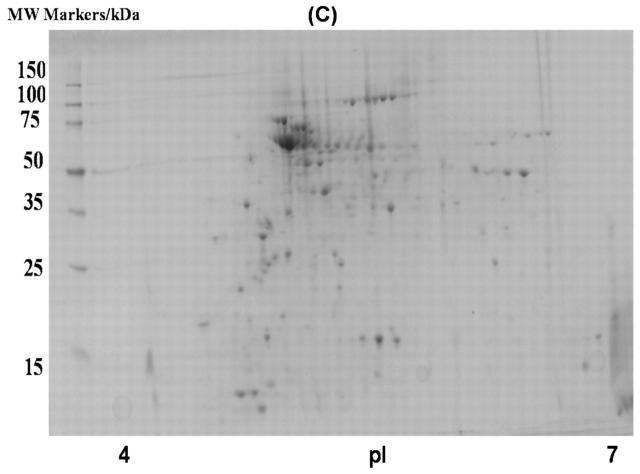
In an effort to screen a larger portion of the E. coli proteome (proteins with pI values between 4 and 7), the soluble E. coli extract was subjected to fractionation with DEAE-Sepharose chromatography. DEAE-Sepharose, which is a weak anion exchange resin, was used to separate proteins based on charge. Three fractions from this column were analyzed with 2D gels: (1) a flow-through fraction, which contained proteins that do not bind to the column; (2) a fraction containing weakly bound proteins that eluted from the column at 0.15 M NaCl; and (3) a fraction with more tightly bound proteins that eluted from the column at 1 M NaCl (Fig. 2). Fractionation by using a DEAE-Sepharose column was very effective, as each fraction contained roughly equal number of proteins (Table 3). In addition, the overlapping of proteins in 2D gels was negligible. Out of 50 proteins identified by MALDI-TOF-MS analyses, only one protein was found in 2 gels (Tables 4–6), indicating an effective partitioning of the E. coli culture. A total of 884 protein spots from the 2D gels (pH 4–7) of the three fractions after DEAE-Sepharose chromatography were detectable (Tables 1 and 3).
FIGURE 2.
Two-dimensional gel images of soluble proteins in E. coli BL21(DE3) with DEAE-Sepharose fractionation. A: Flow-through fraction; B: fraction eluted with 0.15 M NaCl; and C: fraction eluted with 1 M NaCl.
TABLE 3.
Summary of DEAE-Sepharose Fractionations
| No. of Spots | ||||
| Resin | Flow-Through Fraction | 0.15 M NaCl Fraction | 1 M NaCl Fraction | Total Spots Detected |
| DEAE Sepharose | 293 | 320 | 271 | 884 |
TABLE 4.
Proteins Identified in Flow-Through Fraction of DEAE- Sepharose Column
| Protein | Size (kDa) |
| Putative carbamoyl transferase | 44.0 |
| Putative lipoprotein | 29.4 |
| PTS system protein HPr | 9.1 |
| Hypothetical protein gi/15800156/ | 19.0 |
| High affinity glycine betaine/proline transport system protein | 36.0 |
| Proteolytic product of outer membrane protein 3a | 37.1 |
| Outer membrane protein (ompa) | 18.7 |
| Outer membrane protein (ompx) | 16.3 |
| Protein I, membrane | 37.1 |
| Putative oxidoreductase | 44.3 |
| Arginine 3rd transport system periplasmic binding protein | 26.8 |
| Chain A, manganese superoxide dismutase | 22.9 |
| Glycine betaine-binding periplasmic protein precursor | 37.5 |
| RNA polymerase sigma-subunit | 68.9 |
| Unnamed protein product gi/434012/ | 50.7 |
| OppA | 60.8 |
TABLE 6.
Proteins Identified from 1.0 M NaCl fraction of DEAE-Sepharose Column
| Protein | Size (kDa) |
| Chain B, carbamoyl phosphate synthase | 41.0 |
| Chain A, intact elongation factor from E coli gi/4699821/ | 43.1 |
| Chain a, amino terminal domain of Enzyme I (gi/1942893/) | 28.1 |
| Thioredoxin reductase | 34.0 |
| RNA polymerase, alpha subunit | 36.4 |
| Chain A of groEL-groES (HSP 60 class chaperone) | 55.1 |
| Chaperone HSP 70 | 79.0 |
| Trp repressor binding protein | 18.8 |
| Chain A, Dsba | 21.1 |
| Unknown protein gi/11527920/ | 18.6 |
To extend our work of developing a good fractionation technique for soluble proteins of E. coli, other available chromatographic resins were tested. A strong cation exchange resin, SP-Sepharose, was employed to fractionate the soluble proteins of E. coli. Two fractions were obtained from the SP-Sepharose column: (1) a flow-through fraction that contained proteins that do not bind to the column, and (2) a fraction containing all bound proteins that eluted from the column at 1 M NaCl. The fractions were subjected to acetone precipitation and a gel cleanup procedure and analyzed with 2D gels (Fig. 3). A total of 380 proteins were detected in flow-through fraction, which was comparable to 303 proteins detected from the fraction eluted with 1 M NaCl (Table 7). This fractionation technique, like the DEAE column, increased the number of proteins that can be screened with 2D gels (Table 1).
FIGURE 3.
Two-dimensional gel images of soluble proteins in E. coli BL21(DE3) with SP-Sepharose fractionation: A: Flow-through fraction; B: fraction eluted with 1 M NaCl.
TABLE 7.
Summary of the Result of SP-Sepharose Fractionations
| No. of Spots | |||
| Resin | Flow-Through Fraction | 1 M NaCl Fraction | Total Spots Added Together |
| SP Sepharose | 380 | 303 | 683 |
Phenyl Sepharose chromatography was also used to separate soluble E. coli proteins based on differential hydrophobicities. Two fractions were isolated using the phenyl Sepharose procedure that is described in the Materials and Methods section. The efficiency of the fractionation was ascertained by running and analyzing 2D gels (Fig. 4). A total of 342 proteins were detected in the 2D gel of the fraction precipitated with 2 M (NH4)2SO4, and 406 gel spots were detected from the fraction eluted from the column (Table 8).
FIGURE 4.
Two-dimensional gel image of soluble proteins in E. coli BL21(DE3) with phenyl Sepharose fractionation. A: Fraction precipitated with 2 M (NH4)2SO4; B: fraction eluted with 50 mM Tris-HCl, pH 7.5.
TABLE 8.
Summary of the Result of Phenyl Sepharose Fractionation
| No. of Spots | |||
| Resin | Ammonium Sulfate Precipitate | Eluent Fraction | Total Spots Added Together |
| Phenyl Sepharose | 342 | 406 | 748 |
CONCLUSIONS
This work describes the use of three column chromatographic techniques to fractionate complex mixtures of soluble proteins from E. coli. The advantages of these approaches are (1) the columns are inexpensive, easy to use, and adequately partition the tested extracts of soluble proteins; (2) there is no requirement for high-performance liquid chromatography or other automated liquid chromatographic systems; and (3) at least three times more of the proteome can be profiled using these strategies. These methods lend themselves well to being used in the proteomic profiling of other organisms. In addition, these techniques can be readily modified to further increase our ability to probe a large majority, if not all, of the E. coli proteome. For example, the use of different IPG strips that cover a greater pH range (this study only used pH 4–7 strips) will allow for the detection of proteins with pI values greater than 7 or less than 4. Increased fractionations, by using either more salt elutions or combining 2 or more of the columns, will lead to the detection of more proteins. Silver staining, instead of using Coomassie blue, will allow for the detection of proteins that are present in lower concentrations. The use of membrane protein fractionation and solubilization strategies16–18 will allow for the profiling of those important proteins. Lastly, the use of longer IPG strips and larger SDS-PAGE gels will improve the resolution of gel spots. The implementation of these modifications should allow for the profiling of the entire E. coli proteome.
TABLE 5.
Proteins Identified from 0.15 M NaCl Fraction of DEAE- Sepharose Column
| Protein | Size (kDa) |
| Cysteine synthase A | 34.3 |
| Pyruvate kinase I | 50.7 |
| Outer membrane protein 3a | 37.2 |
| Malate dehydrogenase | 29.3 |
| Hypothetical protein (b3223) | 24.0 |
| Cysteine synthase B | 32.5 |
| Chain A, enolase | 45.4 |
| Serine hydroxymethyl transferase | 45.2 |
| Phosphoglycerate kinase | 41.0 |
| ChainB elongation factor complex EF-TuEF-Ts | 30.2 |
| Chain1, spermidine PUTRESCINE-binding protein | 36.2 |
| Chain A, E coli cofactor-dependent phosphoglycerate mutase | 28.4 |
| Putative major head subunit | 34.8 |
| Adenylate kinase activity | 23.5 |
| Trigger factor | 47.9 |
Acknowledgments
We would like to thank Professor John W. Hawes for allowing us to use his PDQuest system and for helpful discussions. This research was funded in part by Miami University and the Doctoral-Undergraduate Opportunities in Scholarship program, an Undergraduate Research Award, and a Dean’s scholarship.
REFERENCES
- 1.Palzkill T. Proteomics, Dordrecht: Kluwer, 2002:1–2.
- 2.Gygi SP, Rochon Y, Franza BR, Aebersold R. Correlation between protein and mRNA abundance in yeast. Mol Cell Biol 1999;19:1720–1730. [DOI] [PMC free article] [PubMed] [Google Scholar]
- 3.Righetti PG, Castagna A, Herbert B, Reymond F, Rossier JS. Prefractionation techniques in proteome analysis. Proteomics 2003;3:1397–1407. [DOI] [PubMed] [Google Scholar]
- 4.Lilley KS, Razzaq A, Dupree P. Two-dimensional gel electrophoresis: Recent advances in sample preparation, detection and quantitation. Curr Opin Chem Biol 2002;6:46–50. [DOI] [PubMed] [Google Scholar]
- 5.Gorg A, Boguth G, Kopf A, Reil G, Parlar H, Weiss W. Sample prefractionation with Sephadex isoelectric focusing prior to narrow pH range two-dimensional gels. Proteomics 2002;2:1652–1657. [DOI] [PubMed] [Google Scholar]
- 6.Bae SH, Harris AG, Hains PG, et al. Strategies for the enrichment and identification of basic proteins in proteome projects. Proteomics 2003;3:569–579. [DOI] [PubMed] [Google Scholar]
- 7.Issaq HJ, Conrads TP, Janini GM, Veenstra TD. Methods for fractionation, separation and profiling of proteins and peptides. Electrophoresis 2002;23:3048–3061. [DOI] [PubMed] [Google Scholar]
- 8.Inagaki N, Katsuta K. Large gel two-dimensional electrophoresis: Improving recovery of cellular proteome. Curr Proteomics 2004;1:35–39. [Google Scholar]
- 9.Hoving S, Voshol H, van Oostrum J. Towards high performance two-dimensional gel electrophoresis using ultrazoom gels. Electrophoresis 2000;21:2617–2621. [DOI] [PubMed] [Google Scholar]
- 10.Wildgruber R, Harder A, Obermaier C, et al. Towards higher resolution: Two-dimensional electrophoresis of Saccharomyces cerevisiae proteins using overlapping narrow immobilized pH gradients. Electrophoresis 2000; 21:2610–2616. [DOI] [PubMed] [Google Scholar]
- 11.Pasquali C, Fialka I, Huber LA. Subcellular fractionation, electromigration analysis and mapping of organelles. J Chromatogr B 1999;722:89–102. [DOI] [PubMed] [Google Scholar]
- 12.Butt A, Davison MD, Smith GJ, et al. Chromatographic separations as a prelude to two-dimensional electrophoresis in proteomics analysis. Proteomics 2001; 1:42–53. [DOI] [PubMed] [Google Scholar]
- 13.Rajagopalan PTR, Grimme S, Pei D. Characterization of cobalt(II)-substituted peptide deformylase: Function of the metal ion and the catalytic residue Glu-133. Biochemistry 2000;39:779–790. [DOI] [PubMed] [Google Scholar]
- 14.Bradford MM. A rapid and sensitive method for the quantification of microgram quantities of protein utilizing the principle of protein-dye binding. Anal Biochem 1976;72:248–254. [DOI] [PubMed] [Google Scholar]
- 15.Blattner FR, Plunkett G, Bloch CA, et al. The complete genome sequence of Escherichia coli K-12. Science 1997;277:1432–1434. [DOI] [PubMed] [Google Scholar]
- 16.Molloy MP, Phadke ND, Chen H, et al. Profiling the alkaline membrane proteome of Caulobacter crescentus with two-dimensional electrophoresis and mass spectrometry. Proteomics 2002;2:899–910. [DOI] [PubMed] [Google Scholar]
- 17.Santoni V, Molloy M, Rabilloud T. Membrane proteins and proteomics: Un amour impossible? Electrophoresis 2000;21:1054–1070. [DOI] [PubMed] [Google Scholar]
- 18.Molloy MP. Two-dimensional electrophoresis of membrane proteins using immobilized pH gradients. Anal Biochem 2000;280:1–10. [DOI] [PubMed] [Google Scholar]


