Abstract
The objective of this study was to develop a mass spectrometric protocol to search for proteins related to phototrophy in marine bacteria. The genes that produce proteins involved in conversion of light into energy have been detected by cloning-sequencing from some of these bacteria, but it was previously unknown if these proteins were actually expressed.
Attaining this study’s goal was complicated by the fact that the samples consisted of miniscule cell pellets, which yielded small amounts of very complex mixtures of proteins. Sample preparation and analysis were tailored to optimize the probability of detecting the proteins of interest. It has been reported that using both matrix-assisted laser desorption/ionization (MALDI) and electrospray ionization (ESI) to analyze a mixture of peptides leads to the identification of more peptides that either technique alone. In order to exploit this complementarity between ESI and MALDI for proteomic analysis, samples were analyzed using both ionization techniques. With correct choices in sample preparation and ionization process, biologically relevant proteins can be identified out of small samples containing whole proteomes.
Keywords: Bacteria, MALDI, ESI, complementary, proteome
In the mass spectrometry (MS) facility at Oregon State University, users often submit samples that are extremely complex in order to observe a few proteins of interest. In this study, the samples were small pellets of marine bacteria, and the goal was to find proteins involved in the conversion of light into biochemical energy. The sequences of the desired proteins were known, and the proteins were suspected to be membrane proteins. Consequently, a simple membrane preparation was developed. A virtual tryptic digest was used to decide what sample preparation and mass spectrometric conditions would be used for the analysis. In previous studies, it has been shown that matrix-assisted laser desorption/ionization (MALDI) and electrospray ionization (ESI) are complementary ionization techniques that, when used together, lead to the identification of more peptides than either technique alone. For tryptically digested proteins, MALDI tends to ionize peptides ending in arginine while ESI favors lysine-containing peptides.1,2 This fact was used to predict which instrument was best suited to analyze the samples in order to identify the desired proteins. In this work, sample preparation methods and choice of ionization techniques were tailored for the identification of proteins of interest out of mixtures containing whole proteomes.
MATERIALS AND METHODS
Materials
Trifluoroacetic acid, formic acid, acetic acid, α-cyano-4-hydroxycinnamic acid (CHCA), ammonium citrate, n-dodecyl β-d-maltoside, and Trizma (Tris-base) were purchased from Sigma Chemical (St Louis, MO). Lyophilized sequencing-grade trypsin was purchased from Promega (Madison, WI). High-performance liquid-chromatography (HPLC)-grade acetonitrile was supplied by Fisher Scientific (Pittsburgh, PA). For general use, water was generated with a Milli-Q Ultrapure water purification system (Millipore, Bedford, MA); for HPLC, Burdick and Jackson water was purchased from Honeywell International (Muskegon, MI). Applied Biosystems supplied the 4700 Proteomics Analyzer Calibration Mixture (Framingham, MA).
Sample Preparation
The marine bacteria in this study were Alphaproteobacteria and Gammaproteobacteria isolates cultivated from the Pacific Ocean by high throughput culturing. Cell pellets weighing less than 10 mg were obtained from the two species of bacteria cultured in sterile sea water. The cells were lysed with the addition of 20 mM Tris (pH 7.4) followed by sonication. Membrane material was pelleted by centrifugation at 12,000 g for 5 min. The lysate was collected, and the membrane material was washed with Tris buffer to remove nonmembrane proteins. The membranes were then solubilized with the addition of 0.1% dodecyl maltoside in Tris buffer. Each sample was digested in-solution with the addition of 2 μL of 0.5 μg/μL trypsin (in 0.1 M acetic acid) to 20 μL of sample. The samples were vortexed, centrifuged, and placed on a 37°C water bath overnight to allow complete digestion to occur.
Chromatography and Electrospray Mass Spectrometry
For every chromatography experiment, each sample was mixed 1:1 (v/v) with solvent A (0.1% formic acid, 0.005% trifluoroacetic acid, and 3% acetonitrile in H2O). Solvent B contained 0.1% formic acid and 0.005% trifluoroacetic acid in 80% acetonitrile. A Symmetry 300 C18 trap from Dionex (Sunnyvale, CA) and a 15-cm long, 75-μm inner-diameter PicoFrit column from New Objective (Woburn, MA), packed in-house with Jupiter C5 from Phenomenex (Torrance, CA), were used for the ESI experiments. The LC program consisted of a gradient from 3% to 35% B over 60 min, to 70% B at 65 min, and finally 95% B from 70 to 80 min. A Waters CapLC system with a flow rate estimated to be 300 nL/min was used to deliver solvent. The mass spectrometer used for ESI tandem mass spectrometry (ESI-MS/MS) was a quadrupole–time-of-flight (Q-TOF) Global Ultima system from Micromass (Manchester, UK) operated with a spray voltage of 3.5 kV. Data-dependent MS/MS was generated using a 0.5-sec MS survey scan and 2.5-sec MS/MS scans on the three most abundant peaks found in the survey scan. The collision-induced dissociation (CID) energy was between 25 and 65 eV depending on the mass and charge state of the precursor ion. Mass spectra were calibrated using fragment ions generated from MS/MS of Glu-fibrinopeptide B (MW 1570.68).
Chromatography and MALDI Mass Spectrometry
A Symmetry 300 5-μm C18 trap and a 150-mm long × 0.32-mm inner-diameter Symmetry column packed with 5 μm C18 particles, both from Waters, were used for the MALDI experiments. Solvent A and solvent B both contained 0.1% trifluoroacetic acid; in addition, A contained 1% acetonitrile and B 99% acetonitrile. The gradient used on this system was similar to the one used in the ESI experiments, with some runs using shallower gradients up to 40% B over 70 min. A controlled flow rate of 3 μL/min was delivered by a Waters CapLC system. The eluate from the column was mixed with 1 μL/min of 0.6 mg/mL CHCA and 0.08 mg/mL ammonium citrate in 50:50 acetonitrile:H2O containing 0.1% trifluoroacetic acid. Ammonium citrate was added to the matrix solution to reduce the intensity of matrix peaks in MALDI mass spectra. This solution flowed via a 75-μm capillary at a combined rate of 4 μL/min into a Waters MALDIprep sprayer installed in the authors’ laboratory courtesy of the Life Sciences R & D Laboratory, Waters Corporation. A spotting time of 0.6 min per spot, a nitrogen flow rate of 7 psi, and a temperature gradient of −2°C/7 min (65–45°C over 20–90 min) was used for each run. MALDI-MS and MALDI-MS/MS were performed on an Applied Biosystems 4700 Proteomics Analyzer with TOF/TOF ion optics. Data were acquired in the MALDI reflector mode with five spots of standard (ABI4700 Calibration Mixture) for calibration. Mass spectra were obtained from each sample spot using 500 shots per spectrum. Tandem mass spectra were acquired by accelerating the precursor ions to 8 keV, selecting them with the timed gate set to a window of 3 Da, and performing CID at 1 keV. Gas pressure (air) in the CID cell was set at 0.2 μTorr. Fragment ions were accelerated to 14 keV before entering the reflector.
Data Analysis
Mascot3 from Matrix Science (London, UK) was used to search all of the tandem mass spectra. For the data obtained on the Q-TOF mass spectrometer, files appropriate for Mascot (pkl files) were created using the Masslynx software from Waters with a processing macro that smoothes, centroids, and assesses the quality of data. GPS Explorer software from Applied Biosystems was used to create and search files with Mascot for the data obtained on the TOF/TOF mass spectrometer.
RESULTS AND DISCUSSION
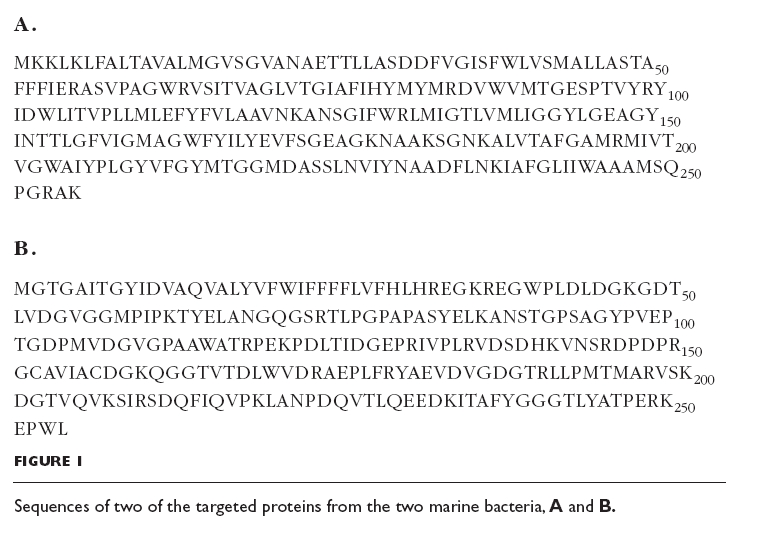
Due to the small sample sizes, typical sample preparation methods had to be scaled down. There was not enough material for two-dimensional gel electrophoresis, which is often used to study protein expression. Cell pellets (estimated at less than 10 mg weight) from two strains of marine bacteria were obtained from cultures grown in sterile sea water cultures. These cells were found to easily lyse in solutions with ionic strength less than sea water; therefore, lysis was performed in 20 mM Tris buffer. The sequences of two of the proteins that were to be identified can be seen in Figure 1. These sequences were obtained through cloning-sequencing of the bacterial genes.4,5 Both of these proteins were thought to be membrane-bound proteins due to the presence of hydrophobic regions in the sequences as well as homology to other known proteins. Mass spectral analyses of the tryptic digest of the cell lysates did not lead to the identification of protein A or B. Dodecyl maltoside was chosen to solubilize the membrane material because of its compatibility with ionization techniques in MS.6
FIGURE 1.

Sequences of two of the targeted proteins from the two marine bacteria, A and B.
To further increase the chance of successful identification of the proteins, theoretical digests were first studied (Table 1). Protein A yields 7 peptides of appropriate length for MS/MS, and there are no cysteines in this protein. The theoretical digest of protein B shows 13 peptides, one of which contains 2 cysteines. Although reduction and alkylation are typically performed in proteomic analyses, these reactions introduce the risks of sample loss and overalkylation,7 especially in cases where the protein concentration is not accurately known. The possibility of complicating the spectra with overalkylation outweighs the benefit of seeing one small peptide in protein B, so reduction and alkylation were not performed on either sample.
TABLE 1.
Theoretical Tryptic Digests of Proteins A and Ba
| Peptide | Mass (m/z) |
| Protein A | |
| ASVPAGWR | 843.45 |
| ANSGIFWR | 950.48 |
| ALVTAFGAMR | 1036.56 |
| DVWVMTGESPTVYR | 1639.78 |
| IAFGLIIWAAAMSQPGR | 1801.98 |
| VSITVAGLVTGIAFIHYMYMR | 2342.24 |
| YIDWLITVPLLMLEFYFVLAAVNK | 2871.58 |
| Protein B | |
| LLPMTMAR | 932.51 |
| GCAVIACDGK | 936.43 |
| SDQFIQVPK | 1061.56 |
| EGWPLDLDGK | 1129.55 |
| YAEVDVGDGTR | 1181.54 |
| TYELANGQGSR | 1195.57 |
| TLPGPAPASYELK | 1343.72 |
| QGGTVTDLWVDR | 1346.67 |
| GDTLVDGVGGMPIPK | 1455.75 |
| LANPDQVTLQEEDK | 1599.79 |
| ITAFYGGGTLYATPER | 1716.86 |
| GTGAITGYIDVAQVALYVFWIFFFFLVFHLHR | 3746.98 |
| MGTGAITGYIDVAQVALYVFWIFFFFLVFHLHR | 3878.02 |
aOnly peptides with molecular weights between 800 and 4000 Da are listed.
MALDI and ESI have been shown to ionize peptides from a mixture in a complementary fashion, particularly with tryptic peptides. In a previous work, the authors have seen that ESI ionizes peptides ending in lysine more often than those ending in arginine as evidenced by an observed lysine/arginine (K/R) ratio of 1.38; by contrast, MALDI tended to be biased toward peptides ending in arginine as evidenced by an observed K/R ratio of 0.89.1 Looking at the peptides in the theoretical digest of protein A, it is clear that MALDI is the ionization technique to use in order to find peptides from this protein. Protein B yields peptides ending in both arginine and lysine, so either technique could be used for ionization.
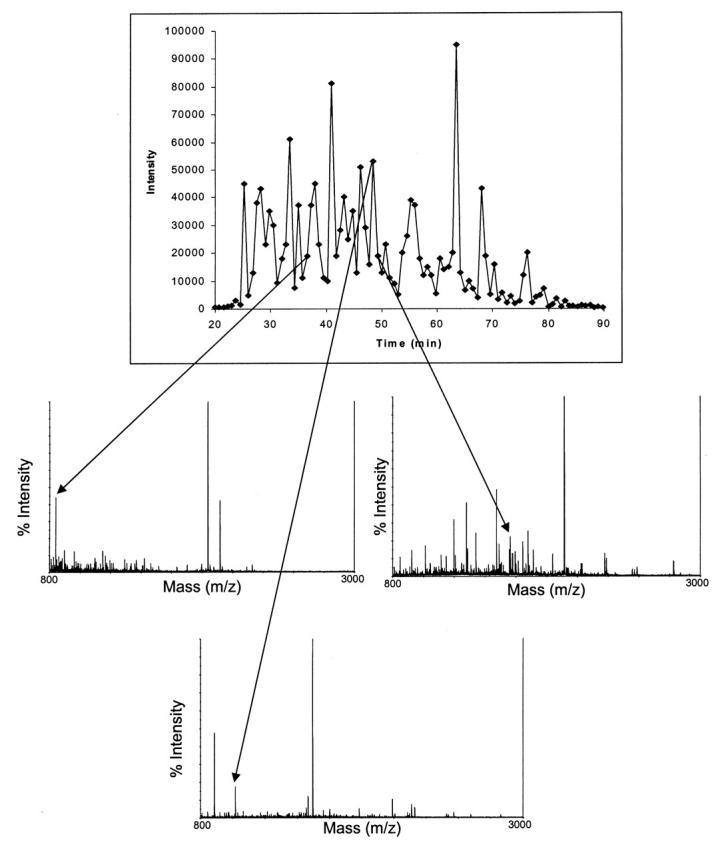
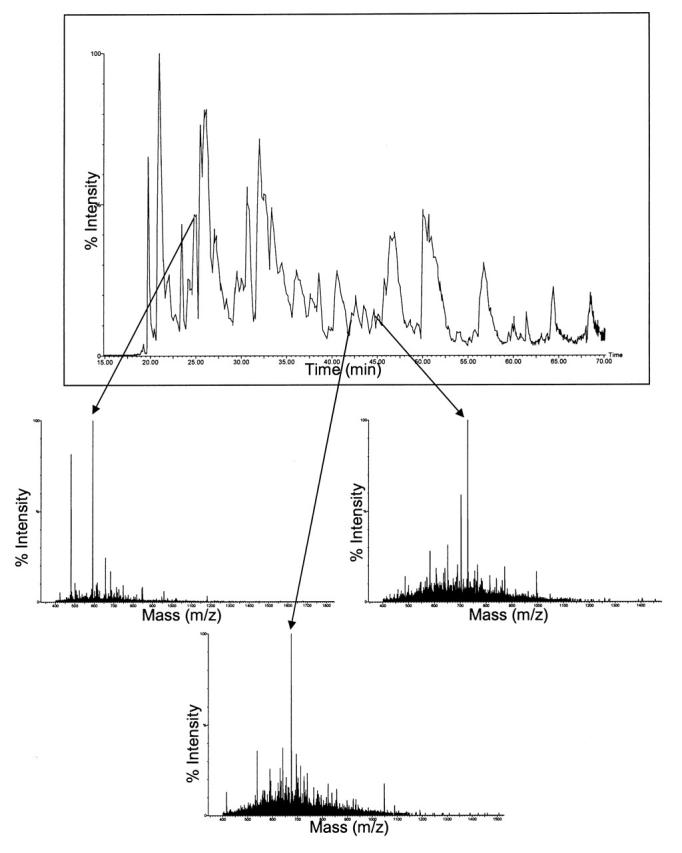
Most current proteomic research protocols use ESI to produce tandem mass spectra of samples separated by HPLC8 and MALDI to produce peptide mass fingerprints.9 This division evolved from the ease of coupling LC with ESI and from the previous lack of routine tandem time-of-flight (TOF/TOF) analyzers. Newly developed LC-MALDI10 and MALDI TOF/TOF11 instruments increase the usefulness of this ionization technique for the analysis of complex mixtures. Figure 2A shows the chromatogram of the sample containing protein A separated by HPLC, sprayed by the MALDIprep, and analyzed on the MALDI TOF/TOF mass spectrometer. The three mass spectra show the precursor ions for protein A that were selected for MS/MS. A similar-looking chromatogram, which was obtained on the ESI-Q-TOF, can be seen in Figure 2B.
FIGURE 2A.

Base-peak chromatogram generated by the HPLC-MALDI system from a tryptic digest of membrane proteins isolated from the first marine bacterium. Arrows point to the three spectra that correspond to singly charged precursor ions of peptides from protein A. Each point in the chromatogram corresponds to a spot on the MALDI plate.
FIGURE 2B.

Base-peak chromatogram generated by the ESI-Q-TOF system from a tryptic digest of membrane proteins isolated from the second marine bacterium. Arrows point to the labeled peaks in the three spectra that correspond to some of the doubly charged precursor ions of peptides from protein B.
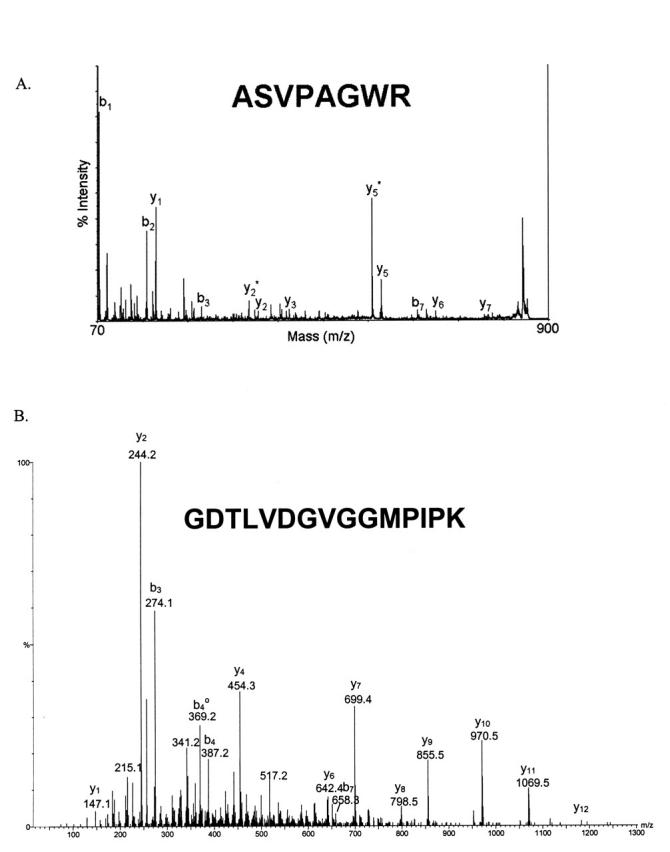
Tandem mass spectra for peptides from proteins A and B can be seen in Figure 3. The MS/MS spectrum of the peptide from protein A (Fig. 3A) was obtained by TOF/TOF and had a Mascot ion score of 44. High-energy immonium ion fragments can be seen in the lower mass portion of this spectrum in addition to many familiar b and y ions. The MS/MS spectrum of the peptide from protein B (Fig. 3B) was obtained by Q-TOF. This spectrum contains mainly y ions and had a Mascot ion score of 83. Summaries of all of the peptides found from proteins A and B can be seen in Table 2. Protein A was only found using MALDI, while protein B was found using both ionization techniques. Even the use of an inclusion list did not lead to successful MS/MS of peptides from protein A by ESI-Q-TOF. The Mascot ion scores as well as the small mass errors give high confidence in the protein identifications. Overall, proteins A and B were identified with 12% and 29% coverage, respectively.
FIGURE 3.

Tandem mass spectra of peptides from the proteins of interest. A: Spectrum produced from a singly charged peptide by MALDI-TOF/TOF; B: spectrum produced from a doubly charged peptide by ESI-Q-TOF.
TABLE 2.
Peptides Observed from Protein A and Protein B by MALDI and ESI-MS/MS, Respectively
| Peptide | Observed | Mr(expt) | Mr(calc) | Delta | Score | Sequence |
| Protein A | ||||||
| 57–64 | 843.461 | 842.451 | 842.44 | 0.011 | 44 | ASVPAGWR |
| 86–99 | 1639.821 | 1638.811 | 1638.77 | 0.041 | 33 | DVWVMTGESPTVYR |
| 187–196 | 1036.581 | 1035.571 | 1035.55 | 0.021 | 40 | ALVTAFGAMR |
| Protein B | ||||||
| 48–62 | 728.36 | 1454.71 | 1454.74 | −0.03 | 83 | GDTLVDGVGGMPIPK |
| 74–86 | 672.35 | 1342.69 | 1342.71 | −0.02 | 45 | TLPGPAPASYELK |
| 161–172 | 673.82 | 1345.63 | 1345.66 | −0.03 | 71 | QGGTVTDLWVDR |
| 179–189 | 591.26 | 1180.51 | 1180.54 | −0.03 | 78 | YAEVDVGDGTR |
| 211–219 | 531.27 | 1060.53 | 1060.56 | −0.03 | 31 | SDQFIQVPK |
| 220–233 | 800.38 | 1598.75 | 1598.78 | −0.03 | 70 | LANPDQVTLQEEDK |
Mr, relative molecular mass.
Both membrane and lysate fractions from each bacterium were digested and analyzed by MALDI- and ESI-MS. The analysis of the first marine bacterium yielded the identification of 167 proteins with an average of 4.26 peptides observed per protein. The ESI instrument favored peptides ending in lysine, with 2.38 times more lysine-ending peptides observed than those ending in arginine. MALDI analysis of this bacterium yielded the identification of equal numbers of peptides ending in lysine or arginine. The analysis of the second marine bacterium only resulted in the identification of 22 proteins because of the incomplete sequencing of this organism’s genome.
CONCLUSIONS
Identifying biologically relevant proteins out of small samples containing whole proteomes is possible, but only with correct choices in sample preparation and ionization technique. Amazingly, in the examples presented, the proteins were expressed by the bacteria in large enough quantities to permit identification using only one stage of chromatography. Protein A was one of the 167 proteins observed from the first sample, with an average of 4.26 peptides per protein observed by MALDI and ESI. The proteins targeted in this study were only observed when the membrane material from each sample was solubilized and digested. Reduction and alkylation were not used in this study because the risk of overalkylation was too great and because the targeted proteins did not require these steps. In cases where only a small amount of precious sample is available, the ionization technique should be chosen that optimizes the chance for success. Protein A, all of whose tryptic peptides save one end in arginine, was only observed when HPLC was followed by MALDI. The precursor ions for the peptides from protein A were seen in ESI-Q-TOF, but not with enough intensity for MS/MS. HPLC-MALDI should be used in conjunction with HPLC-ESI, especially for peptides ending in arginine residues.
Acknowledgments
The authors wish to thank Brian Arbogast and Elisabeth Lilo Barofsky for their assistance with mass spectrometry. We would also like to acknowledge Jeffrey Finch, Daniel Wall, and Michael Daly from Waters Corporation for installing the MALDIprep device in our laboratory and assisting us in its operation. This work was supported in part by the National Institute of Environmental Health Sciences under Grant No. ES00210.
REFERENCES
- 1.Stapels MD, Barofsky DF. Complementary use of MALDI and ESI for the HPLC-MS/MS analysis of DNA-binding proteins. Anal Chem, in press. [DOI] [PubMed]
- 2.Bodner WM, Blackburn RK, Krise JM, Moseley MA. Exploiting the complementary nature of LC/MALDI/MS/MS and LC/ESI/MS/MS for increased proteome coverage. J Am Soc Mass Spectrom 2003;14:971–979. [DOI] [PubMed] [Google Scholar]
- 3.Perkins DN, Pappin DJC, Creasy DM, Cottrell, JS. Probability-based protein identification by searching sequence databases using mass spectrometry data. Electrophoresis 1999;20:3551–3567. [DOI] [PubMed] [Google Scholar]
- 4.Giovannoni SJ, Mathur EJ. Unpublished data.
- 5.Beja O, Suzuki MT, Heidelberg JF, et al. Unsuspected diversity among marine aerobic anoxygenic phototrophs. Nature 2002;415:630–633. [DOI] [PubMed] [Google Scholar]
- 6.Vorm O, Chait BT, Roepstorff P. Mass spectrometry of protein samples containing detergents. Proceedings of the 41st American Society for Mass Spectrometry, 1994:621a–621b.
- 7.Boja ES, Fales HM. Overalkylation of a protein digest with iodoacetamide. Anal Chem 2001;73:3576–3582. [DOI] [PubMed] [Google Scholar]
- 8.Aebersold R. A mass spectrometric journey into protein and proteome research. J Am Soc Mass Spectrom 2003;14:685–695. [DOI] [PubMed] [Google Scholar]
- 9.Mann M, Schevchenko A, Wilm M, Vorm O. Mass spectrometric sequencing of proteins from silver-stained polyacrylamide gels. Anal Chem 1996;68:850–858. [DOI] [PubMed] [Google Scholar]
- 10.Wall DB, Berger SJ, Finch JW, et al. Continuous sample desorption from reversed-phase liquid chromatography to tracks on a matrix-assisted laser desorption/ionization precoated target for the analysis of protein digests. Electrophoresis 2002;23:3193–3204. [DOI] [PubMed] [Google Scholar]
- 11.Medzihradszky KF, Campbell JM, Baldwin MA, et al. The characteristics of peptide collision-induced dissociation using a high-performance MALDI-TOF/TOF tandem mass spectrometer. Anal Chem 2000;72:552–558. [DOI] [PubMed] [Google Scholar]


