Abstract
Matrix-assisted laser desorption/ionization time-of-flight mass spectrometry analysis following tryptic digestion of polyacrylamide gel pieces is a common technique used to identify proteins. This approach is rapid, sensitive, and user friendly, and is becoming widely available to scientists in a variety of biological fields. Here we introduce a simple and effective strategy called “mass processing” where the list of masses generated from a mass spectrometer undergoes two stages of data reduction before identification. Mass processing improves the ability to identify in-gel tryptic-digested proteins by reducing the number of nonsample masses submitted to protein identification database search engines. Our results demonstrate that mass processing improves the statistical score and rank of putative protein identifications, especially with low-quantity samples, thus increasing the ability to confidently identify proteins with mass spectrometry data.
Keywords: peptide mass fingerprint, protein gel electrophoresis, MALDI-TOF, Drosophila
As the goal of genome identification has become almost commonplace,1–5 the next major development in biology is in the field of proteomics. Once proteins have been separated and characterized from complex biological samples, an essential task of proteomic research is to identify these proteins. The process of identifying proteins has flourished recently thanks to manual protein digestion protocols and the relatively low cost and widespread availability of matrix-assisted laser desorption/ionization time-of-flight mass spectrometry (MALDI-TOF-MS). These instruments allow biologists, whose primary expertise is not in analytical chemistry, to expeditiously determine peptide masses from semipure samples. In addition, sample-handling requirements are minimal and only a small amount of protein sample is required for analysis.
Each protein possesses its own enzyme-specific, peptide molecular-weight fragment profile, much like people have unique fingerprints.6 “Mass fingerprint” is the term assigned to the peptide molecular weight profile obtained with MS after the digestion of a protein with a specific enzyme. To identify proteins, the peptide masses (“fingerprints”) of the sample acquired with MS are compared with the theoretical masses of all the peptides of proteins subjected to cleavage with the same site-specific protease. These theoretical masses are available in protein sequence databases that can be accessed through Web-based search engines which also run the comparison (e.g., Swiss-Prot and Entrez).7–11
The output is a rank order of potential protein identities based on a scored prediction of the most likely protein identified by the sample peptide masses. While this method appears to be quite simple and straightforward, the ability to obtain accurate and credible protein identification from MS data is anything but reliable. Incomplete and inaccurate genome databases, post-translational modifications, sample contamination, and partial protease digestion are just some of the factors hampering this technique.
A variety of mass fingerprint database search engines are available for use on the Web, free of charge, including Mascot (Matrix Science, London, UK), PepMAPPER (BIOME Bioresearch Gateway, Nottingham, UK), PeptIdent (Expert Protein Analysis System, Geneva, Switzerland), PeptideSearch (European Molecular Biology Laboratory Bioanalytical Research Group, Heidelberg, Germany), ProFound (The Rockefeller University, New York, NY), and ProteinProspector (University of California at San Francisco Mass Spectrometry Facility, San Francisco, CA). Though each program possesses unique features, the general function of each site is to compare a list of sample MS masses with the theoretical enzyme digest of all gene products in a database, and produce a list of the most likely protein candidates that contain some or all of the sample masses.
These programs do not provide a positive identification for a particular protein, but rather a probability for any given identification based on a statistical score or molecular weight search (MOWSE) score. In general, the higher the probability or score, the higher the confidence level that the correct protein has been identified. If the database does not contain the unknown protein, then the search engine will produce an entry with the closest homology, usually from a similar species.12
When the masses are entered into the protein identification search engine, it is best if they are biased toward being true masses from the digested protein, for as few as three correct masses can result in significant protein identification. The challenge thus becomes trying to eliminate as much noise and as many nonprotein-derived fragment masses as possible from the sample prior to submitting the data to the search engine for identification.
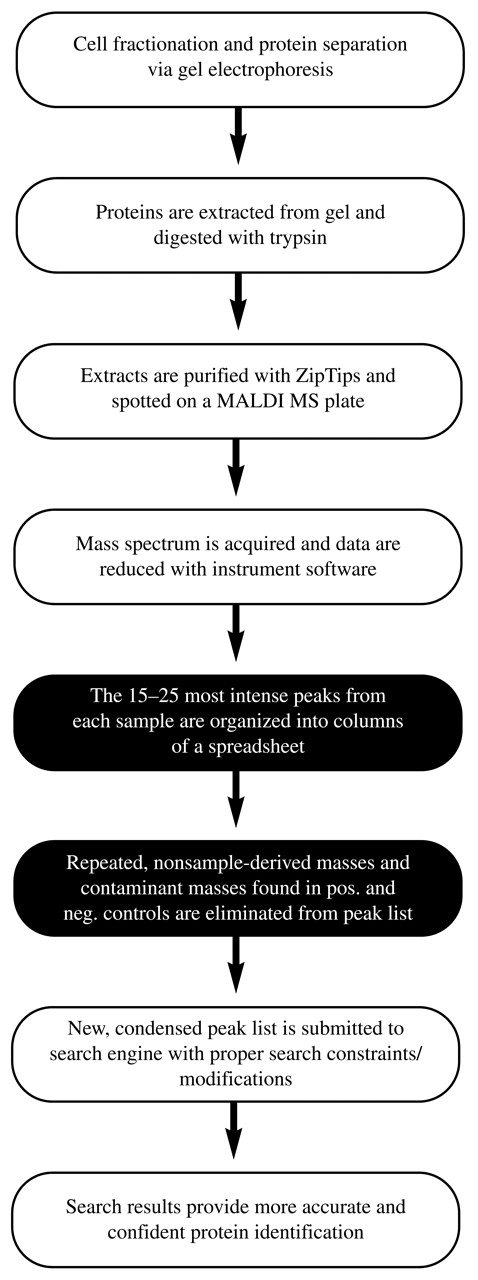
In the effort to reduce the number of nonsample protein masses present in the data submitted to the protein search engine, we developed a simple method, termed “mass processing,” that optimizes the identification of proteins separated by one- or two-dimensional gel electrophoresis (2DE), followed by MALDI-TOF-MS (Fig. 1). This method minimizes the number of nonsample-derived masses submitted to the Mascot peptide mass fingerprint search engine, thus limiting its search to a smaller number of higher quality masses, which results in more accurate identification of proteins using the mass fingerprint approach.
FIGURE 1.

Mass processing operational flow chart. This flow chart describes the steps involved from sample separation to protein identification. Steps in mass processing are shown in black.
Several steps in our procedure are common and intuitive to experienced MS chemists whereas others are relatively novel. This codified technique is accompanied by a set of instructions that will allow researchers who are relatively new to the study of proteomics to identify proteins from gel pieces with confidence.
MATERIALS AND METHODS
One-Dimensional Polyacrylamide Gel Electrophoresis
Actin Sample Preparation
Purified bovine actin (Sigma, St. Louis, MO) was solubilized and mixed with equal parts 2X sodium dodecyl sulfate gel loading buffer (125 mM Tris-HCl, pH 6.8, 200 mM dithiothreitol, 4% sodium dodecyl sulfate, 0.2% bromophenol blue, 20% glycerol). Six samples were prepared at 1.1 μg (10X) and four were diluted to 0.1 μg (1X).
Drosophila melanogaster Indirect Flight Muscle Sample Preparation
Indirect flight muscle from 2-day-old female Drosophila melanogaster were isolated and skinned as described in Moore et al.13 After skinning, fibers were solubilized in modified Laemmli sample buffer containing 8 M urea (8 M urea, 4% sodium dodecyl sulfate, 60 mM Tris, pH 6.8, 700 mM 2-mercaptoethanol, 0.1% bromophenol blue). Approximately 500 μg of protein was run on each gel lane.
Gel Separation
Samples were separated on a 12.5% Criterion Tris-HCl precast polyacrylamide gel (Bio-Rad, Hercules, CA) and stained with GelCode Blue (Pierce Biotechnology, Rockford, IL) for protein visualization.
Tryptic Digest
The digestion protocol for gel pieces followed that of Gharahdaghi et al.14 with the addition of a reduction/alkylation step before the trypsin digestion. Gel bands were manually excised from gels, chopped into pieces, and placed in Costar silicone-coated tubes (Corning, Corning, NY). Solutions were dispensed at volumes sufficient to cover the gel pieces with little overage. The amount used was usually between 20 and 30 μL per sample. Solutions were removed from tubes with gel-loading tips to minimize the risk of aspirating the gel pieces.
Controls
A small area of stained gel with no bands was used as a negative control in all experiments. A gel piece containing bovine actin was used as a positive control to monitor the quality of the digestion process for the Drosophila indirect flight muscle experiment.
Destaining
Each sample was washed three times in 50% acetonitrile, 25 mM ammonium bicarbonate for 15 min each time. The tubes were then placed in a refrigerated speed vacuum until gel pieces were completely dried.
Reduction/Alkylation
Dry gel pieces were incubated in 10 mM dithiothreitol/100 mM ammonium bicarbonate in a 56°C water bath for 45 min. After cooling for 5 min, the solution was discarded and 55 mM iodoacetamide/100 mM ammonium bicarbonate was added. The gel pieces were incubated in the dark at room temperature for 30 min. Upon completion of this step, the solution was discarded and the pieces incubated in 100 mM ammonium bicarbonate for 5 min. Next, the same volume of 50% acetonitrile was added to make a 1:1 vol:vol ratio of ammonium bicarbonate/acetonitrile and the pieces incubated at room temperature for 15 min. Following the removal of this solution, the pieces were dried completely in a refrigerated speed vacuum.
Digestion
Trypsin (10 μg/mL) in 25 mM ammonium bicarbonate was added to each tube. Tubes were incubated in a 37°C water bath for 16 to 18 h.
Extraction
Sample tubes were removed from the water bath and peptide fragments were extracted two times from the gel pieces by adding 0.1% trifluoroacetic acid to each tube for 45 min on an orbital shaker. The two fractions were combined in a fresh silicone-coated tube.
MALDI-TOF Mass Spectrum Analysis
Samples were purified with C18 ZipTips (Millipore, Billerica, MA) following the manufacturer’s instructions. Exactly 1.5 μL was spotted from the ZipTip onto the MALDI plate and pipetted up and down three times. After each spot dried, 1.0 μL of α-cyano-4-hydroxycinnamic acid matrix solution was applied on top of the sample spot. Samples were analyzed in reflectron mode with a Voyager-DE PRO mass spectrometer (Applied Biosystems, Foster City, CA).
Mass Processing
The first step in mass processing was to perform data reduction by processing the raw mass spectrum using the mass spectrometer software (Data Explorer v4.0, Applied Biosystems). Each spectrum was processed to eliminate background, improve any offset baseline, and enhance the signal-to-noise ratio. This procedure included calibration to a set of control masses, noise filtering, background smoothing, truncating the spectrum to eliminate matrix peaks (usually between 500 and 600 Da), and setting a peak detection threshold to a point where the top 15–25 most intense masses were recognized and demarked for further processing.
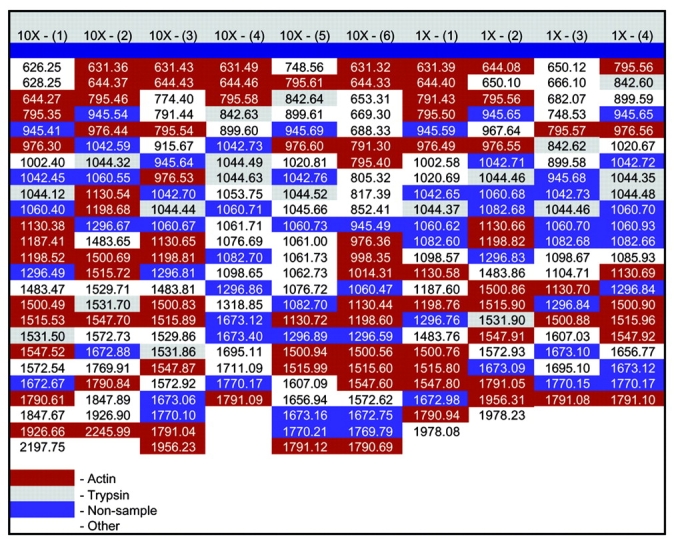
The second step in mass processing was to optimize database searching. The 15–25 selected masses from each sample’s spectrum were entered into columns of a spreadsheet along side each other (Fig. 2). Known contaminant masses (e.g., trypsin and keratin) and masses that were repeated throughout at least 60% of the columns were eliminated, as they are likely to represent contamination. In addition, for the Drosophila samples, masses generated by the negative control, as well as masses not matching the enzymatic peptide digest profile of the positive control, were also eliminated.
FIGURE 2.

Bovine actin mass list generated from mass processing. Mass list from bovine actin samples are aligned in columns in a spreadsheet. Red masses are actin peptide fragments, gray masses are trypsin products, blue masses do not match the enzymatic peptide digest profile for actin, but are present in greater than 60% of the samples, and white masses do not match the enzymatic peptide digest profile for actin, but are not present in greater than 60% of the samples.
Database Searching
Each sample’s peak list was copied and pasted into the Mascot peptide mass fingerprint search form (http://www.matrixscience.com) and used to query the nonredundant sequence database for protein identification established by the National Center for Biotechnology Information. Standard settings included:
enzyme—trypsin,
missed cleavages—one
fixed modifications—none selected
variable modifications—oxidized methionine
protein mass—blank
mass values—MH+ (monoisotopic)
peptide tolerance—this setting varied between 0.25 and 1.0 Da depending on the sample.
After searching, Mascot produced a ranked register of hits and MOWSE scores, and calculated statistically significant hits from the list of potential targets.
RESULTS
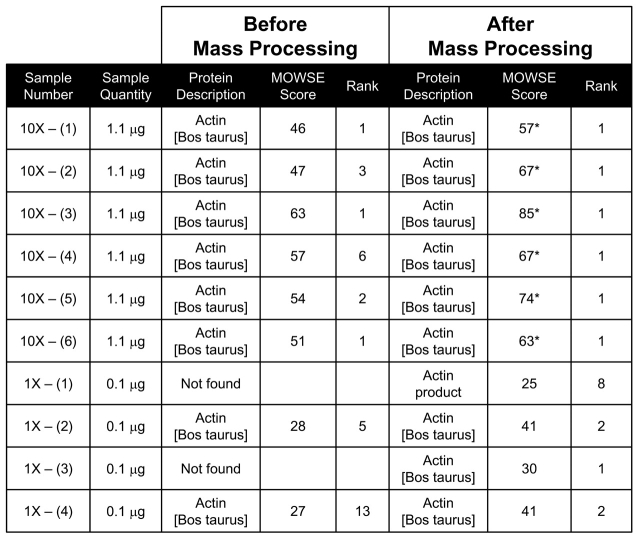
We compared protein identification scores, before and after mass processing, of purified bovine actin subjected to 1DE (Table 1). The pre- and post-processed mass lists for each of 10 replicate samples were submitted to Mascot’s peptide mass fingerprint search engine for protein identification. The search results before mass processing revealed that none of the samples were considered significant identifications according to their MOWSE scores (Table 1). Bovine actin was found in the top 10 protein identification search results or “hits” for all of the 10X samples, while two of the four 1X samples did not identify bovine actin as one of the top 20 results.
TABLE 1.
Mascot Scores and Ranks Before and After Mass Processing for Bovine Actin Samples
Search Constraints: DATABASE — NCBI TAXONOMY — Other Mammalia ENZYME — trypsin MISSED CLEAVAGES — one FIXED MODIFICATIONS — none selected VARIABLE MODIFICATIONS — oxidized methionine PROTEIN MASS — blank PEPTIDE TOLERANCE — this setting varied between 0.85 and 1.0 Da depending on the sample MASS VALUES — MH+ (monoisotopic) * = significant MOWSE score.
After mass processing the MOWSE score and/or rank of every sample improved. All of the 10X samples achieved significant MOWSE scores (Table 1). Although none of the 1X samples reached significant status, all but one of the sample results selected bovine actin as the first- or second-ranked protein identification.
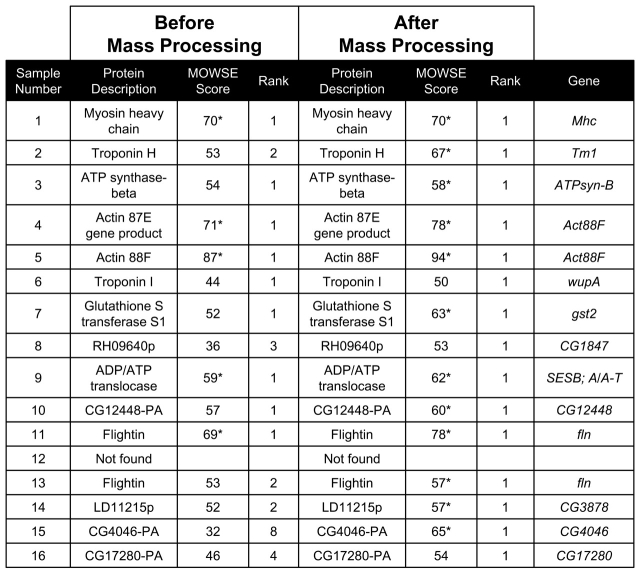
Mass processing was next assessed using Drosophila indirect flight muscle myofibrillar proteins separated by 1DE. Approximately 20 of these cytoskeletal proteins have been previously identified.15 Sixteen bands of varying staining intensity (abundance) ranging from 12 to 225 kDa were tested. On the first pass, before mass processing, 10 samples were identified as known proteins (5 of which had significant MOWSE scores), 5 samples were identified as nonsignificant gene products, and 1 sample was unidentified. The ranks for all the identified samples ranged from 1 to 8.
After mass processing, 14 of the 15 samples identified on the first pass improved their MOWSE scores (sample 1, myosin heavy chain, remained unchanged) and were ranked as the number 1 hit. Meanwhile, sample 12 was unidentified both before and after mass processing. In total, 75% of the samples achieved significant MOWSE scores and identifications following mass processing (Table 2).
TABLE 2.
Mascot Scores and Ranks Before and After Mass Processing for Drosophila Indirect Flight Muscle Sample
Search Constraints: DATABASE — NCBI TAXONOMY — Drosophila ENZYME — trypsin MISSED CLEAVAGES — one FIXED MODIFICATIONS — none selected VARIABLE MODIFICATIONS — oxidized methionine PROTEIN MASS — blank PEPTIDE TOLERANCE — this setting varied between 0.25 and 1.0 Da depending on the sample MASS VALUES — MH+ (monoisotopic) * = significant MOWSE score
DISCUSSION
The success of protein identification from polyacrylamide gel pieces depends largely on the quality of the mass spectrum derived from each sample. Sample fractionation and protein separation, sample quantity, proper enzymatic digestion and extraction conditions, and mass accuracy of the instrument all contribute to the quality of the spectrum. Mass processing is a strategy that can be employed to improve the likelihood of successful protein mass fingerprint identification by encouraging proper use of data reduction software and more importantly, elimination of consistent nonsample masses.
Contaminating or unidentified sample peptide masses and their associated peaks can come from a variety of sources. These extra peaks are commonly attributed to trypsin products or keratin. However, extra masses can also come from peptides belonging to less abundant proteins that occupy the same space within a gel spot or band, additional masses that are presently unidentified due to some type of posttranslational modification, peptides arising from partial proteolysis or nonspecific cleavage by the proteolytic enzyme, airborne contamination, or possibly the protein was incorrectly identified (false positive identification) and the left over masses are actually from its true sequence.
Some of the contaminating masses will be specific to a particular sample, although, many masses will be indigenous to all samples and their elimination is demonstrated here to improve protein identification.
In the case of the actin samples, we singled out the trypsin masses (gray color in Fig. 2), did not find any keratin masses, and can safely rule out overlapping protein digest products as well as false-positive identifications. This leaves partial proteolysis, post-translational modifications, or user-induced contamination as the main culprit for the contamination. Since we were looking at the same protein for all of our samples, any one of these factors could be the cause for repeated nonsample masses found in our results. For the Drosophila indirect flight muscle samples (Table 2), each sample was from a different protein in the myofibril. It is unlikely that overlapping proteins, post-translational modifications, partial proteolysis or false-positives from different protein samples will produce the same peptide masses that are present in at least 60% or more of the samples. Therefore, the repeated masses that are candidates for elimination via mass processing are most likely going to come from trypsin, keratin, or some type of user-induced contamination. Under these conditions, it is doubtful that mass processing will eliminate any true masses that actually belong to a specific protein’s digest pattern.
Mass processing enhances the identification of low-quantity protein samples through the removal of nonsample peptide masses so that the ratio of true peptide masses to nonsample-derived masses submitted to the database search engine is increased. This was evident with the 1X actin samples that were not identified or had low ranking hits initially, but all received higher scores and rank improvements after mass processing. The application of mass processing to improve identification of low-quantity samples was also seen in the significant identification of several of the lightly stained, low-molecular-weight proteins in Drosophila samples 13–16. None of these samples were significantly identified when searched without mass processing, yet we were able to obtain significant MOWSE scores and identifications for 3 of the 4 after mass processing (Table 2).
Ashman et al. performed a similar investigation of Drosophila indirect flight muscle myofibrillar proteins separated by 1DE in a study that was designed to compare the efficiency of manual tryptic digests to that of a robot.16 They identified 16 proteins out of 23 sample bands from the myofibrillar proteome using MALDI-TOF-MS. The starting material (indirect flight muscle from 10 thoraces) was five times as great as the starting material used in our samples (two thoraces). Even with appreciably lower sample volumes, we were able to identify many of the proteins identified by Ashman et al. in the 20–225-Da range. In addition, we were able to significantly identify three new low-molecular-weight gene products by using mass processing for a total of 75% significant identifications compared with their 70%.
For abundant proteins (myosin heavy chain accounts for approximately 50% of the total myofibrillar protein),16 mass processing might not make a dramatic improvement, depending on the quality of the sample spectrum. Mass processing had no affect on the MOWSE score for Drosophila sample 1 due to the fact that there was an abundance of strong mass peaks coming from the sample. There is a possibility with large proteins for mass processing to slightly decrease the MOWSE score of a sample that has a multitude of digest products if one of the many digest products from the putative protein is similar to a mass that is eliminated in the mass processing procedure. However, this did not occur during the current investigation.
In summary, the implementation of mass processing increases the confidence in the agreement of protein identification using peptide mass fingerprinting. This method also appears to assist in the identification of low copy-number proteins that produce fewer prominent mass peaks and therefore might not be good candidates for MS/MS or post-source decay. Mass processing can be beneficial when utilized in the rapid first screening of proteins to reduce the number of samples that need to be identified by subsequent, more time-consuming techniques.
Acknowledgments
We would like to thank Allison Cox and Eileen Brown for their technical assistance for this project, and David Maughan for helpful discussion on this manuscript. This project was funded by the NSF grants MCB0090768 and MCB0315865 to JOV.
REFERENCES
- 1.Goffeau A, Barrell BG, Bussey H, et al. Life with 6000 Genes. Science 1996;274:546–567. [DOI] [PubMed] [Google Scholar]
- 2.The C. elegans Sequencing Consortium. Genome sequence of the nematode C. elegans: A platform for investigating biology. Science 1998;282:2012–2018. [DOI] [PubMed] [Google Scholar]
- 3.The Arabidopsis Genome Initiative. Analysis of the genome sequence of the flowering plant Arabidopsis thaliana. Nature 2000;408:796–815. [DOI] [PubMed] [Google Scholar]
- 4.Myers EW, Sutton GG, Delcher AL, et al. A whole-genome assembly of Drosophila Sci 2000;287: 2196–2204. [DOI] [PubMed] [Google Scholar]
- 5.Venter JC, Adams MD, Myers EW, et al. The sequence of the human genome. Science 2001;291:1304–1351. [DOI] [PubMed] [Google Scholar]
- 6.Henzel WJ, Stults JT, Watanabe C. Paper presented at the ASMS Conference, Seattle, WA, July 29–Aug. 2, 1989.
- 7.Henzel WJ, Billeci TM, Stults JT, Wong SC, Grimley C, Watanabe C. Identifying proteins from two-dimensional gels by molecular mass searching of peptide fragments in protein sequence databases. Proc Natl Acad Sci USA 1993;90:5011–5015. [DOI] [PMC free article] [PubMed] [Google Scholar]
- 8.James P, Quadroni M, Carafoli E, Gonnet G. Protein identification by mass profile fingerprinting. Biochem Biophys Res Commun 1993;195:58–64. [DOI] [PubMed] [Google Scholar]
- 9.Mann M, Hojrup P, Roepstorff P. Use of mass spectrometric molecular weight information to identify proteins in sequence databases. Biol Mass Spect 1993;22: 338–345. [DOI] [PubMed] [Google Scholar]
- 10.Pappin DJ, Hojrup P, Bleasby AJ. Rapid identification of proteins by peptide-mass fingerpint. Curr Biol 1993;3:327–332. [DOI] [PubMed] [Google Scholar]
- 11.Yates JR, 3rd, Speicher S, Griffin PR, Hunkapiller T. Peptide mass maps: A highly informative approach to protein identification. Anal Biochem 1993;214:397–408. [DOI] [PubMed] [Google Scholar]
- 12.Perkins DN, Pappin DJ, Creasy DM, Cottrell JS. Probability-based protein identification by searching sequence databases using mass spectrometry data. Electrophoresis 1999;20:3551–3567. [DOI] [PubMed] [Google Scholar]
- 13.Moore JR, Dickinson MH, Vigoreaux JO, Maughan DW. The effect of removing the N-terminal extension of the Drosophila myosin regulatory light chain upon flight ability and the contractile dynamics of indirect flight muscle. Biophys J 2000;78:1431–1440. [DOI] [PMC free article] [PubMed] [Google Scholar]
- 14.Gharahdaghi F, Weinberg CR, Meagher DA, Imai BS, Mische SM. Mass spectrometric identification of proteins from silver–stained polyacrylamide gel: A method for the removal of silver ions to enhance sensitivity. Electrophoresis 1999;20:601–605. [DOI] [PubMed] [Google Scholar]
- 15.Vigoreaux JO. Genetics of the Drosophila flight muscle myofibril: A window into the biology of complex systems. Bioessays 2001;23:1047–1063. [DOI] [PubMed] [Google Scholar]
- 16.Ashman K, Houthaeve T, Clayton JD, et al. The application of robotics and mass spectrometry to the characterization of the Drosophila melanogaster indirect flight muscle proteome. Lett Peptide Sci 1997;4:57–65. [Google Scholar]


