Abstract
Post-translational modifications are used by cells to control the functions of proteins. Phosducin-like protein (PhLP) is a regulator of G-protein signaling that is post-translationally modified via phosphorylation. Phosphorylation of PhLP initiates its degradation by the 26S proteasome in serum-stimulated cells. In this report, we show that PhLP is phosphorylated in serum-stimulated Chinese hamster ovary (CHO) cells. Through the use of tandem mass spectrometry (MS/MS), the specific amino acids phosphorylated can be identified. A PhLP-myc-His construct was purified and phosphorylated by serum-stimulated CHO extract. The resulting protein was digested with trypsin and the peptides were identified by liquid chromatography-tandem mass spectrometry (LC-MS/MS). Automated collison-induced dissociation data acquisition was compared with LC-MS/MS of manually chosen parents. In general, LC-MS/MS is superior for parent ions chosen manually, with the notable exception that automated fragmentation employs dynamic collision energy, which can result in higher quality collison-induced dissociation. Using the LC-MS/MS methods, four phosphorylation sites on PhLP were positively identified.
Keywords: phosducin-like protein, phosphorylation, CHO, serum-stimulation, LC-MS/MS
Phosphorylation of proteins is involved in cell growth, proliferation, signaling, and other cellular functions.1 Different phosphorylation sites are specific for different functions of a particular protein. The specific site that is phosphorylated must be identified in order to determine the effects on protein function.
The most widely used method of identifying a specific phosphorylation site is mass spectrometry (MS). In this method, proteins are digested with protease and the peptides are separated before being sent into the mass spectrometer. The phosphopeptide is then fragmented by collison-induced dissociation (CID) and the specific phosphorylation site(s) identified. This involves the deduction of the sequence—a nontrivial exercise in the interpretation of CID data. Such interpretation can be done by de novo methods or much more easily by comparison of observed fragmentation patterns with fragments predicted from known or suspected sequences.
Phosphorylation sites are often found in very low stoichiometric yield. Even with a large number of cells to sample, the phosphopeptides can be lost among the more abundant nonphosphorylated peptides. Use of immobilized metal affinity chromatography (IMAC) has been employed to enrich the phosphorylated peptides, greatly increasing their effective concentration.2 With the nonphosphorylated peptides removed, the ability to resolve the phosphorylation sites by MS increases dramatically. Unfortunately, these enrichment techniques are not universally successful. In such cases, phosphorylation site elucidation can become a formidable challenge in mass spectrometric experimental design and data mining.
In addition to identifying phosphorylation sites, mass spectrometers can also be used to deduce stoichiometry of the phosphoproteins in comparison with the unphosphorylated forms. Absolute quantitative comparison necessitates the use of internal standards, but reasonable relative stoichiometries can be had by comparing the ion counts for phosphorylated and unphosphorylated versions of proteins, since the phosphate moiety has minimal effect on the behavior of an intact protein in the mass spectrometer. However, MS of intact proteins is not always straightforward, principally because of protein heterogeneity caused by exopeptidase activity and other modifications.
Two-dimensional electrophoresis (2DE) is another way to deduce the stoichiometry of phosphorylated proteins. The proteins are first separated by their isoelectric point and then by their molecular weight. The 80-Da phosphate does not resolve phosphoproteins from their unphosphorylated counterparts in the molecular weight dimension. However, the negative charge of the phosphate does change the isoelectric point. The result is a “phosphorylation train”—a series of spots on the gel that correspond to the molecular weight of the protein and which are separated in the isoelectric focusing dimension according to the number of phosphates they bear. Thus, the train also can reflect the existence of multiple phosphorylation events. The gel can then be analyzed with a computer program to quantify the phosphorylated forms relative to the unphosphorylated form.
Phosducin-like protein (PhLP) is found in most cells in the body.3 As its name suggests it is homologous to phosducin—a protein found only in the photoreceptor cells of the retina4 and in the developmentally related pineal gland,5 and which binds the β- and γ-subunits of the G-protein (Gβγ). PhLP has also been shown to bind Gβγ.6,7 It has also been shown to bind to the cytosolic chaperonin containing t-complex polypeptide 1 (CCT).8 Though phosphorylation of PhLP has not been shown to modulate its affinity for Gβγ,4 the affinity for the CCT complex may be regulated by phosphorylation (Lukov et al., in preparation).
PhLP has been shown to be specifically degraded in response to a serum signal, and this degradation is believed to be phosphorylation dependent.9 Knowing the sites of phosphorylation would then help to elucidate the kinase that is responsible for the regulation of PhLP degradation.
In this report, we employ electrospray quadrupole-orthogonal time-of-flight mass spectrometry (Q-TOF-MS) to elucidate serum-signal–dependent phosphorylation sites on PhLP. Automated methods for MS/MS data collection are compared with MS/MS of parent ions chosen using manual analyses. The stoichiometry of phosphorylation is determined using 2DE with and without radiolabeling.
MATERIALS AND METHODS
Protein Purification
Human PhLP (hPhLP) cDNA was subcloned from a previous construct in the pCR3.1 vector (Invitrogen, Carlsbad, CA)10 by polymerase chain reaction into the pcDNA3.1/myc-His vector (Invitrogen) with the forward primer 5′–GGA AGA GAA TTC ATG ACC ACC CTT GAT GAT AAG TTG CTG and the reverse primer 5′–TTG TTC TAG AGC ATC TAT TTC CAG GTC GCT ATC CTC AC. The product was cut with EcoRI and XbaI restriction endonucleases and was inserted into the pcDNA3.1/myc-HisB vector at the EcoRI and XbaI sites, generating an hPhLP construct with a c-myc epitope tag and a hexahistidine purification tag. The hPhLP-myc-His construct was then subcloned into the bacterial expression vector pET15b (Novagen, Madison, WI) by polymerase chain reaction amplification with the forward primer 5′–AA CCA ATC ATG ACC ACC CTT GAT GAT AAG TTG C and the reverse primer 5′- A CCA GGA TCC TCA ATG GTG ATG GTG ATG ATG ACC. The product was cut with PagI and BamHI restriction endonucleases and inserted into the pET15b vector at the NcoI and BamHI restriction sites. The integrity of all constructs was confirmed by sequence analysis. The construct was transformed into RbCl2 competent DE3 Escherichia coli by heat shock. The protein was expressed and purified using a Pro-bond nickel-chelate column (Qiagen, Valencia, CA) as described previously.7 The buffer was exchanged into isotonic buffer (10 mM HEPES, 100 mM KCl, 20 mM NaCl, 2 mM MgCl2, 1 mM EDTA, 1 mM dithiothreitol) using an Ultrafree centrifuge concentrator (Millipore, Billerica, MA) and the protein was concentrated to about 2 mg/mL.
Determination of the Effect of Serum on Phosphorylation
Chinese hamster ovary (CHO) cells were grown to approximately 60% confluence on 100-mm plates in Gibco Dulbecco’s modified Eagle’s medium (DMEM) complete media with 10% fetal bovine serum (FBS). Cells were then serum-starved for approximately 48 h, followed by stimulation with 10% FBS for 1 h. After washing with phosphate-buffered saline (PBS), cells were harvested in 300 μL PBS with 4 mM dithiothreitol and disrupted by repeated trituration through a 25G needle. This cell extract was diluted 20% with stock solutions containing phosphorylation reaction components to give final concentrations of 0.2 mg/mL PhLP, 2 mM ATP, 2 mM MgCl2, 0.05 μCi/μL 32P-γATP. The mixture was incubated at 37°C, and aliquots corresponding to 3.5 μg PhLP were removed and the reactions stopped by mixing with 10 μL 4X Laemmli sample buffer at desired time points between 10 and 80 min. Samples were then run on sodium dodecyl sulfate-polyacrylamide gel electrophoresis (SDS-PAGE), stained with Coomassie blue, dried on Whatman filter paper, and the radioactivity visualized using a Storm 860 phosphorimager (Molecular Dynamics, Sunnyvale, CA).
Phosphorylation of hPhLP for Mass Spectrometric Analyses
CHO cells were grown to approximately 80% confluence on 100-mm plates in Gibco DMEM complete media with 10% FBS, then serum-starved for approximately 40 h. The cells were then fed 10% serum for 2.5 h before being harvested. The cells were washed twice with 2 mL PBS then harvested in 0.5 mL PBS containing 4 mM dithiothreitol and 1 mM phenylmethylsulphonylfluoride. Cells were then lysed by trituration through a 21G needle 12 times. The phosphorylation mixture [12 μL 0.1 M dithiothreitol, 2.4 μL 1 mM microcystin-LR (Cal-Biochem, San Diego, CA), 80 μL 50 mM MgCl2, 10 μL 0.5 M ATP, pH 7.0, and 200 μL hPhLP-myc-His (aproximately 0.4 mg)] was then added to the extract and incubated at 37°C for 1 h. The mixture was spun at 18,000 × g for 5 min and the pellet discarded. The protein was then repurified on the nickel-chelate column and the buffer exchanged to isotonic buffer.
Identification of Phosphorylation Sites
Samples were analyzed on an Applied Biosystems (Framingham, MA) API Qstar Pulsar i mass spectrometer with an online LC Packings (Dionex, Sunnyvale CA) UltiMate Plus Capillary LC System). Ten picomoles of a tryptic digest of each sample was run through a 15 cm × 250-μm-ID column packed with Jupiter C18 10-μm reversed-phase resin (Phenomenex, Torrence, CA). An initial gradient of 2.2%/min to a concentration of 60% acetonitrile in 0.1% formic acid was applied to the column, followed by a 3.5%/min gradient up to a concentration of 95% organic phase. The HPLC was controlled by the mass spectrometer software (Analyst, Applied Biosystems) and a FamOS autosampler (Dionex). The column effluent was analyzed in information-dependant acquisition (IDA) mode on the mass spectrometer. This mode completes a survey scan (full MS scan) and then performs MS/MS on the three most intense peaks from the survey scan, as long as they have not been chosen for fragmentation in the last 2 min. Data were collected for m/z 500–2500 over a 55-min interval. The IDA spectra were reconstructed using the BioAnalyst software and searched in the Mascot database with and without an extra 80 Da corresponding to phosphorylation. Molecular ions of m/z predicted for possible phosphorylation sites were selected as parent ions in LC-MS/MS experiments. CID spectra were compared with theoretical peptide fragments to deduce specific phosphorylation sites.
2DE Gel Analysis
Unphosphorylated and phosphorylated samples of PhLP were run on 2DE. Immobilized 7-cm pH 4–7 gradient strips were run on a Multiphor II apparatus (Amersham Bioscience, Piscataway, NJ) for the first dimension. The second dimension was run on a 10% SDS-PAGE gel. The gel was washed and stained with colloidal Coomassie (Pierce, Rockford, IL). Gel images were captured using the AlphaDigiDoc system (Alpha Innotech, San Leandro, CA) and analyzed using Melanie 4 software (GeneBio, Geneva, Switzerland).
32P-Labeled PhLP 2DE Gel
The protocol for CHO phosphorylation was followed with the several changes: 30 μL CHO extract, 5 μL PhLP-myc-His (10 μg), 2 μL 50 mM MgCl2, 1 μL 0.06 mM microcystin-LR, 1 μL 125 mM ATP, 1 μL 0.03 M dithiothreitol, and 10 μCi 32P-γATP were used. A 2DE gel was run and stained as above, dried onto Whatman filter paper, and the radioactivity was visualized using a Storm-860 phosphorimager (Molecular Dynamics, Sunnyvale, CA).
RESULTS AND DISCUSSION
Phosphorylation of PhLP by CHO
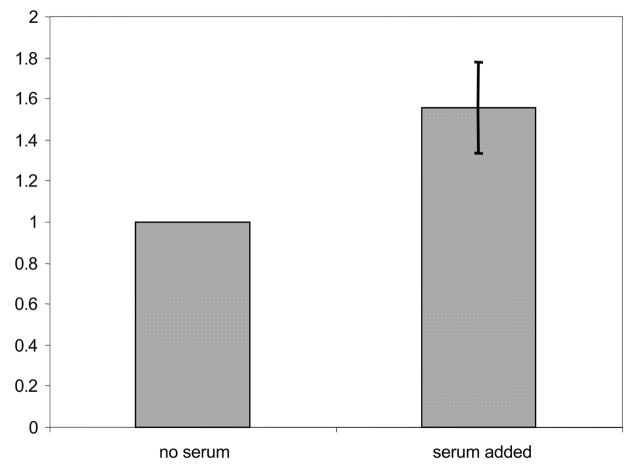
PhLP was phosphorylated as described in Materials and Methods with 32P-γATP using extract from CHO cells that had been serum starved or serum stimulated following serum starvation. Aliquots were taken at various times and the reaction quenched with 4X Laemmli buffer, run on SDS-PAGE, and the radioactive PhLP band quantified using the phosphorimager (Fig. 1). Phosphorylation occurred in both samples with only kinetics being affected, as later time points show a convergence in the extent of phosphorylation (data not shown). The serum-stimulated CHO extract is shown to phosphorylate PhLP and at a faster rate compared with extract from serum-starved cells.
FIGURE 1.
Effect of serum on the phosphorylation of phosducin-like protein (PhLP) with Chinese hamster ovary (CHO) extract. PhLP was phosphorylated as described in Materials and Methods with 32P-γATP using kinases found in extract from CHO cells that had been serum starved (no serum) or serum stimulated following serum starvation (serum added). Aliquots were taken at various times and the reactions quenched with 4X Laemmli buffer, run on SDS-PAGE, and the radioactive PhLP band quantified using the phosphorimager. Shown is the 10-min time point. Only kinetics is affected, as later time points show a convergence of the amount of phosphorylation. The phosphorylation is normalized to that found in absence of serum stimulation. The error bar represents the standard deviation from four independent experiments.
Stoichiometry of Phosphorylation
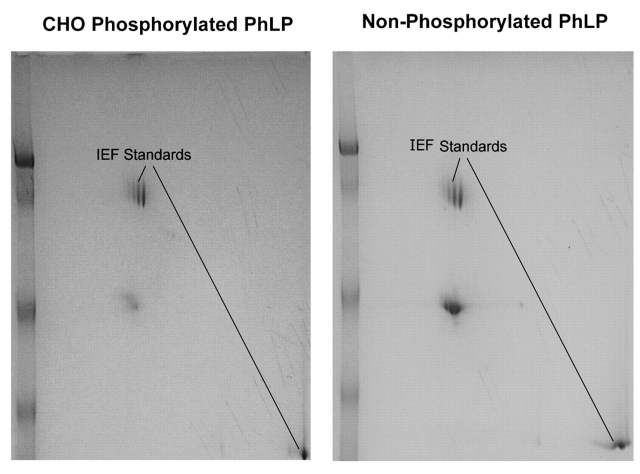
The 2D gels of PhLP phosphorylated by CHO extract and nonphosphorylated PhLP were compared using Melanie software. Determination of the stoichiometry and the number of phosphorylation sites by 2D gel analysis alone requires good spot resolution. Visualization was first tried by comparing phosphorylated and nonphosphorylated PhLP (Fig. 2). Comparisons were inadequate with the Melanie software so a different method was sought. Radiolabeling was used to obtain better visualization of the phosphorylated forms of the protein. Melanie was able to measure the intensities of the spots from the phosphorimage and obtain the stoichiometry of phosphorylation (Fig. 3). Comparison of the phosphorimage and Coomassie-stained radiolabeled PhLP showed that the protein was quantitatively phosphorylated at at least one residue. Significant populations of PhLP with one to four phosphates were found with decreasing stoichiometry from 36% with one phosphate to 17% with four phosphates. Only four spots, implying at least four phosphorylation sites, were observed on the gel in a “phosphorylation train.”
FIGURE 2.
2D Gel analysis of the stoichiometry of phosphorylation. Unphosphorylated and phosphorylated samples of phosducin-like protein were run on 2DE. Immobilized, 7-cm, pH 4–7 gradient strips were run on the Multiphor II apparatus for the first dimension. The second dimension was run on a 10% SDS-PAGE gel. The gel was stained with colloidal Coomassie. Gel images were captured using the AlphaDigiDoc system and analyzed using Melanie 4 software.
FIGURE 3.
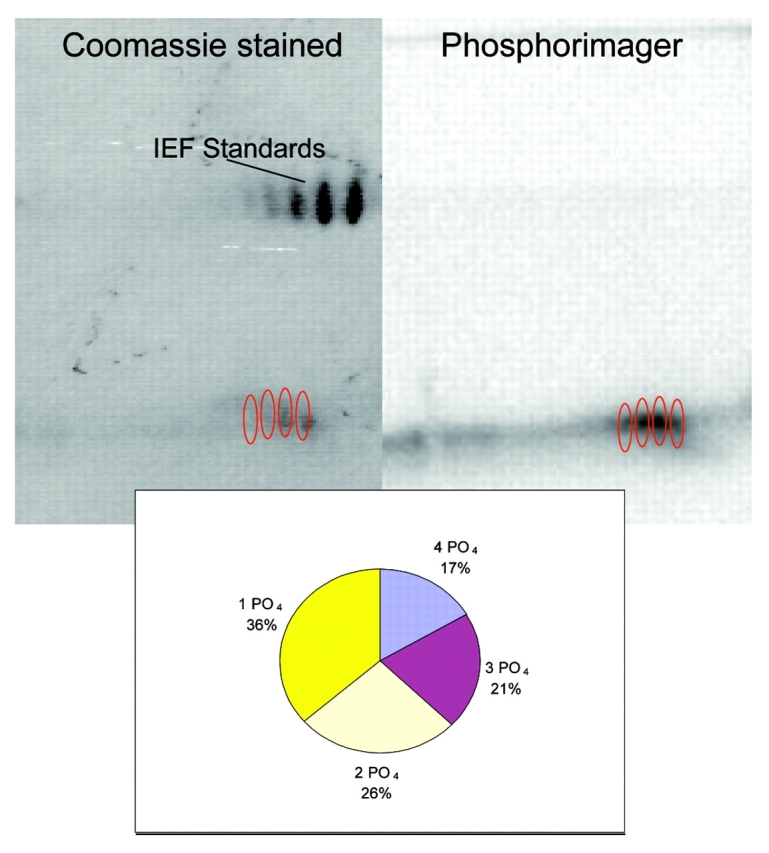
2D Gel analysis of the stoichiometry of phosphorylation using 32P-γATP. The protocol was followed for phosducin-like protein phosphorylation with 32P-γATP. A 2DE gel was run and stained as in Figure 2, dried onto Whatman filter paper, and the radioactivity visualized using a phosphorimager. Melanie software was used to determine intensities of spots for phosphorylation comparison.
Identification of Phosphopeptides of PhLP
Phosducin-like protein was phosphorylated using serum-stimulated CHO cell extract, repurified, and digested with trypsin. The peptides were then separated by reverse phase LC and analyzed by online electrospray MS using automated CID (called information-dependent data acquisition, or IDA). The LC-MS reconstruct (an algorithm that interprets the spectra to enumerate the molecular species represented) suggested four potential phosphorylation sites when compared with the theoretical digest of the PhLP sequence. Comparing this reconstruct with the LC-MS reconstruct from an IDA MS analysis of digested unphosphorylated PhLP showed that these species were absent in the unphosphorylated digest, supporting their candidacy as phosphopeptides. Confirmation of these potential phosphopeptides, as well as the identification of the modified residues, necessitated fragmentation by CID.
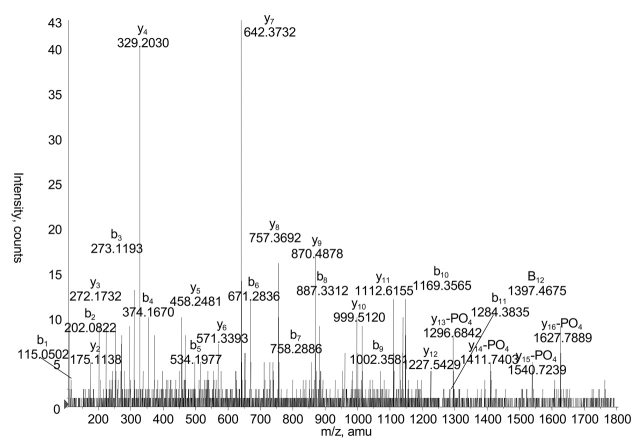
In the initial IDA experiments the computer chose a limited number of potential phosphopeptide candidates for fragmentation. Automated CID was performed on a molecular species corresponding to a singly phosphorylated T37 (trypsin-cleaved peptide no. 37) peptide (N287SATCHSEDSDLEID301ALEGPR, these last six amino acids being from the linker region of the fusion protein). This CID spectrum identified a phosphorylation site at Ser296 (Fig. 4).
FIGURE 4.
Chinese hamster ovary phosphorylation of NSATCHSEDS(PO4) DLEIDALEGPR. Collison-induced dissociation spectrum, in information-dependant acquisition mode of the parent ion at m/z 1198.5 is shown, representing amino acids 287–301 plus one phosphate. The y13 through y16 ions confirm the presence of a dehydroalanine resulting from loss of phosphate upon fragmentation at position 296.
Additional phosphorylation site candidates were found among peptides toward the amino terminus of the protein. Two masses observed matched both singly and doubly phosphorylated versions of the T3-T4 read-through peptide (L13QYYYSSSEDEDSDHEDKDR32). Automated CID was only performed on the more abundant singly phosphorylated T3-T4 peptide, choosing both the singly and doubly charged molecular ions as parents. Subsequent MS/MS has failed to delineate the specific sites, but did confirm singly and doubly phosphorylated forms of this peptide (Figs. 5–7). A fourth phosphorylation site has also been found, and is described elsewhere (Kankipati et al., in preparation).
FIGURE 5.
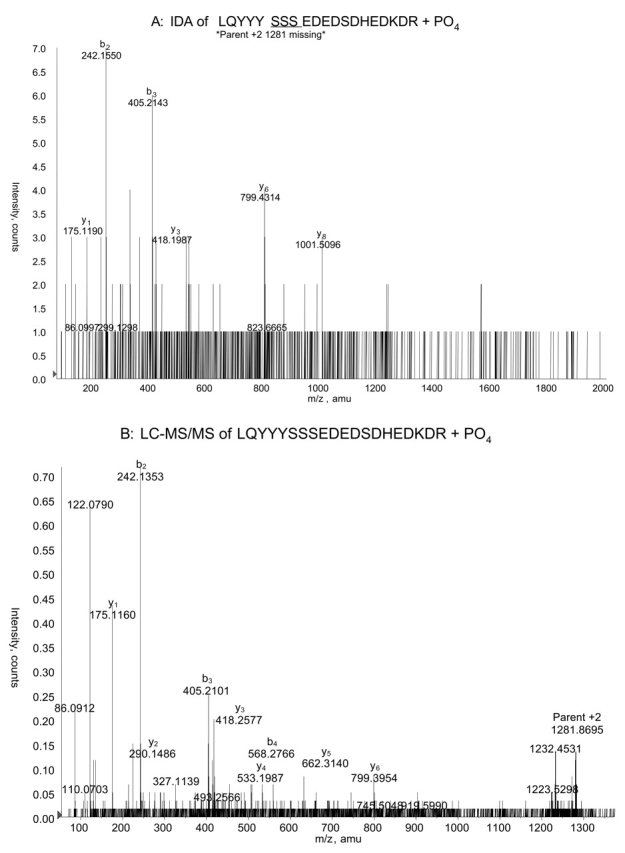
Doubly charged ion showing phosphorylation of phosducin-like protein at one of three consecutive serines, Ser18–Ser20. A: Collison-induced dissociation (CID) of the +2 charged parent ion at m/z 1281 chosen automatically in information-dependant acquisition mode. This species represents amino acids 13–32 with one phosphate. The y8 ion excludes the possibility of phosphorylation at Ser25. B: CID of the same parent ion chosen by hand for LC-MS/MS.
FIGURE 7.
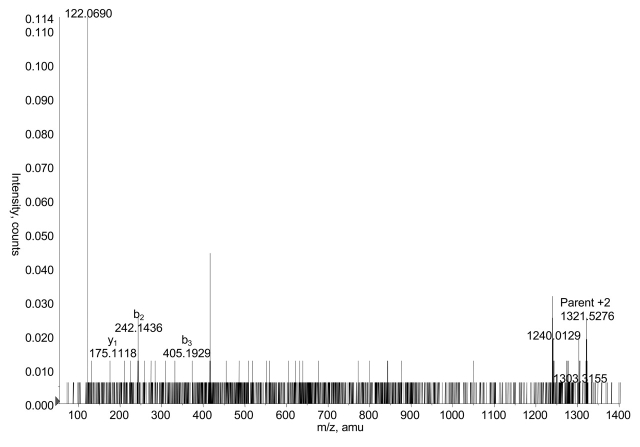
Double phosphorylation of phosducin-like protein on the 13–32 peptide. Collison-induced dissociation spectrum, chosen by hand for LC-MS/MS, of the parent ion at m/z 1321.5 is shown, representing amino acids 18–32 plus two phosphates. Fragment ions support identification of this peptide, but do not allow delineation of the phosphorylation sites within the peptide. The doubly charged fragment ion at m/z 1240 is a result of two lost phosphates.
Comparison of Automated Collison-Induced Dissociation and Manual LC-MS/MS
We tested whether the quality of MS/MS data was better when automated in the IDA process or when LC-MS/MS was done choosing a specific parent ion manually. This comparison was carried out using the two charge states of the singly phosphorylated T3-T4 peptide. For the +2 charge state of this phosphopeptide at m/z 1281, the spectrum gave more fragment peaks that were informative and a better signal-to-noise ratio when the parent ion for LC-MS/MS was chosen manually (compare Figs. 5A and B). However, this LC-MS/MS spectrum did not enable identification of the specific site of phosphorylation, while the IDA spectrum did produce a fragment that delineated phosphorylation to one of the three consecutive serines at positions 18–20. When the +3 charge state of this phosphopeptide was analyzed, it yielded a less informative spectrum in the LC-MS/MS analysis compared with the IDA analysis (Figs. 6A and B). The lower quality of the CID spectrum resulting from manual LC-MS/MS was probably due to the collision energy during the LC-MS/MS run. In IDA mode the collision energy is continuously changing or “rolling,” while the mass spectrometer control software allows only static collision energy in the LC-MS/MS mode.
FIGURE 6.
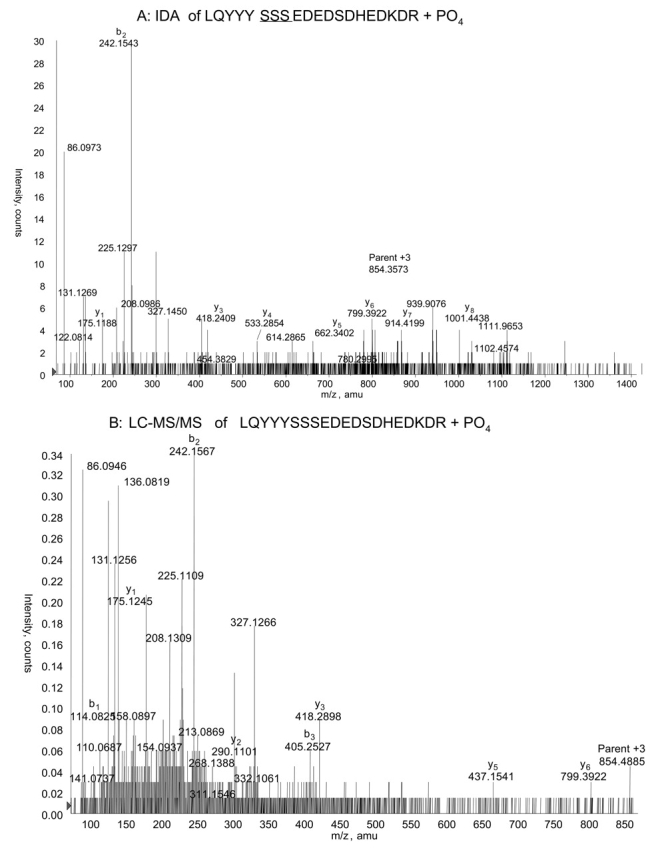
Triply charged ion showing phosphorylation of phosducin-like protein at one of three consecutive serines, Ser18–Ser20. A: Collison-induced dissociation (CID) of the +3 charged parent ion at m/z 854, chosen automatically in information-dependant acquisition mode. This species represents the same phosphopeptide as in Figure 5. Again, the y8 ion excludes phosphorylation at Ser25. B: CID of the same parent ion chosen by hand for LC-MS/MS.
One obvious advantage of manual LC-MS/MS is the ability to choose parent ions not selected automatically by IDA. In normal IDA, the T3-T4 doubly phosphorylated peptide was not automatically chosen to be fragmented due to its low abundance. The LC-MS/MS analysis, where this molecular ion was hand designated for fragmentation, was able to yield a somewhat informative CID spectrum that supports the identification of this peptide (Fig. 7).
Overall, the discovery of phosphorylation sites is still a difficult procedure. Previous knowledge of the protein sequence in question greatly facilitates identifying candidate phosphopeptides. However, even when the phosphopeptides are known, fragmentation that conclusively delineates the site of phosphorylation cannot always be accomplished. The signal-to-noise ratio of the phosphopeptide parent ions or their fragmentation tendencies could be poor. A useful feature would be a rolling collision energy in LC-MS/MS to get a more robust overall fragmentation pattern for phosphopeptides. This would give more fragments of the peptide, which, in turn, would improve the probability of delineating the phosphorylation sites.
Acknowledgments
This work was supported by National Institute of Health Grant EY12287 (to B.M.W.)
REFERENCES
- 1.Mann M, Ong SE, Gronborg M, Steen H, Jensen ON, Pandey A. Analysis of protein phosphorylation using mass spectrometry: Deciphering the phosphoproteome. Trends Biotechnol 2002;20:261–268. [DOI] [PubMed] [Google Scholar]
- 2.Ficarro SB, McCleland ML, Stukenberg PT, et al. Phosphoproteome analysis by mass spectrometry and its application to Saccharomyces cerevisiae. Nat Biotechnol 2002;20:301–305. [DOI] [PubMed] [Google Scholar]
- 3.Miles MF, Barhite S, Elliott M. Phosducin-like protein: An ethanol-responsive potential modulator of guanine nucleotide-binding protein function. Proc Natl Acad Sci USA. 1993;90:10831–10835. [DOI] [PMC free article] [PubMed] [Google Scholar]
- 4.Thulin CD, Howes K, Driscoll CD, et al. The immunolocalization and divergent roles of phosducin and phosducin-like protein in the retina. Mol Vis 1999;5:40. [PubMed] [Google Scholar]
- 5.Reig JA, Yu L, Klein DC. Pineal transduction. Adrenergic → cyclic AMP-dependent phosphorylation of cytoplasmic 33-kDa protein (MEKA) which binds beta gamma-complex of transducin. J Biol Chem 1990;265:5816–5824. [PubMed] [Google Scholar]
- 6.Thibault C, Sganga MW, Miles MF. Interaction of phosducin-like protein with G protein betagamma subunits. J Biol Chem 1997;272:12253–6. [DOI] [PubMed] [Google Scholar]
- 7.Savage JR, McLaughlin JN, Skiba NP, Ha HE, Willardson BM. Functional roles of the two domains of phosducin and phosducin-like protein. J Biol Chem 275, 30399–407. (2000). [DOI] [PubMed] [Google Scholar]
- 8.McLaughlin JN, Thulin CD, Hart SJ, Resing KA, Ahn NG, Willardson BM. Regulatory interaction of phosducin-like protein with the cytosolic chaperonin complex. Proc Natl Acad Sci USA 99, 7962–7. (2002). [DOI] [PMC free article] [PubMed] [Google Scholar]
- 9.Kankipati, S. Extracellular response kinase-induced degradation of phosducin-like protein and G-protein beta-gamma subunits by the ubiquitin/proteasome system. Master’s Thesis, Department of Chemistry & Biochemistry, Brigham Young University: Provo, UT, pg. 29.
- 10.Lazarov, M. E., Martin, M. M., Willardson, B. M. & Elton, T. S. Molecular cloning and characterization of the human phosducin-like protein promoter. Biochimica et Biophysica Acta 1492, 460–464 (2000). [DOI] [PubMed] [Google Scholar]


