Abstract
We have investigated the use of a top-down liquid chromatography/mass spectrometric (LC/MS) approach for the identification of specific protein biomarkers useful for differentiation of closely related strains of bacteria. The sequence information derived from the protein biomarker was then used to develop specific polymerase chain reaction primers useful for rapid identification of the strains. Shiga-toxigenic Escherichia coli (STEC) strains were used for this evaluation. The expressed protein profiles of two closely related serotype 0157:H7 strains, the predominant strain implicated in illness worldwide, and the nonpathogenic E. coli K-12 strain were compared with each other in an attempt to identify new protein markers that could be used to distinguish the 0157:H7 strains from each other and from the E. coli K-12 strain. Sequencing of a single protein unique to one of the 0157:H7 strains identified it as a cytolethal distending toxin, a potential virulence marker. The protein sequence information enabled the derivation of genetic sequence information for this toxin, thus allowing the development of specific polymerase chain reaction primers for its detection. In addition, the top-down LC/MS technique was able to identify other unique biomarkers and differentiate nearly identical 0157:H7 strains, which exhibited identical phenotypic, serologic, and genetic traits. The results of these studies demonstrate that this approach can be expanded to other serotypes of interest and provide a rational approach to identifying new molecular targets for detection.
Keywords: Biomarkers, mass spectrometry, LC/MS
Pathogenic Escherichia coli groups are classified based on a particular set of virulence factors that are responsible for the different clinical manifestations of the infection. Of these, enterohemorrhagic E. coli (EHEC) has emerged as an important foodborne pathogen that causes bloody diarrhea or hemorrhagic colitis (HC), which may progress into the more severe, hemolytic uremic syndrome (HUS).1,2 EHEC are characterized by the production of Shiga toxins (Stx); however, there are more than 200 Shiga toxin-producing E. coli (STEC) serotypes and not all have been implicated in illness. Therefore, EHEC is a small subset of STEC and comprises strains that have the same clinical, epidemiological, and pathogenic features.1 Other EHEC virulence factors include the eae gene that encodes for intimin, a cellular attachment protein, and the presence of a 90-kb plasmid that carries several putative virulence factors, including the ehxA gene that encodes for enterohemolysin.1 EHEC strains are phenotypically diverse such that no single microbiological assay is suitable for detecting all the strains within the group. Although serotype 0157:H7 is the prototypical EHEC strain and most often implicated in illness worldwide, other serotypes, such as 0111:H8, 026:H11, 0103:H2, 0113:H2, 0104:H21, have also caused human illness and are recognized as EHEC.3 Many of the known virulence factors shared by EHEC strains are phage-encoded or reside on plasmids, making it difficult to use genetic assays such as polymerase chain reaction (PCR) to characterize the various heterogeneous strains that cause a similar disease. Also, and perhaps more importantly, the mere presence of a gene doesn’t necessarily indicate transcription or expression of a protein that may be required for causing disease. Studies have shown that bacterial pathogens are known to harbor genes that are not expressed, perhaps due to genetic deletions, mutations, or other factors.4–6 For these reasons, EHEC strains provide a useful model system for accessing the effectiveness of various proteomics approaches.
Most comparative analyses of proteins expressed by closely related biological samples have used 2-dimensional polyacrylamide gel electrophoresis (2D PAGE).7,8 However, this method is time consuming and difficult to reproduce. More recent efforts have focused on using liquid chromatography/mass spectrometry (LC/MS) with either a top-down9–12 or bottom-up13–15 approach. The top-down approach looks at the overall protein expression profile to single out unique proteins that are then sequenced and identified. The bottom-up approach involves proteolytic digestion of all the proteins in the sample and relies on database analysis or de novo sequencing of the individual peptides to identify the source proteins in the sample. Using current chromatography technology, peptides are easier to separate and quantify16–20 than whole proteins and, therefore, the bottom-up approach has been the method of choice for many comparative protein expression studies. This approach, however, generates enormous amounts of data that require efficient and accurate software to derive meaningful correlations. More importantly, small changes in proteins can be easily overlooked during the analysis of large of amounts of data.
To avoid some of these difficulties associated with the bottom-up approach, we have developed a method that uses the top-down approach for generating bacterial protein profiles from the LC/MS chromatogram of whole bacterial cell lysates.21 The method translates the chromatographic and multiply charged protein information into a comprehensive mass-versus-intensity spectrum, which can be used to compare and identify differences in bacterial protein expression profiles. Any unique proteins that are identified can be purified, sequenced, and examined for alterations in primary sequence and/or posttranslational modifications. Furthermore, the genetic sequence of the protein can be deduced and used to design target-specific PCR primers to detect these unique biomarkers. We have recently used this technique to develop a specific PCR assay to detect pathogenic stains of Vibrio parahaemolyticus.22
In this study, we applied the top-down LC/MS technique to examine strains of EHEC that were isolated from HUS patients, as well as very closely related 0157:H7 strains that exhibited identical phenotypes, to look for unique protein biomarkers that may be involved in EHEC pathogenesis or can be targeted by PCR assays to specifically detect the strains that produce these markers.
MATERIALS AND METHODS
Bacterial Strains
E. coli strain K-12 was obtained from our own culture collection. E. coli strain 35150 (EDL933) is an 0157:H7 serotype and obtained from the American Type Culture Collection, Manassas, VA. This strain produces both Stx1 and Stx2 and carried all the other trait EHEC virulence factors as determined by PCR.6 Strain 493/89 was obtained from H. Karch (University of Münster, Germany) and is a phenotypic variant of 0157:H− serotype, which, unlike typical 0157:H7 strain, ferments sorbitol, has β-glucuronidase activity and is nonmotile. The strain produces only Stx2 and was isolated from HUS patients in Germany.23 Strains TT12A and TT12B are an isogenic pair of 0157:H7, which exhibited identical phenotypic, serologic, and genetic markers tested, except that TT12B does not produce either Stx1 or Stx2.24 Strain 3024–94 is an EHEC strain of 0104:H21 serotype that was isolated from HC patients that produces Stx2 and enterohemolysin.25
Sample Preparation
Bacterial cells grown overnight at 37°C on a tryticase soy agar plate were scraped off with a sterile swab and resuspended in 1 ml of 70% ethanol. The cells were vortexed to a slurry and 100 μL was transferred to a microfuge tube and centrifuged to a pellet. After discarding the ethanol, the cells were mixed with 1 mL of the extraction solution consisting of a 50:45:5 mix of acetonitrile (J.T. Baker, Phillipsburg, NJ), HPLC-grade water (J.T. Baker, Phillipsburg, NJ), and formic acid (Sigma Aldrich, St. Louis, MO). The microfuge tubes were placed in an ultrasonic water bath (Sonicor, Copiague, NY) and gently sonicated at room temperature for 30 min. The cells were centrifuged to pellet the debris and the supernatant was analyzed.
LC/MS
An Agilent 1100 HPLC system (Palo Alto, CA) fitted with a 20 cm × 1.0 mm i.d. Poroshell (Agilent) LC column was used to separate the proteins of the whole-cell bacterial extract. Ten microliters of the sample was injected onto the column and the separation was carried out at a flow of 250 μL/min with a very shallow (10–50% B in 50 min) gradient. Mobile phase A was 5% acetic acid in water while mobile phase B was 5% acetic acid in acetonitrile. The flow was split so that only 25% of the flow reached the mass spectrometer. The remainder was diverted to an HP1100 fraction collector. The fraction collector was used to collect fractions in 1.0-min intervals. Monitoring by mass spectrometry was maintained to assure that there were no changes in the chromatography that would hinder the pooling of fractions from multiple runs and to facilitate determining which fractions contained the desired proteins.
The fraction containing the protein of interest was evaporated to dryness and reconstituted in 50 μL of Rapigest (Waters, Milford, MA), a proprietary anionic detergent solution. The protein was incubated at 37°C with 1 μmol of modified trypsin (Promega, Madison, WI) for 2 h for complete protein digestion. Eight microliters of the protein digest was injected onto a Symmetry300 (Waters) C18 column with dimensions of 150 mm × 0.320 mm i.d. Chromatography was completed using the capillary HP1100 with the same mobile phase and gradient as was used in the analytical separation but with a flow rate of 20 μL/min.
MS and MS/MS experiments were performed on a QTOF II (Waters). Automated analysis of the full scan (MS) data was performed with ProteinTrawler, custom software written for this purpose by BioAnalyte, Inc. (Portland, ME). The function of this program is to automate data processing subroutines within the main data processing program and to produce a combined mass, time, and intensity text output file. A detailed explanation of this program has been published.21 Briefly, the program sums all data within a specified time interval (usually 30 or 60 sec), uses MaxEnt 1 to deconvolute the multiply charged ions, centers the result, performs a threshold selection, and reports the mass, intensity, and retention time of the protein in a text file. It continues this process across sequential portions of the chromatogram. All aspects of the subroutines including retention times, mass windows, number of MaxEnt 1 iterations, and spectra to combine can be controlled by the user through ProteinTrawler.
Upon completion of the ProteinTrawler program, the text file contains a cumulative list of all the protein masses that were observed upon deconvolution of the individual summed spectra. This text file records mass, intensity, and retention time. The retention time information is held in the text file for the user to reference if a protein is singled out or deemed significant for further study, and thereby facilitates the isolation and purification process. It can also be used to verify that proteins of the same mass are actually two unrelated proteins as indicated by their different retention times. A graphing program such as Grapher v3 (Golden Software, CO) or MS manager v8.0 (Advanced Chemistry Development, Toronto, ON) can read the file and display the data.
Protein sequencing and analysis of the MS/MS sequence data was performed with the PepSeq program of ProteinLynx software (Micromass, UK). Proteins were identified with ProteinInfo of PROWL (http://65.219.84.5/service/prowl/proteininfo.html) and the nonredundant database of the National Center for Biotechnology Information (NCBI).
PCR Detection
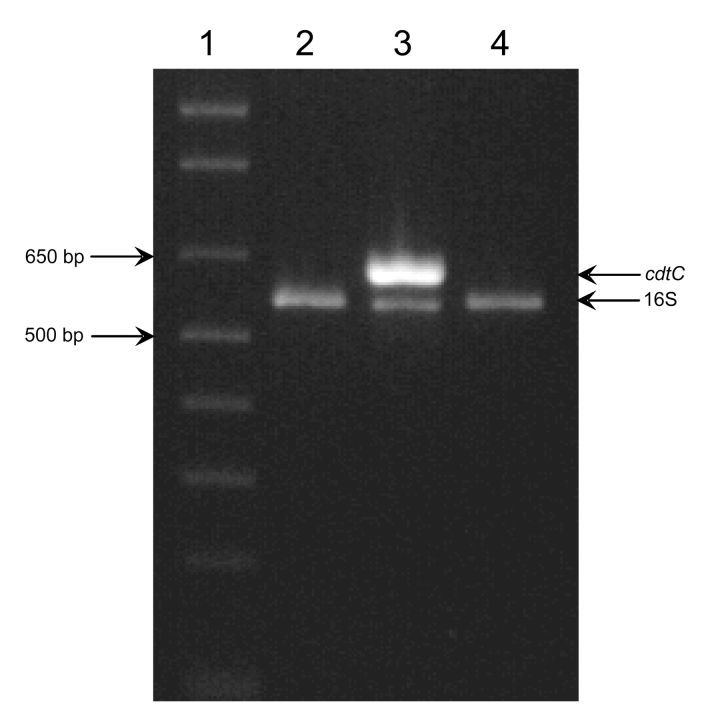
Genomic DNA from each strain was isolated as previously described.26 PCR primers that flank the E. coli 493/89 cdtC open reading frame were designed using the sequence data present in the GenBank database (accession number AJ508930). Individual reactions (50 μL) contained 1X Taq polymerase buffer (Qiagen, Valencia, CA), 2.0 mM MgCl2, 200 μM dNTP, 300 nM each of the cdtC-F (5′ CGT TTC CAG ACG ATA AAA GAG GC) and cdtC-R (5′ ATT ATG GTC ATG CTT TGT TAT ATG CC) primers, 100 nM each of the SRM86 (5′ GCT AGT TGG TAA GGT AAC GGC T) and SRM87 (5′ GTG GAC TAC CAG GGT ATC TAA TC) primers, 16S rDNA gene-specific primers that serve as reaction controls, approximately 250 ng genomic DNA template, and 2.5 U of HotStarTaq DNA polymerase (Qiagen). The PCR reaction was initiated with a single 95°C for 15 min incubation to activate the polymerase. Amplification of target DNA was facilitated with 30 successive cycles, each consisting of a 95°C for 30 sec denaturation period, a 58°C for 20 sec annealing period, and a 72°C for 30 sec extension incubation. The reaction was terminated with a single 72°C for 7 min incubation. Target detection was accomplished by electrophoresis of 10 μL of each reaction on a 1% Tris-borate EDTA agarose gel at 100 V (constant) and visualization on a UV transilluminator. Reactions producing the 628 bp cdtC and the 562-bp 16S rDNA amplicons were positive for the cdtC target, while those producing only the 16S rDNA amplicon were negative. Samples producing neither amplicon were not evaluated.
RESULTS AND DISCUSSION
Bottom-up proteomic approaches have the advantage that separation of whole proteins is not required and all chromatographic methods are instead focused on tryptic peptides. Current chromatographic technology for small peptides is quite sophisticated with reverse phase, cation/anion exchange, and isoelectric focusing techniques being utilized in multidimensional separations. However, this method generates a very substantial amount of data, most of which is redundant and not necessary to monitor changes in the protein profile of a particular species. Since most proteins (> 90%) of closely related strains are identical, sequencing and identifying them would provide little or no useful information, thus distracting from the purpose of the experiment, which is to identify differences in the strain’s protein profile. Also, protein differences between strains are often small changes in the amino acid sequence of the protein rather than an obvious absence or presence of the protein.
A much simpler method is to compare the molecular weights of the whole proteins. Once a protein is determined to be of interest, it is a simple matter to isolate, digest, sequence, and identify it in the absence of the proteins that are the same between samples. We have previously shown how the top-down approach can be used to identify a protein that can be used as a marker for a pathogenic strain of V. parahaemolyticus.22 A reproducible protein fingerprint of the bacterium with few differences observed was obtained using the LC/MS method followed by ProteinTrawler processing of the data.
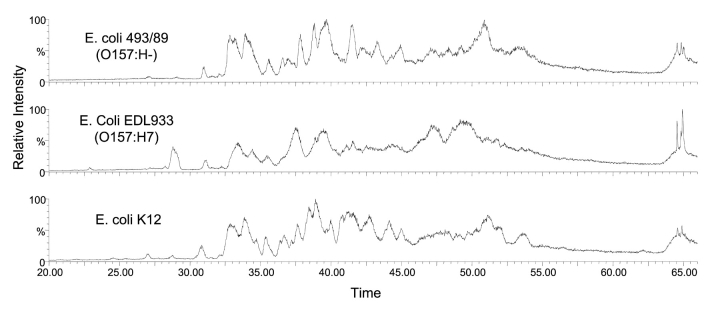
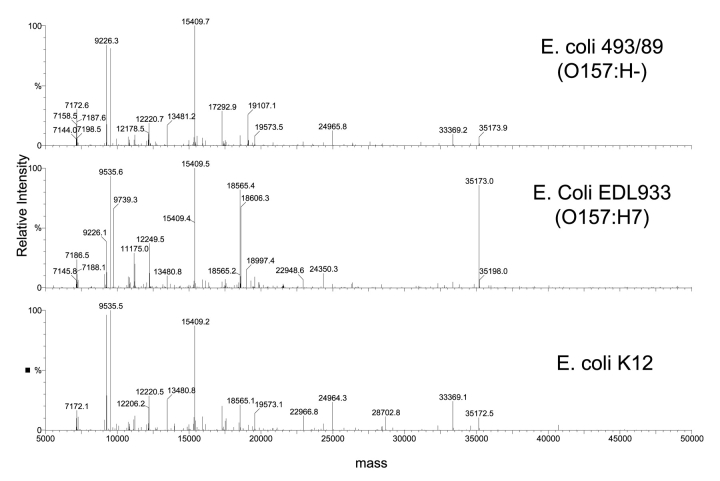
In this study, we used the top-down LC/MS approach to examine the protein profiles of two EHEC strains that were isolated from HUS patients, yet differed significantly in phenotypes, and compared them to the laboratory strain, E. coli K-12. The total ion chromatograms of the three strains are shown in Figure 1. ProteinTrawler was used to sum the spectra in 30-sec intervals beginning at 20 min and ending at 67 min. The multiply charged spectra of each 30 sec interval was deconvoluted using MaxEnt 1, and a text list of masses and their intensities was compiled. The protein profiles generated via this process of 0157:H7, its phenotypic variant 0157:H− and K-12 were found to share many similarities (Fig. 2). Interestingly, the profile of the variant 0157:H− strain more closely resembled the protein profile of the K12 strain than that of the prototypical 0157:H7 strain. This is consistent with the genetic evolutionary evidence that these 2 EHEC strains are closely related, yet took divergent pathways.27
FIGURE 1.
Total ion chromatograms obtained by LC/MS of three strains of E. coli.
FIGURE 2.
Single representative cellular protein spectra of three strains of E. coli.
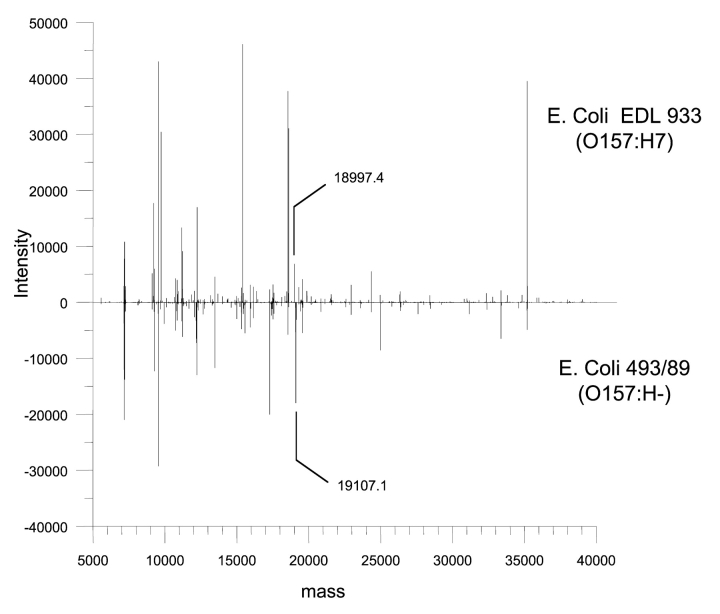
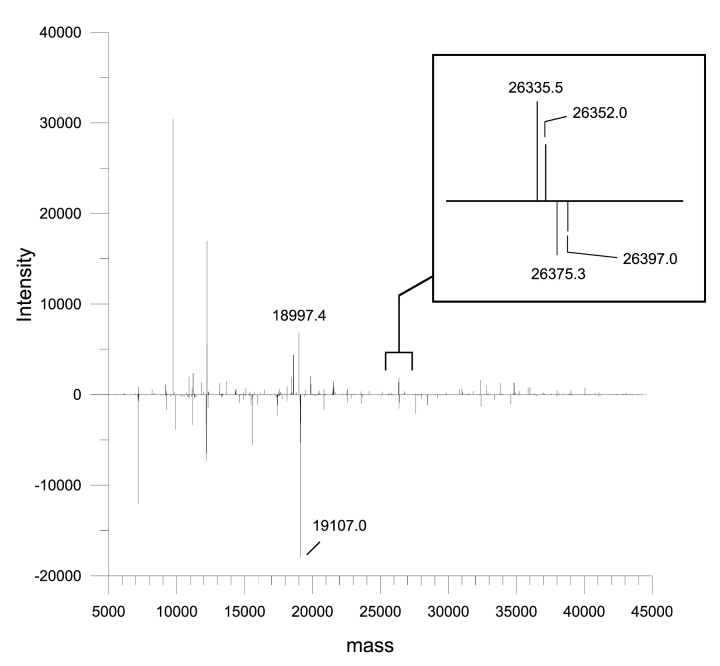
Comparison of the two EHEC strains in a reflected plot of their respective protein profiles (Fig. 3) showed some obvious differences. However, identifying the difference and comparing them with other profiles is a somewhat tedious matter. To simplify this process, we subtracted all common proteins from each profile that had a similar mass around our known mass accuracy (+2 Da) to generate a new profile (Fig. 4), which enabled easier identification of unique proteins. In this case, a number of potential candidates were identified. For example, a unique protein of 18,997 Da was found in the 0157:H7 strain. It was isolated, sequenced, and identified as a hypothetical protein (NP_287942). In the same manner, the 0157:H− strain had a unique protein with a molecular mass of 19,107 Da that was identified as a cytolethal distending toxin C (CdtC) (CAD48851). According to the database, the expected mass of the CdtC protein should be 19,990 Da; hence, this result suggests that there may be variations within or modification to the CdtC protein.
FIGURE 3.
Representative protein profiles of a motile (EDL 933) and a nonmotile (493/89) serotype 0157:H7 strain of E. coli.
FIGURE 4.
Representative protein profiles of the two 0157:H7 strains after the subtraction of protein masses that were identical between the two strains. The two species are shown to have more than 25 different protein masses. It is unclear whether these are different proteins or simply whether a protein has undergone a posttranslational modification or sequence mutation giving rise to a different molecular mass.
To illustrate how protein sequence information derived from this approach could be used to identify possible PCR targets, the genetic sequence for the E. coli 493/89 cdtABC locus was analyzed. Primers were then designed that flanked the cdtC open reading frame, thereby specifically detecting this target. Consistent with the LC/MS data, analysis of the E. coli 35150 and E. coli 493/89 strains demonstrated that the cdt locus targeted by this PCR method was present only in the 493/89 strain. Furthermore, subsequent analysis of an 0104:H21 EHEC strain demonstrated that the 493/89 cdt allele was also not carried by this strain (Fig. 5). Since the LC/MS analysis indicated that the molecular mass of the CdtC protein observed in the 493/89 strain was smaller than that predicted from the genetic sequence, the PCR-derived amplicon was sequenced and compared with that sequence present in the GenBank submission. Interestingly, the sequence comparison demonstrated that the open reading frame present in 493/89 was identical to that in the GenBank submission.
FIGURE 5.
PCR detection of the cdtC gene. E. coli ATCC 35150, E. coli 493/89, and E. coli 3024-94 were each tested for the presence of the cdtC allele by PCR, as described in Materials and Methods. Reactions producing both the 628- and 562-bp amplicons were positive for the allele, while those producing only the 562-bp amplicon were considered negative. Lane 1, 1 Kb Plus MW standard (Invitrogen, Carlsbad, CA); Lane 2, E. coli ATCC 35150; Lane 3, E. coli 493/89, and Lane 4, E. coli 3024–94.
Cytolethal distending toxin (Cdt) encodes by a cluster of three adjacent genes (cdtA, cdtB, and cdtC). The respective roles of these proteins in bacterial pathogenesis have not been fully elucidated and the mechanism of Cdt entering into the cell and subsequently translocating into the nucleus, as well as the function of the individual subunits in this process have not been demonstrated. It is believed that CdtB is the enzymatically active subunit, which possesses DNase I-like activity, whereas CdtA and CdtC function as heteromeric subunits that mediate the delivery of CdtB into host cells.28,29 Consequently, the alteration in the molecular mass of CdtC may be a consequence of a posttranslational modification to the protein prior to association with the CdtA and CdtB proteins to form the holotoxin structure or could be a result of N-terminal cleavage during or after transport of the other toxin subunits. LC/MS/MS analysis could be used to determine the complete amino acid sequence of the CdtC subunit. However, knowledge of the complete and exact sequence of the protein is not necessary to design PCR primers to target the gene that encodes the protein biomarker, and thus, was not sought in this study. This protein does, however, illustrate the need for more information than mere molecular weight in order to identify the protein from the database. Even if the genome is completely sequenced and available to the public, in many cases the protein sequence is simply a translation of the open reading frame encoding the protein and has not been experimentally determined. The mass reported in the database does not take into account any posttranslational modifications, N-terminal sequence cleavages, or other modifications that would alter the molecular weight of the observed protein. Until such information is available, sequencing of the protein will be required in order to accurately confirm the identity of the protein.
The real power of this technique for detecting small differences in expressed proteins can be observed in the inset to Figure 4 which shows a very small mass shift of 40 Da between two native proteins each of which are individually separated from each other by 17 and 22 Da, respectively. Although the identity of these proteins cannot be determined from this information, it clearly provides more accurate information than 2D gels and the small differences would likely go unnoticed in the bottom-up approach.
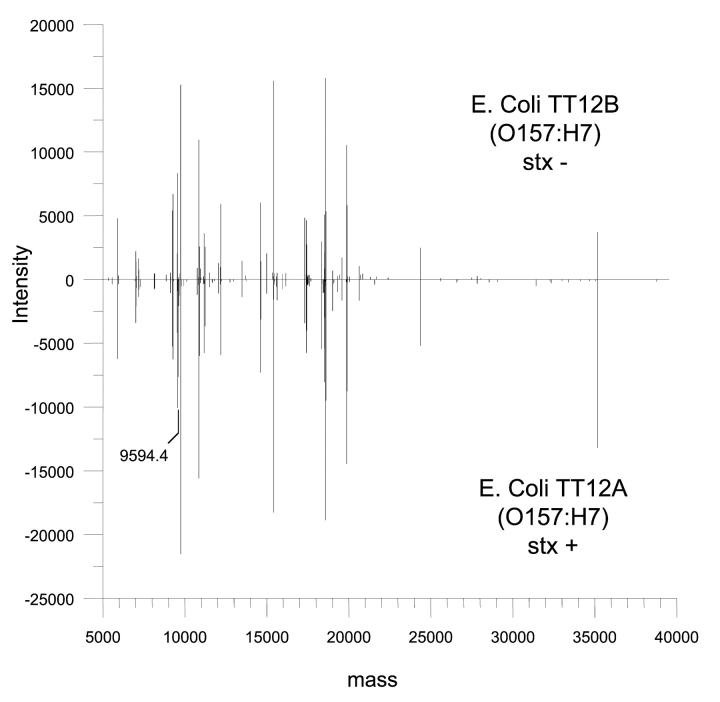
To further evaluate the capability of the top-down LC/MS method to detect fine differences in protein expression profiles, we examined an isogenic pair of 0157:H7 strains, which exhibited identical phenotypic, serologic, and genetic markers, except that one strain (TT12B) lost the genes encoding both Stx1 and Stx2.24 Consistent with the genetic data that these strains are closely related,25 the reflected protein expression profile for the two strains (Fig. 6) were nearly identical, except that TT12B showed the absence of a protein, which had a mass of 9594 Da. This protein was identified as the β subunit of Stx1 (BAC10990), which enables the toxin to bind to its receptors. Since the genetic analysis of these strains showed the absence of both Stx1 and Stx2 genes in strain TT12B,24 the apparent absence of differences with respect to Stx2 protein between these strains is likely due to either low abundance of the protein and/or the inefficient extraction of the protein from the bacterial cells. It should be noted that since the acetonitrile/water/formic acid solvent mixture used in these experiments extracts only the most soluble cytosolic proteins, it is possible that more protein differences would be observed if the cells were extracted by different methods. Therefore, a more complete protein profile would be generated if several different extraction methods were used on the same cell pellet, and the different protein profiles compiled into one comprehensive profile. Still, this example illustrates that in the analysis of very closely related strains, where few protein differences are expected, the top-down approach offers significant advantages over the bottom-up approach for identification of specific or unique biomarkers.
FIGURE 6.
The representative protein profiles of an isogenic pair of 0157:H7 strains. The two strains exhibit identical phenotypic, serologic, and genetic markers except that one strain (TT12B) lost the genes encoding both Stx1 and Stx2. The protein with a molecular mass of 9594.4 Da is the β subunit of Stx1.
In addition to looking for unique proteins, another advantage of the top-down approach is that it enables examination of differences in the levels of protein expression among strains. In a previous study,30 we used this technique to accurately measure differences in protein expression patterns in bacteria. In the analysis of the isogenic 0157:H7 strains, except for the absence of one protein in TT12B, the overall ratio of all the other proteins expressed by both strains were found to be nearly identical (Fig. 6). This is consistent with other findings that these strains are virtually identical, but also in agreement with our previous study30 that small differences in protein expression, which may be caused by up- or down-regulation of specific proteins, may easily be detected using the top-down approach. However, a protein that is differentially expressed is not a good choice for a biomarker to be used for molecular detection methods, such as PCR, since those methods simply detect the presence/absence of the open reading frame that encodes the protein.
To further emphasize the utility of the top-down versus the bottom-up approach for protein marker discovery, of the 150+ proteins observed in each strain analysis, more than 125 proteins are identical and of the remaining proteins, most probably differ only by small variations in their sequences. Thus, if each protein in the extract produced 10 detectable peptides upon enzymatic digestion, data from more than 1500 peptides would need to be sequenced and correctly identified in the database. Of the 1500 peptides identified, only a small percentage, perhaps less than 25, would be unique. If the unique peptides were identified, it would be very difficult to determine the whole protein from which they originated, since many strains of bacteria do not have sequenced genomes. Furthermore, an error rate of only 1% in the automated sequence identification would lead to the misidentification of 15 proteins and may result in incorrect conclusions as to the importance of these proteins. In fact, we find that the error rate is actually quite a bit higher and frequently requires validation of the data by hand. Until the search algorithms improve their accuracy, the bottom-up approach will be a more labor-intensive approach, subject to greater misinterpretation of the data.
In conclusion, we used the top-down LC/MS approach to examine shiga-toxigenic E. coli strains and demonstrated the advantages of this technique for discovery of new protein biomarkers. The method enabled the distinction of nearly identical strains based on their protein expression profiles and detected minor differences in protein expression levels among strains. Furthermore, the method effectively identified unique proteins in pathogenic EHEC strains that allowed the design of specific PCR primers to detect these markers or the strains that express these unique biomarkers.
REFERENCES
- 1.Nataro JP, Kaper, JB. Diarrheagenic Escherichia coli. Clin Microbiol Rev 199811(1):142–201. [DOI] [PMC free article] [PubMed] [Google Scholar]
- 2.Paton JC, Paton AW. Pathogenesis and diagnosis of Shiga toxin-producing Escherichia coli infections. Clin Microbiol Rev 199811(3):450–479. [DOI] [PMC free article] [PubMed] [Google Scholar]
- 3.Johnson RP, Clarke RC, Wilson JB, et al. Growing concern and recent outbreaks involving non-0157:H7 serotypes of verotoxigenic Escherichia coli. J Food Prot 199659:1112–1122. [DOI] [PubMed] [Google Scholar]
- 4.Monday SR, Whittam TS, Feng PC. Genetic and evolutionary analysis of mutations in the gusA gene that cause the absence of beta-glucuronidase activity in Escherichia coli 0157:H7. J Infect Dis 2001184(7): 918–921. [DOI] [PubMed] [Google Scholar]
- 5.Tominaga A, Mahmoud MA, Mukaihara T, Enomoto M. Molecular characterization of intact, but cryptic, flagellin genes in the genus Shigella. Mol Microbiol 199412(2):277–285. [DOI] [PubMed] [Google Scholar]
- 6.Monday SR, Minnich SA, Feng PC. A 12-base-pair deletion in the flagellar master control gene flhC causes nonmotility of the pathogenic German sorbitol-fermenting Escherichia coli 0157:H− strains. J Bacteriol 2004186(8):2319–2327. [DOI] [PMC free article] [PubMed] [Google Scholar]
- 7.Cordwell SJ, Nouwens AS, Walsh BJ. Comparative proteomics of bacterial pathogens. Proteomics 20011(4):461–472. [DOI] [PubMed] [Google Scholar]
- 8.Li C, Chen Z, Xiao Z, et al. Comparative proteomics analysis of human lung squamous carcinoma. Biochem Biophys Res Commun 2003309(1):253–260. [DOI] [PubMed] [Google Scholar]
- 9.Ge Y, El-Naggar M, Sze SK, et al. Top down characterization of secreted proteins from Mycobacterium tuberculosis by electron capture dissociation mass spectrometry. J Am Soc Mass Spectrom 200314(3):253–261. [DOI] [PubMed] [Google Scholar]
- 10.Ge Y, Lawhorn BG, ElNaggar M, et al. Top down characterization of larger proteins (45 kDa) by electron capture dissociation mass spectrometry. J Am Chem Soc 2002124(4):672–678. [DOI] [PubMed] [Google Scholar]
- 11.Kettman JR, Frey JR, Lefkovits I. Proteome, transcriptome and genome: Top down or bottom up analysis? Biomol Eng 200118(5):207–212. [DOI] [PubMed] [Google Scholar]
- 12.Hamler RL ZhuK, Buchanan NS, et al. A two-dimensional liquid-phase separation method coupled with mass spectrometry for proteomic studies of breast cancer and biomarker identification. Proteomics 20044(3):562–577. [DOI] [PubMed] [Google Scholar]
- 13.Wu CC, MacCoss MJ. Shotgun proteomics: Tools for the analysis of complex biological systems. Curr Opin Mol Ther 20024(3):242–250. [PubMed] [Google Scholar]
- 14.Bodnar WM, Blackburn RK, Krise JM, Moseley MA. Exploiting the complementary nature of LC/MALDI/MS/MS and LC/ESI/MS/MS for increased proteome coverage. J Am Soc Mass Spectrom 200314(9):971–979. [DOI] [PubMed]
- 15.McDonald WH, Yates JR, 3rd. Shotgun proteomics and biomarker discovery. Dis Markers 200218(2):99–105. [DOI] [PMC free article] [PubMed] [Google Scholar]
- 16.Griffin T J, Han DK, Gygi SP, et al. Toward a high-throughput approach to quantitative proteomic analysis: Expression-dependent protein identification by mass spectrometry. J Am Soc Mass Spectrom 200112(12):1238–1246. [DOI] [PubMed] [Google Scholar]
- 17.Gygi SP, Rist B, Gerber SA, Turecek F, Gelb MH. Aebersold, R. Quantitative analysis of complex protein mixtures using isotope-coded affinity tags. Nat Biotechnol 199917(10):994–999. [DOI] [PubMed] [Google Scholar]
- 18.Chakraborty A, Regnier FE. Global internal standard technology for comparative proteomics. J Chromatogr A 2002949(1–2):173–184. [DOI] [PubMed] [Google Scholar]
- 19.Ji J, Chakraborty A, Geng M, et al. Strategy for qualitative and quantitative analysis in proteomics based on signature peptides. J Chromatogr B Biomed Sci Appl 2000745(1):197–210. [DOI] [PubMed] [Google Scholar]
- 20.Regnier FE, Riggs L, Zhang R, et al. Comparative proteomics based on stable isotope labeling and affinity selection. J Mass Spectrom 200237(2):133–145. [DOI] [PubMed] [Google Scholar]
- 21.Williams TL, Leopold P, Musser S. Automated postprocessing of electrospray LC/MS data for profiling protein expression in bacteria. Anal Chem 200274(22):5807–5813. [DOI] [PubMed] [Google Scholar]
- 22.Williams TL, Musser SM, Nordstrom JL, DePaola A, Monday SR. Identification of a protein biomarker unique to the pandemic 03:K6 clone of Vibrio parahaemolyticus. J Clin Microbiol 200442(4):1657–1665. [DOI] [PMC free article] [PubMed] [Google Scholar]
- 23.Karch H, Bielaszewska M. Sorbitol-fermenting Shiga toxin-producing Escherichia coli 0157:H(−) strains: Epidemiology, phenotypic and molecular characteristics, and microbiological diagnosis. J Clin Microbiol 200139(6):2043–2049. [DOI] [PMC free article] [PubMed] [Google Scholar]
- 24.Feng P, Dey M, Abe A, Takeda T. Isogenic strain of Escherichia coli 0157:H7 that has lost both Shiga toxin 1 and 2 genes. Clin Diagn Lab Immunol 20018(4): 711–717. [DOI] [PMC free article] [PubMed] [Google Scholar]
- 25.Feng P, Weagant SD, Monday SR. Genetic analysis for virulence factors in Escherichia coli 0104:H21 that was implicated in an outbreak of hemorrhagic colitis. J Clin Microbiol 200139(1):24–28. [DOI] [PMC free article] [PubMed] [Google Scholar]
- 26.Feng P, Monday SR. Multiplex PCR for detection of trait and virulence factors in enterohemorrhagic Escherichia coli serotypes. Mol Cell Probes 200014(6):333–337. [DOI] [PubMed] [Google Scholar]
- 27.Feng P, Lampel KA, Karch H, Whittam TS. Genotypic and phenotypic changes in the emergence of Escherichia coli 0157:H7. J Infect Dis 1998177(6):1750–1753. [DOI] [PubMed] [Google Scholar]
- 28.Nesic D, Hsu Y, Stebbins CE. Assembly and function of a bacterial genotoxin. Nature 2004429(6990):429–433. [DOI] [PubMed] [Google Scholar]
- 29.Haghjoo E, Galan JE. Salmonella typhi encodes a functional cytolethal distending toxin that is delivered into host cells by a bacterial-internalization pathway. Proc Natl Acad Sci U S A 2004101(13):4614–4619. [DOI] [PMC free article] [PubMed] [Google Scholar]
- 30.Williams TL, Callahan JH, Monday SR, Feng PC, Musser SM. Relative quantitation of intact proteins of bacterial cell extracts using coextracted proteins as internal standards. Anal Chem 200476(4):1002–1007. [DOI] [PubMed] [Google Scholar]


