

Abstract
Interleukin-10 (IL10), an anti-inflammatory cytokine, has been implicated in a variety of immune- and inflammatory-related diseases. We investigated the following SNPs: −1082, −819, −592 in the promoter region of IL10 in a normal (control) population and selected diseases: breast cancer (BrCa), systemic lupus erythematosus (SLE), and B-cell chronic lymphocytic leukemia (B-CLL) by denaturing high-performance liquid chromatography (DHPLC) and found distinct genotype and haplotype patterns. DHPLC was performed using the Transgenomic WAVE instrument, a mutational discovery tool that allows for high throughout analysis of SNPs. The principle of DHPLC is based on separation of homo- and heteroduplex formation of individual polymerase chain reaction products at specific melting temperatures and set gradients. The melting temperature selected for each SNP was based on size and sequence of the polymerase chain reaction product (for −1082, 57°C; for −819, 58°C; and for −592, 59.2°C). Before fragment mutational analysis, all samples were denatured at 95°C and slowly reannealed to allow for reassociation of different strands. Heteroduplex samples were easily distinguished from homoduplex samples. In order to identify wild type from homozygous mutant, two homoduplex polymerase chain reaction samples had to be mixed together, denatured at 95°C and reannealed. The homozygous mutant, when combined with wild type, displayed a double peak on chromatogram. Once distinct chromatograms were established for each of the SNPs and the nucleotide changes confirmed by sequencing, genotype and haplotype frequencies were tabulated for the groups studied.
Keywords: Single nucleotide polymorphisms, promoter region of interleukin-10, denaturing high-performance liquid chromatography, systemic erythematosus lupus, breast cancer, β-cell chronic lymphocytic leukemia
Interleukin-10 (IL10) is an important immunoregulatory cytokine with pleiotrophic effects.1,2 The IL10 gene is located on chromosome 1, and its receptor is located on chromosome 11.3,4 The biological significance of IL10 is extensive and diverse because of its role in many diseases. IL10 is known to play a substantial role in inflammation and immune processes.5,6 In particular, IL10 has been reported to inhibit the production of proinflammatory cytokines tumor necrosis factor alpha (TNFα), interleukin 1α and β (IL1α and β), interleukin IL6 (IL6), and interleukin 8 (IL8), while stimulating B-cell proliferation, differentiation, and production.7–9 In addition, IL10 downregulates interferon gamma (IFNγ) and TNF by T helper type 1 (TH1) cells. As a result, IL10 enhances activation and chemotaxis of T cells.10,11
The varied role of IL10 in discrete diseases has been well documented.5,6 While it has been shown to have a beneficial effect in some diseases (i.e., rheumatoid arthritis), IL10 has been found to have a deleterious action in other diseases such as systemic lupus erythematosus (SLE) and systemic sclerosis.12–14 In addition, recent studies report an association of IL10 cytokine expression with breast cancer (BrCa) and B-cell chronic lymphocytic leukemia (B-CLL). In the case of BrCa, IL10 appears to have the paradoxical effects of tumor proliferation and suppression.15 With in vitro studies on B-CLL, IL10 was reported to affect proliferation of leukemic B cells by inhibiting cell cycle progression.16
Genotypic variations in the human IL10 promoter may account for individual variation in IL10 production and, in turn, susceptibility to a particular disease.17–19 Numerous studies have described genetic polymorphisms in the promoter region of the IL10 gene and their association with either increased or decreased production of IL10.20–23 Based on a recent report showing association of different haplotypes with high and low IL10 producers,24 we have elected to study the proximal SNPs (−1082, −819, −592) in the following diseases: SLE, BrCa, and B-CLL.
MATERIALS AND METHODS
Genomic DNA
Genomic DNA was isolated from blood lymphocytes of normal volunteers (as controls) and from BrCa, SLE, and B-CLL patients using either Puregene DNA Isolation Kit (Gentra Systems, Minneapolis, MN) or QIAamp DNA Mini Kit (Qiagen, Valencia, CA) following manufacturers’ instructions. The extracted DNA was quantitated by spectrophotometer and analyzed by agarose gel electrophoresis containing ethidium bromide and visualized by UV illumination using Gel Doc (gel documentation system, Bio Rad, Hercules, CA).
Patient Population
All patient samples included in this study were obtained with Institutional Review Board approval. The sample numbers differed in each group. The control population included a total of 25 DNA samples from in-house volunteers. We analyzed DNA samples from 50 BrCa and 51 SLE patients. Our sample size for B-CLL was small, comprised less than 20 patients for examination of genotypic variation in specific promoter regions of IL10.
Single Nucleotide Polymorphisms
Polymorphisms in the promoter region of IL10 were identified using the National Center for Biotechnology Information (NCBI) SNP database.25 The particular IL10 SNPs included in this study were as follows: SNP change G/A for −1082, NCBI SNP cluster ID rs1800896; SNP change C/T for −819, NCBI SNP cluster ID rs1800871; SNP change C/A for −592, NCBI SNP cluster ID rs1800872.
Polymerase Chain Reaction Primers
The following primer sequences were used to generate DNA products within the IL10 promoter containing the specific SNPs:
SNP −1082
Forward primer: 5′CAAGACAACACTACTAAGGC
Reverse Primer: 5′ATTGGCCTTAGAGTTTCTTTTAG.
SNP −819
Forward Primer: 5′TCATTCTATGTGCTGGAGATG
Reverse Primer: 5′GAAGTGGGTAAGAGTAGTCTG
SNP −592
Forward Primer: 5′GACTACTCTTACCCACTTCC
Reverse Primer: 5′GGATTGAGAAATAATTGGGTCC.
Polymerase Chain Reaction Amplifications
Polymerase chain reaction (PCR) amplifications were done using the Gene Amp PCR core reagent kit (Applied Biosystems, Foster City, CA). The final concentrations of the PCR reagents were 1X PCR buffer, 2.5 mM MgCl2, 200 μM of each dNTP, 400 nM each forward and reverse primer, 1.25 U of AmpliTaq DNA polymerase enzyme, and 100–150 ng of genomic DNA in a 100-μL reaction volume.
Thermal Cycler Conditions
Thermal cycler conditions were as follows: 94°C for 10 min, 35 cycles of 94°C for 15 sec, 60°C for 15 sec, 72°C for 1 min, and a final extension at 72°C for 7 min. Ethidium bromide containing agarose (1.2%) gels were electrophoresed at 80V and the DNA visualized by UV illumination to confirm PCR product size.
Analysis by Denaturing High-Performance Liquid Chromatography
Denaturing high-performance liquid chromatography (DHPLC) was performed using the Transgenomic WAVE instrument, which is based on ion-paired reversed phase HPLC.26,27 Transgenomic Wave technology employs proprietary DNASep cartridge with C18 alkylated polystyrene/divinylbenzene copolymer beads. This polymer constitution renders the cartridge pH and temperature stable with very exact and reproducible retention times.
The Wavemaker 4.1 software used with the control (or reference) fragment sequence predicts analytical parameters with a high accuracy for optimal partial denaturing temperatures essential for fragment separation and mutational analysis as well as for generation of distinct and characteristic fingerprints (Transgenomic, AN112). Once the chromatographic fingerprints are established for the wild type product or control samples, the PCR products for each polymorphism are then analyzed under partially denaturing temperatures to detect mutations (SNPs). Separation of DNA molecules containing specific mutations or SNPs is largely dependent on the temperature and gradient selected for each PCR sequence (predicted using Wavemaker 4.1 software). The melting temperatures selected for optimal separation of amplified DNA products were as follows: −1082, 57°C; −819, 58°C; −592, 59.2°C.
Confirmation of Polymorphisms
We selected PCR products showing evidence of mutations by DHPLC and then analyzed them by automated fluorescent sequencing using Big Dye Terminator Kit and ABI 3100 sequencer (Applied Biosystems) to verify both nucleotide sequence and presence of specific SNPs (for −1082, G/A; for −819, C/T; and for −592, C/A).
Quantitative Real-Time PCR
IL10 mRNA expression levels were determined in 42 BrCa samples by quantitative real time PCR (QRT-PCR). We used TaqMan chemistry and one-step QRT-PCR for the quantitation of IL10 mRNA. Total RNA was extracted from peripheral blood lymphocytes using High Pure RNA isolation kit (Roche, Indianapolis, IN) according to manufacturer’s instructions. The extracted RNAs were DNase treated using RNase-free DNase I (Roche) and the RNA concentrations were determined by measuring the absorbance at 260 and 280 (A260/280) with UV/VIS spectrophotometer. QRT-PCR was performed using Eurogentec RT qPCR Master Mix (San Diego, CA) and ABI Prism 7700 Sequence Detection System, SDS (Applied Biosystems). IL10 TaqMan primers and probe were purchased as Pre-Developed Assay Reagent from Applied Biosystems. Beta-actin was used as endogenous control gene. TaqMan primers and probes for β-actin were designed and synthesized at the Core facility of our Research Institute. Fifty nanograms of total RNA was used per reaction. Results were analyzed by the SDS software v1.9.1 and obtained as Ct (threshold cycle) values. The difference in Ct values between IL10 and β-actin (ΔCt − ΔCt) was converted to relative mRNA expression units by setting β-actin to 105 and dividing by 2ΔCt.
RESULTS
Generating IL10 Promoter PCR Products
Three biologically important SNPs (−1082, −819, −592) located in the promoter region of the IL10 gene were studied in a normal control population and in three disease states: BrCa, SLE, and B-CLL. Using primers specific to promoter regions encompassing identified SNP, we generated PCR products for each of the three polymorphic sites. Amplified DNA products containing the specific IL10 promoter SNPs were electrophoresed through ethidium bromide containing 1.2% agarose gels, and visualized by UV illumination to determine concentration, purity, and size of each PCR product. The size of the IL10 promoter PCR products were as follows: for −1082, 192 bp; for −819, 204 bp; and for −592, 319 bp (Fig. 1). PCR products had to be larger than 150 bp but less than 700 bp to be analyzed by DHPLC.
FIGURE 1.

Gel analysis of PCR containing IL10 SNPs from all groups: normal (lanes 2, 5, 9); BrCa (lanes 3, 6, 10); SLE (lanes 4, 7, 11), and B-CLL (lanes 5, 8, 12). Lane 1 shows 1-kb ladder and lane 14 shows H20 blank.
Analysis of PCR Samples by DHPLC
Specific melting temperatures for each fragment were selected with Wavemaker 4.1 software to allow for partial denaturation of the DNA molecules measured as a 50% decrease in DNA helicity, and this in turn resulted in adequate separation of homozygous from heterozygous double-stranded DNA products (Fig. 2). Single base-paired mismatches (or SNPs) present within DNA fragments produced different mobilities shown by altered (or shorter) retention times on chromatograms.
FIGURE 2.

Temperature melting profiles selected for partial denaturation of PCR product (DNA duplex) and subsequent detection of IL10 SNPs −1082(GA), −819(CT), −592(CA) by chromatographic analysis were as follows: (a) −1082, 57°C; (b) −819, 58°C; (c) −592, 59.2°C.
We established distinct chromatographic patterns for each of the IL10 promoter SNPs analyzed by DHPLC. Figure 3a–c shows representative chromatographic patterns obtained for homozygous controls, heterozygous mutants, and homozygous mutants with each SNP studied (−1082, −819, −592). In each case, homozygous DNA samples eluted as single peaks (or homoduplexes) while heterozygous PCR products appeared as double peaks (or heteroduplexes). Although homozygous mutants could be seen to elute slightly earlier compared with homozygous controls, this was insufficient to make a determination for the presence of SNPs. Therefore, samples from chromatograms showing homoduplex peaks needed to be paired together, redenatured at 95°C and slowly reannealed. The results from combining DNA homoduplex peaks are shown in Figure 4a–c.
FIGURE 3.
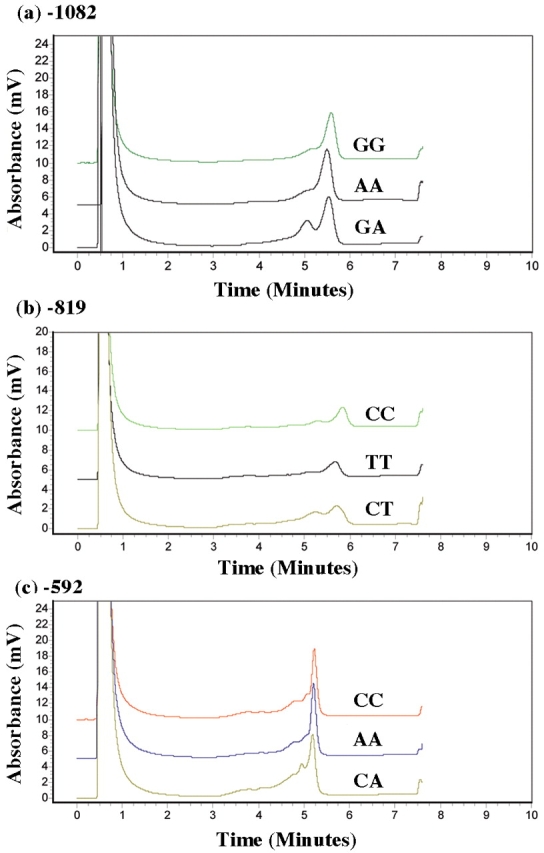
Chromatographic WAVE pattern and detection of mutations by DHPLC for the individual IL10 PCR products were as follows: (a) −1082, GG,AA,GA; (b) −819, CC,TT,CT; (c) −592, CC,AA,CA.
FIGURE 4.
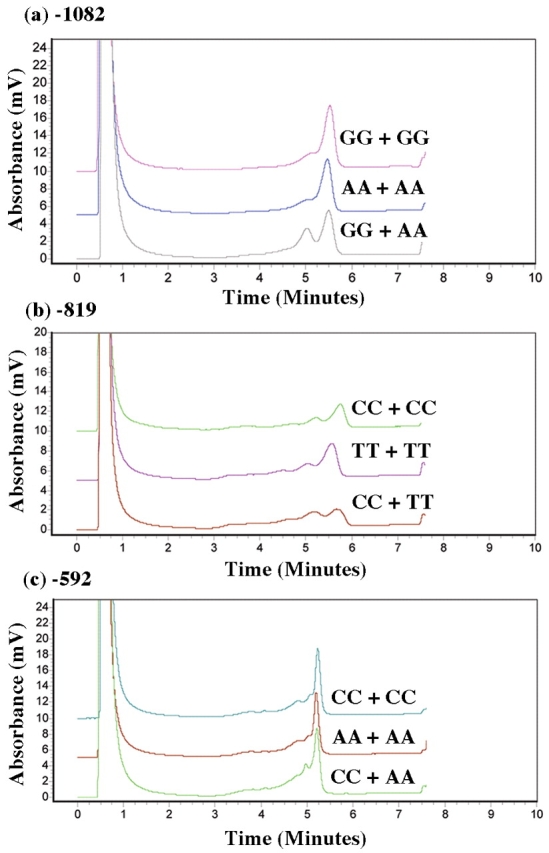
Chromaotgraphic WAVE pattern and detection of mutations by DHPLC for the combined IL10 PCR products were as follows: (a) −1082, GG+GG, AA+AA, GG+AA; (b) −819, CC+CC, TT+TT, CC+TT; (c) −592, CC+CC, AA+AA, CC+AA.
When two identical samples were combined (both homozygous wild type or both homozygous mutant), the presence of a single peak (or homoduplex) was displayed on the chromatogram. If the two samples combined were different, i.e., homozygous mutant + homozygous wild type, the DNA fragments would elute at different mobilities and appear as two peaks (or heteroduplex). The latter would indicate the presence of SNP (or nucleotide change) in one of the combined samples. This effect was noted across chromatograms from all three IL10 promoter SNPs analyzed. Chromatographic fingerprints for each IL10 promoter polymorphism, −1082, −819, and −592, obtained by DHPLC analysis for wild type, heterozygous, and homozygous mutant were subsequently confirmed by sequencing.
Confirmation of PCR Fragment SNPs
DHPLC chromatographic analyses demonstrating the presence of single nucleotide changes within an IL10 promoter PCR fragment were consistent and easily interpreted. Confirmation of SNP detection in a given sample was determined by automated fluorescence sequence analysis using an ABI 3100 instrument. Figures 5–7 are representative sequence chromatograms of IL10 promoter PCR products, −1082, −819, −592, showing the different nucleotide changes. Sequence results were confirmed in both directions. Based on chromatographic patterns noted on DHPLC and confirmed by genetic sequencing, IL10 genotype and haplotype frequencies were then determined for each group: controls, BrCa, SLE, and B-CLL (Tables 1 and 2).
FIGURE 5.

Partial sequence analysis of 192 bp PCR product for −1082 showing normal (GG), heterozygous (GA), and mutant (AA) nucleotide changes.
FIGURE 6.

Partial sequence analysis of 204 bp PCR product for −819 showing normal (CC), heterozygous (CT), and mutant (TT) nucleotide changes.
FIGURE 7.

Partial sequence analysis of 319 bp PCR product for −592 showing normal (CC), heterozygous (CA), and mutant (AA) nucleotide changes.
TABLE 1.
Genotypes of Individual Single-Nucleotide Polymorphisms
| −1082 (%) | −819 (%) | −592 (%) | |||||||
| Group | GG | GA | AA | CC | CT | TT | CC | CA | AA |
| Controls (n=25) | 16 | 47 | 37 | 58.5 | 39 | 2.5 | 50 | 42 | 8 |
| BrCa (n=50) | 24 | 56 | 20 | 56 | 38 | 6 | 60 | 34 | 6 |
| SLE (n=51) | 14 | 7 | 49 | 35 | 47 | 18 | 41 | 41 | 18 |
| BCLL (n=17) | 23.5 | 53 | 23.5 | 53 | 35 | 12 | 60 | 30 | 20 |
Each number indicates percentage of total samples in each group (controls, BrCa, SLE, and BCLL) that have the specific allele composition for IL10 promoter polymorphisms −1082, −819, and −592.
TABLE 2.
Genotype and Haplotype Frequency
| Controls (%) (n=25) | BrCa (%) (n=44) | SLE (%) (n=48) | BCLL (%) (n=16) | |
| Genotype | ||||
| GCC/GCC | 12 | 23 | 8 | 19 |
| GCC/ACC | 40 | 32 | 14.5 | 31 |
| GCC/ATA | 8 | 30 | 25 | 25 |
| ACC/ACC | 4 | 4 | 14.5 | 6 |
| ACC/ATA | 24 | 7 | 19 | 6 |
| ATA/ATA | 12 | 4 | 19 | 13 |
| Haplotype | ||||
| GCC | 36 | 53 | 28 | 47 |
| ACC | 36 | 24 | 31 | 25 |
| ATA | 28 | 23 | 41 | 28 |
Frequency is measured as a percentage of the total number of samples in each group that show a particular genotype and haplotype.
Frequency and Homozygosity or Heterozygosity of Three SNPs Within IL10 Promoter Region
Table 1 shows the percentages and genotypes of the individual SNPs (for −1082, GG,GA,AA; for −819, CC,CT,TT; and for −592, CC,CA,AA). In IL10 promoter PCR fragments containing an SNP at −1082, an increase in GA genotype was noted in PCR products from the BrCa and B-CLL groups (56% and 53%, respectively) relative to control samples (47%), while an increase in AA genotype was found in PCR samples from the SLE group (49%). In the analysis of IL10 promoter SNP at −819, a notable increase in CT and TT genotypes was found for the SLE group (47% and 18%), whereas the respective BrCa and B-CLL PCR samples showed an increase in TT genotype at a slightly lower level (6% and 12%) compared with SLE samples. For polymorphisms at −592 in the IL10 promoter, an increase in CC genotype was identified in PCR products from both BrCa and B-CLL groups (60% and 60%, respectively), while an increase in AA genotype was found in SLE and B-CLL groups (18% and 20%, respectively).
Genotype and Haplotype Frequencies for IL10 Promoter SNPs
Table 2 shows distinct genotype and haplotype frequencies determined for the various groups studied. A notable increase in GCC haplotype was detected for BrCa and B-CLL groups (53% and 47%, respectively) compared with controls (36%). In contrast, an increase in ATA haplotypes was found in PCR products from the SLE group (41%). The haplotype percentages obtained for our control group (GCC, 36%; ACC, 36%; ATA, 28%) were in agreement with those reported by others.24
Quantitation of IL10 mRNA Levels in BrCa Samples
IL10 mRNA expression was analyzed in the unstimulated peripheral blood mononuclear cells of 42 breast cancer patients. We found a large interindividual variation in the levels of mRNA expression (Fig. 8a). The ranges of expression units were as follows: 4.74–73.5 with a median of 14.7 and a mean of 27 for GCC/GCC; 2.89–349 with a median of 29.7 and a mean of 72 for GCC/ACC; 0.03–870 with a median of 17 and a mean of 122 for GCC/ATA. Although the differences between the genotypes were not statistically significant, a trend toward increase in the mean mRNA expression levels in patients with GCC/ATA genotype was observed (Fig. 8b). When the data were analyzed for individual genotypes, all samples with heterozygous genotypes (GA for −1082, CT for −819, and CA for −592) showed higher mRNA expression compared with their respective wild type genotypes (Fig. 8c).
FIGURE 8.
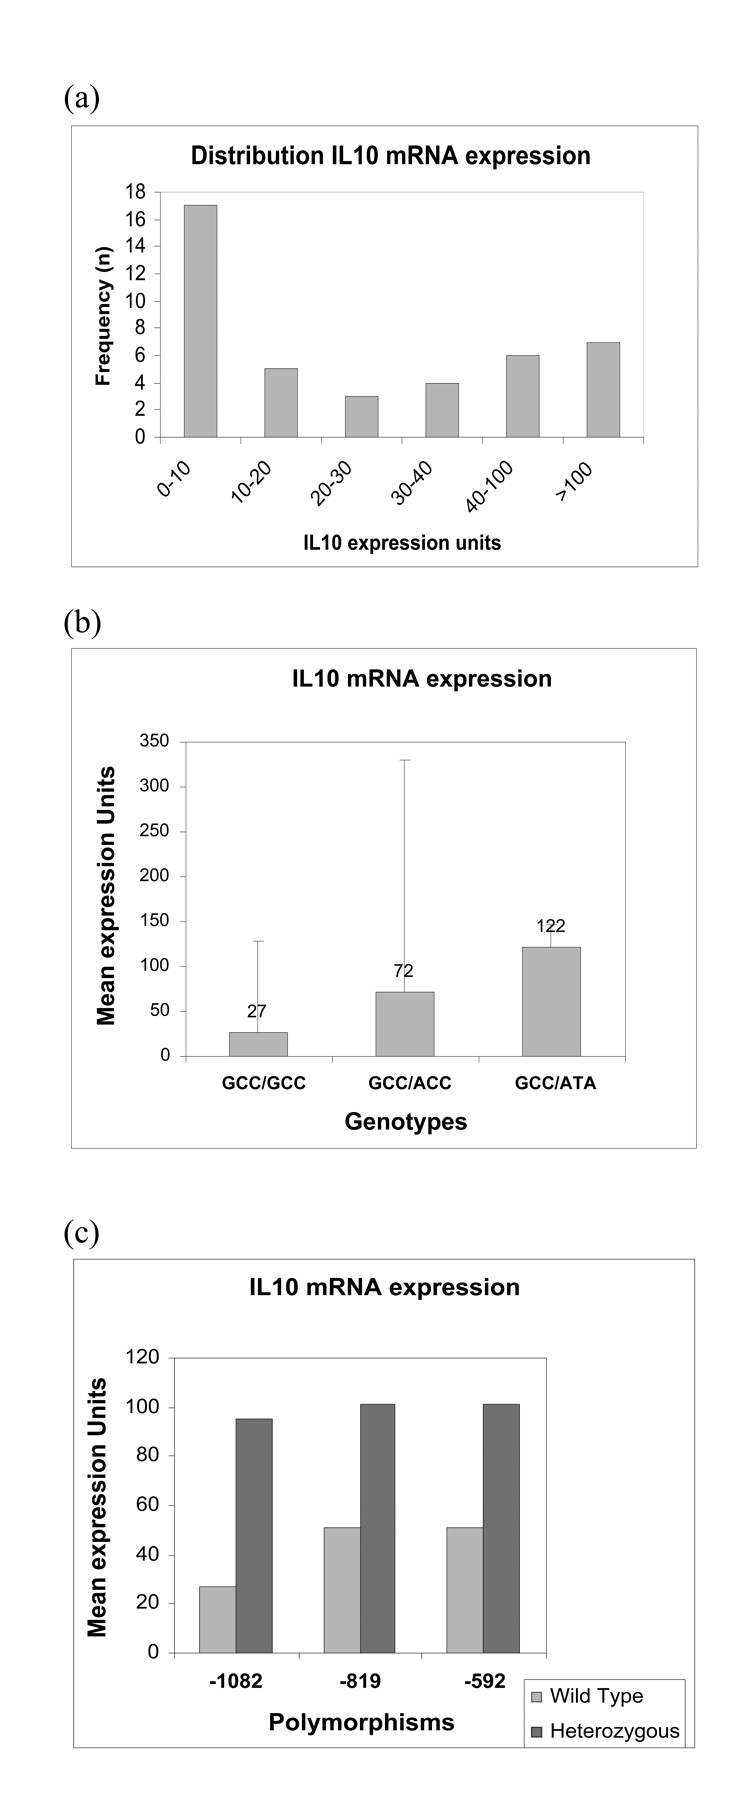
Expression of IL10 mRNA in BrCa samples. IL10 mRNA expression was measured by TaqMan quantitative real time PCR using total RNA from 42 BrCa patients. B-actin was used as endogenous control gene. The difference in Ct values between IL10 and B-actin (ΔCt–ΔCt) was converted to relative mRNA expression units by setting B-actin to 105 and dividing by 2ΔCt. (a) Number of patients vs IL10 mRNA expression levels. A wide distribution is noted among the 42 breast cancer samples tested. Majority of patients (17/42) had mRNA expression units of 0–10. (b) Mean mRNA expression units vs genotypes. mRNA expression levels were higher in the GCC/ATA genotype compared with the GCC/GCC and GCC/ACC genotypes. (c) Mean IL10 mRNA expression units vs the individual polymorphisms. mRNA expression units were higher in the samples with heterozygous mutation compared with the homozygous wild type for all the three SNPs.
DISCUSSION
We employed the powerful tool of DHPLC to identify and detect SNPs in the promoter region of an important immunoregulatory molecule, IL10. The SNPs −1082, −819, and −592 that we studied are considered to be in the proximal end of the IL10 promoter, upstream of the transcription start site.20 Each SNP has been shown to be associated with important functional sites: −1082 with ETS transcription binding site, −819 with the estrogen receptor element, and −592 with negative regulatory sites.17,18,28 These same SNPs have been studied by a number of scientists investigating the relationship between IL10 secretion and susceptibility to diseases.17,20,22,24 Many autoimmune and inflammatory diseases are coupled to increased or decreased production of IL10.5,6 However, the genetic basis for variations in IL10 protein expression among individuals is unclear. Recently, two microsatellites polymorphisms, IL10R and IL10G, and seven additional SNPs located distally 2–4 kb from the IL10 transcription site are of increasing interest in associating genetic variations in susceptibility to autoimmune diseases like SLE.21,29 We have not addressed these variants in our studies, herein.
In early studies examining proximal IL10 SNPs −1082, −819, and −592, an association was noted between a prevalence of distinct alleles, G,C,C, and manifestations of certain SLE clinical features (namely, Ro autoantibodies and renal involvement).13,17 This led to further studies which showed a correlation between individual SNP haplotypes and IL10 production.18,20,24 Specifically, the GCC haplotype was found to be associated with high IL10 producers while the ATA haplotype was detected in low IL10 secretors. Therefore, a correlation between haplotype and IL10 secretion and a particular disease condition may exist.
In a recent study by Suarez et al., IL10 genotype and haplotype frequencies were determined in a healthy Spanish population and the G allele of −1082 was found to be the most important factor in regulation of IL10 mRNA levels.24 In their study, high frequency of A allele correlated with low mRNA levels and low IL10 production. The frequency data from the Suarez group is in agreement with our SNP genotype and haplotype findings in normal controls. Many factors may play a role in determining the relevance of a particular allele or genotype with a disease.29,30 For example, in one study dealing with a Northern European population, an increase in ATA haplotype correlated with neuropsychiatric features in SLE.31 In another study with Chinese patients, the ATA haplotype was strongly associated with lupus nephritis.32 Thus, ethnicity plays a vital role in determining possible relevance of cytokine gene polymorphism.33
In our study, the SLE patients also showed a significant increase in AA genotype (18%) compared with controls (8%) and, in turn, an increased frequency of the ATA haplotype (41%). Although we were unable to measure IL10 levels in our SLE patient population, the ATA haplotype is reported to be associated with low IL10 production.18,23 The difference in haplotype frequency in our SLE group from early groups studying SLE may be due to the subpopulation of patients studied and the severity of their disease.
Our SLE group was a mixed population consisting of 71% White, 25% Black, and 4% Oriental. They varied in activity of their disease as well as distinct clinical and physical manifestations. However, to be part of the SLE group, they satisfied at least 4 out of 11 criteria for presence of the disease.34 When our SLE group was divided according to race—White, Black, Oriental—there was still an increase in ATA haplotype noted among all the ethnic subgroups; however, it was much higher in the Black and Oriental subpopulation than the White subgroup (data not shown).
In some of the early studies on SLE where certain alleles—G,C,C of IL10 SNPs (−1082, −819, −592) — were noted to be associated with distinct features of SLE, the patient population was basically White and of British descent.17,20 Most studies dealing with a variety of ethnic groups (British, Dutch, Mexican, Chinese) showed an increase in ATA haplotype or other markers—IL10. G microsatellite in SLE patients—relative to controls, which was sometimes hard to correlate with severity or specific SLE features.31,32,35,36 One British study however reported no difference in genotype distribution between their SLE patients and controls; they found no association between the three proximal SNP haplotypes (GCC,ACC,ATA) and renal disease or anti-Ro antibodies.37 The fact that low IL10 production is associated with ATA haplotype18 but SLE patients do show high IL10 levels in their serum38 makes ascribing a single genetic component to this disease very unlikely. Multiple factors (or interplay between genetic and environmental factors) are most likely responsible for the occurrence of SLE disease.19,39,40,41
Contrary to our SLE haplotype findings, the BrCa samples showed a significant increase (56%) in GA genotype and (53%) in GCC haplotype prevalence. However, there was no clear correlation between the presence or absence of estrogen or progesterone receptors and the allele or genotype frequencies we determined from our DHPLC and sequencing chromatographic results. With Her-2/neu receptors, however, there was a tendency toward GCC haplotype in patients positive for this receptor (data not shown). Her-2 receptors are known to be amplified and overexpressed in 20–40% of all breast cancers; in fact, overexpression of Her-2/neu receptors has been reported to enhance malignancy.42,43 In our BrCa patients, subtyping of the disease was as follows: lobular (L) or ductal (D) + in situ (IS) or invasive (IC). The patients showing Her-2/neu receptors were diagnosed as ductal carcinoma in situ (DCIS) plus or minus ductal invasive carcinoma (DIC). A deficiency in IFN production has been reported in BrCa patients with advanced disease43; this could be the result of overexpression of IL10 signified by a GCC haplotype preference. Our BrCa DNA samples came from patients with different subtypes (L or D + IS or IC) and different stages (I–IV) of BrCa disease. Therefore, an increase in IL10 expression in a particular subgroup of BrCa patients cannot be correlated with the GCC haplotype in our study.
In our study we found higher IL10 mRNA expression in patients with heterozygous alleles for all the three SNPs (GA for −1082, CT for −819, and CA for −592). Results from other labs indicate the constitutive mRNA expression in peripheral blood mononuclear cells was higher in normal subjects with GCC haplotype and lower with ATA haplotype, and the results were found to be similar when the peripheral blood mononuclear cells were stimulated with lipopolysaccharides or mitogens.24 On the contrary, in a recent study, stimulation of peripheral blood mononuclear cells of individuals homozygous for all three SNPs with Streptococcus pneumoniae showed that peripheral blood mononuclear cells with ATA haplotype had higher IL10 mRNA levels than the GCC haplotype.44 Our BrCa study group includes a heterogeneous population who may have different levels of T-cell stimulation in vivo. Relatively few studies have analyzed the IL10 mRNA expression in BrCa patients. Elevated serum IL10 levels are strongly associated with BrCa and correlate with clinical stage of disease.45 Breast tumors produce higher levels of IL10 than normal breast tissue.46 IL10 mRNA expression is seen in breast tumor cells where tumor infiltrating lymphocytes were found to have reduced cytotoxic function.47 Although the correlation between tumor cell mRNA expression and that of peripheral blood mononuclear cells is not known, these studies suggest that IL10 levels are strongly associated with the prognosis of BrCa. It has been shown that the −1082 AA genotype is correlated with a marked increase in BrCa risk.15 In our study, mRNA expression results were available for only a few patients who had homozygous mutations. As we find the heterozygotes (GA, CT, CA) to have higher mRNA expression, it is interesting to pursue further studies to analyze the association between the different genotypes with clinical stages of this disease and IL10 mRNA as well as protein levels in a larger group of patients.
In our B-CLL group consisting of 17 patients, an increase in GCC haplotype was found among the samples. The IL10 production measured in 21 other B-CLL patients (not included in this study) showed predominantly a decreased amount of the cytokine present in serum (3–8 pg/mL) similar to controls; only 4 out of 21 B-CLL patients tested showed greater than 8 pg/mL values (personal communication, D. Messmer). Previous studies examining cytokine levels and B-CLL have reported significant increases in levels of secretion of TNFα and IL4 but low levels of IL10.48 IL10 has also been shown to have an inhibitory effect on proliferation of leukemic CD5 + B cells, distinct from induction of apoptosis.16,49 For the most part, IL10 is thought to inhibit apoptosis induction through maintenance of sustainable cell cycle progression in malignant cells.50 In one early study, measurement of IL10 mRNA in B-CLL patients has shown an increase in IL10 expression to be associated with nonprogressive disease.51 Based on increased percentage of mutations observed in VH region of immunoglobulin and increased CD38 expression,52 the B-CLL patients were grouped as having either progressive or nonprogressive disease. There appeared to be no definitive correlation between genotype findings and disease progression. However, the number of B-CLL patients’ samples studied was too small to draw any conclusions. It is clear that more work needs to be done on association of genetic variability with B-CLL disease progression.
Many factors play a role in assessing the relative importance of genetic variations in the IL10 promoter region and occurrence of a particular disease.29,30,33,39,40 These include ethnic origin, sex, and age of group studied, as well as age of onset of disease, clinical features, and severity of disease. In general, genetic variation in individuals is said to account for 75% of the changes in IL10 production and/or susceptibility to disease, and individual environment for the remaining 25%.19,41
We have found DHPLC to be an invaluable screening tool for detecting SNP mutations in the promoter of an integral immunoregulatory molecule, IL10. DHPLC has significant advantages over other genetic polymorphism detection methods such as single-strand conformation polymorphism (SSCP), direct sequencing, and DNA chip hybridization for the following reasons.
SSCP is a mutational analysis method that entails PCR amplification followed by restriction enzyme digestion, gel electrophoresis and detection by sequence specific oligo probes (radioactive or biotinylated).53 It is time consuming, costly, and only 80–90% efficient in detecting SNPs.
Direct sequencing of all PCR products can be costly and sometimes difficult to read. Analysis of PCR products by direct sequencing sometimes requires purification of material prior to running samples on instrument; in addition, difficult sequences may require TA-based subcloning of PCR products prior to sequence analysis.54
DNA chip hybridization is an expensive and time-consuming technique for detecting unknown and known mutations.55 It requires 250–500 ng of genomic DNA for whole genome amplification. The molecular biology is labor intensive and requires 2–3 days for the application. Though the output lists over 10,000 SNPs, analysis and interpretation of the data are arduous.56,57 To date, the DNA chips available appear to allow only for gene linkage or association, and not identification of specific polymorphisms in individual candidate genes.
DHPLC is the method of choice for SNP mutational analysis. It has greater sensitivity at detecting mutations (> 95%), requires minimal optimization of instrument settings for each SNP studied, allows high throughput analysis of samples and findings are consistent and reproducible.26,58,59,60 Furthermore, no purification of PCR products is needed prior to analysis on instrument.
To reiterate, DHPLC-SNP screening is based on separation of thermodynamically altered DNA molecules at predicted melting temperatures and set gradients that may or may not contain single base pair mismatches.27 The chromatogram patterns obtained in our study were characteristic, easily interpreted for genotype, and reproducible for each SNP studied (−1082, −819, −592). Analysis of chromatograms obtained with DHPLC proves to be a reliable way of determining IL10 promoter genotype and haplotype frequency in all groups studied: normal controls, BrCa, SLE, and B-CLL samples.
Though the frequency and distribution of genotypes are distinctly different among the various groups, these SNP findings are not enough to correlate with onset or severity of a particular disease. As reported by others, there are numerous cytokines as well as other IL10 promoter SNPs and microsatellites that may be involved in disease onset and progression.21,29,61,62 In fact, many factors (both genetic and environmental) may come into play with regard to the actual appearance of a disease.19,39,41 We intend to look at other relevant SNPs and cytokines to see if they hold a better association with clinical features of the above-studied diseases as well as explore new avenues of recent interest, namely haplotype block partitioning of the genome (discussed below).
Haplotype blocks refer to a genomic region of limited recombination where only a few common haplotypes are observed.63–68 These observed haplotypes are highly correlated across populations, offer significant power in association studies of common polymorphisms, and afford the opportunity to study common disease alleles within a defined region. Haplotype-based studies offer one of the most promising approaches to identification of the genetic basis for common diseases. In both large genome-wide68–71 as well as candidate gene-based72,73 analyses, there are concerted efforts to identify, in the population of interest, a set of contiguous alleles that can be represented by a minimal number of SNPs in a region, known as haplotype tagging SNPs (htSNP).73 Several algorithms have been employed to develop a paradigm to evaluate genetic variation across a region and its association to phenotype.74 This suggests a universal approach to correlate a minimal number of polymorphisms with an association or susceptibility to disease. Sebastiani et al. analyzed SNP genotyping on a 105 genes in equal numbers of African-American and European-Americans to determine the minimal number of htSNPs needed for characterization of each gene.73 They found the vast majority of the htSNPs noted in the European-American sample also appeared as htSNPs in the African-American group. Using an algorithm (Best Enumeration of SNP tags or BEST) developed to unambiguously identify htSNPs in arbitrary gene regions such as IL10, they found 8 distinct haplotypes and 7 htSNPs for African-Americans and 2 unique haplotypes and 1 htSNP for European-Americans out of a total 19 SNPs studied in this region. However, they do not identify the htSNPs. In contrast, an analysis by Carlson et al. used an algorithm based on r2 linkage disequilibrium statistic to select the maximally informative set of common htSNPs to assay in candidate-gene association studies.72 This group identified 26 SNPs of which 13 are common in African-Americans and 17 out of 24 are common in European-Americans; they found 2 and 3 htSNPs for African–Americans at r2 > 0.5, and r2 > 08, respectively, while the European-American population yielded 4 htSNPs at r2 > 0.5 and 4 at r2 > 0.8. Other algorithms rely on stochastic approaches to identify characteristic SNPs in a genomic region. These approaches, while computationally powerful may lose information from rare variant SNPs.71,72 In a more analytic vein, though powerful and intriguing in their ability to minimize genotyping in a population, haplotyping tagging SNPs (or haplotype block partitioning) requires establishment in a defined population of known ancestral origin and as such involves large-scale population studies with different ethnic groups and only then can htSNPs be utilized in determining an individual’s susceptibility to disease or disease progression.
Acknowledgments
We thank Diana Chang and Kiran Gupta for help with SLE DNA preparation.
REFERENCES
- 1.Howard M, O’Garra A. Biological properties of interleukin 10. Immunol Today 1992;13(6):198–200. [DOI] [PubMed] [Google Scholar]
- 2.Moore KW, O’Garra A, deWaal Malefyt R, Vieira P, Mosmann T. Interleukin-10. Annu Rev Immunol 1993;11: 165–90. [DOI] [PubMed] [Google Scholar]
- 3.Kim J, Braman C, Copeland NG, et al. Structure of mouse IL10 gene and chromosomal localization of mouse and human genes. J Immunol 1992;148: 3618–3623. [PubMed] [Google Scholar]
- 4.Lin Y, Wei SH, Ho AS, et al. Expression cloning and characterization of human IL10 receptor. J Immunol 1994;152:182–189. [PubMed] [Google Scholar]
- 5.Lalani I, Kailash B, Ahmed AR. Interleukin-10: Biology, role in inflammation and auto immunity. Ann Allergy Asthma Immunol 1997;79:469–481. [DOI] [PubMed] [Google Scholar]
- 6.Moore KW, de Waal Malefyt R, Coffman RL, O’Garra A. Interleukin-10 and the interleukin-10 receptor. Annu Rev Immunol 2001;19683–19765. [DOI] [PubMed]
- 7.de Waal Malefyt R, Abrams J, Bennett B, et al. Il-10 inhibits cytokine synthesis by human monocytes: An autoregulatory role of IL10 by monocytes. J Exp Med 1991;174:1209–1220. [DOI] [PMC free article] [PubMed] [Google Scholar]
- 8.Cassatella MA, Meda L, Bonora-Aska M, Constantin G. Il-10 inhibits the release of proinflammatory cytokines from human polymorphonclear leukocytes. Evidence for an autocrine role of TNF and IL-1B in mediating the production of IL-8, triggered by lipopolysaccharide. J Exp Med 1993;178;2207–11. [DOI] [PMC free article] [PubMed] [Google Scholar]
- 9.Rousset F, Garcia E, Defrance T, et al. IL-10 is a potent growth and differentiation factor for activated human lymphocytes. Proc Natl Acad Sci USA 1992;89: 1890–1893. [DOI] [PMC free article] [PubMed] [Google Scholar]
- 10.Fiorentino DF, Bond MW, Mosmann TR. Two types of mouse T Helper cells IV. Th 2 clones secrete a factor that inhibits cytokine production by TH1 clones. J Exp Med 1989;170;2081–2095. [DOI] [PMC free article] [PubMed] [Google Scholar]
- 11.Tan JQ, Larsen GG, Gesser B, et al. Human IL-10 is a chemoattractant for CD8 and T lymphcytes and an inhibitor of IL-8 induced CD4+ T lymphocyte migration. J Immunol 1993;151:4545–51. [PubMed] [Google Scholar]
- 12.Feldmann M, Brennan FM, Maini RN. Role of cytokines in rheumatoid arthritis. Annu Rev Immunol 1996; 14:397–440. [DOI] [PubMed] [Google Scholar]
- 13.Llorente L, Zou W, Levy Y, et al. Role of interleukin-10 in the B lymphocyte hyperactivity and autoantibody production of human systemic lupus erythematosus. J Exp Med 1995;181:839–44. [DOI] [PMC free article] [PubMed] [Google Scholar]
- 14.Hasegawa M, Fujimoto M, Kikuchi K, Takehara K. Elevated serum levels of IL4, IL10 and IL13 in patients with systemic sclerosis. J Rheumatol 1997;24:328–32. [PubMed] [Google Scholar]
- 15.Giordani L, Bruzzi P, Lasalandra C, et al. Association of breast cancer and polymorphisms of interleukin-10 and tumor necrosis factor-alpha genes. Clin Chem 2003; 49(10):1664–1667. [DOI] [PubMed] [Google Scholar]
- 16.Tanjye SG, Weston KM, Raison RL. Interleukin-10 inhibits the in vitro proliferation of human activated leukemic CD5+B-Cells. Leuk Lymphoma 1998;31(1–2): 121–130. [DOI] [PubMed] [Google Scholar]
- 17.Lazarus M, Hajeer AH, Turner D. Genetic variation in interleukin 10 gene promoter and systemic lupus erythematous. J Rheumatol 1997;24(12):2314–2217. [PubMed] [Google Scholar]
- 18.Crawley E, Kay R, Sillibourne J, Patel P, Hutchinson I, Woo P. Polymorphic haplotypes of the interleukin-10 5′flanking region determine variable interleukin-10 transcription and Are Associated With Particular Phenotypes of juvenile rheumatoid arthritis. Arthritis Rheum 1999;42(6):1101–1108. [DOI] [PubMed] [Google Scholar]
- 19.Westendorph RG, Langermans JA, Huizinga TW, Elousli AH, Verweij CL, Vandenbroucke, JP. Genetic influence on cytokine production and fatal meningococcal disease. Lancet 1997;349:170–174. [DOI] [PubMed] [Google Scholar]
- 20.Turner DM, Williams DM, Sankaran D, et al. An investigation of polymorphism in interleukin-10 gene promoter. Eur J Immunogenet 1997;24:1–8. [DOI] [PubMed] [Google Scholar]
- 21.Eskdale J, Gallagher G, Verweij C, Keijsers V, Westendorp R, Huizinga T. Interleukin 10 secretion in relation to human IL-10 locus haplotypes. Proc Natl Acad Sci USA 1998;95:9465–9470. [DOI] [PMC free article] [PubMed] [Google Scholar]
- 22.Van der Linden MW, Westendorp RG, Sturk A, Bergman W, Huizinga TW. High interleukin-10 production in first-degree relatives of patients with generalized but no cutaneous lupus erythematosus. J Invest Med 200;48: 327–334. [PubMed]
- 23.Hoffmann SC, Stanley EM, Cox ED, et al. Association of cytokine polymorphic inheritance and in vitro cytokine production in Anti-Cd3/CD28-stimulated peripheral blood lymphocytes. 2001; Transplantation 2001;72:1444. [DOI] [PubMed] [Google Scholar]
- 24.Suarez A, Castro P, Alonso R, Moso L, Gutierrez C. Interindividual variations in constitutive interleukin-10 messenger RNA and protein levels and their association with genetic polymorphisms. Transplantation 2003; 75(5):711–717. [DOI] [PubMed] [Google Scholar]
- 25.NCBI SNP database–www.ncbi.nlm.nih.gov
- 26.Underhill PA, Jin L, Lin AA, et al. Detection of numerous Y chromosome biallelic polymorphisms by denaturing high-performance liquid chromatography. Genome Res 1997;7:996–1005. [DOI] [PMC free article] [PubMed] [Google Scholar]
- 27.Rudolph J, White S, Sokolsky C, et al. Determination of melting temperature for variant detection using dHPLC: A comparison between empirical determination and DNA melting prediction software. Genetic Testing 2002; 6(3):169–176. [DOI] [PubMed] [Google Scholar]
- 28.Kube D, Platzer C, von Knethen A, et al. Isolation of human IL10 promoter. Characterization of promoter activity in Burkitt lymphoma cell lines. Cytokine 1995; 7:1–7. [DOI] [PubMed] [Google Scholar]
- 29.Gibson A, Edberg J, Wei J, Westendorp R, Huisinga T, Kimberly R. Novel single nucleotide polymorphisms in distal IL-10 promoter affect IL-10 production and enhance risk of systemic lupus erythematosus. J Immunol 2001;166:3915–3922. [DOI] [PubMed] [Google Scholar]
- 30.Beebe AM, Cua DJ, de Waal Malefyt R. Role of interleukin 10 in autoimmune disease: Systemic lupus erythematosus (SLE) and multiple sclerosis (MS). Cytokine Growth Factor Rev 2002;13(4–5):403–412. [DOI] [PubMed] [Google Scholar]
- 31.Rood MJ, Keijsers V, van der Linden MW, et al. Neuropsychiatric systemic lupus erythematosus is associated with imbalance in interleukin-10 promoter haplotypes. Ann Rheum Dis 1999;58:85–89. [DOI] [PMC free article] [PubMed] [Google Scholar]
- 32.Mok CC, Lanchbury JS, Chan DW, Lau CS. Interleukin-10 promoter polymorphisms in Southern Chinese patients with systemic lupus erythematosus. Arthritis Rheum 1998;41:1090–1095. [DOI] [PubMed] [Google Scholar]
- 33.Hoffman SC, Stanley EM, Cox ED, et al. Ethnicity greatly influences cytokine gene polymorphism distribution. Am J Transplant 2002;2(6):560–567. [DOI] [PubMed] [Google Scholar]
- 34.Tan EM, Cohen AS, Fries JF, et al. The 1982 revised criteria for the classification of systemic lupus erythematosus. Arthritis Rheum 1982;25(11):1271–1277. [DOI] [PubMed] [Google Scholar]
- 35.Eskdale J, Wordsworth P, Bowman S, Field M, Gallagher G. Association between polymorphisms at the human IL-10 locus and systemic lupus erythematosus. Tissue Antigens 1997;50(6):669. [DOI] [PubMed] [Google Scholar]
- 36.Mehrian R, Quismorio FP, Strassmann G, et al. Synergistic effect between IL-10 and bcl-2 genotypes in determining susceptibility to systemic lupus erythematosus. Arthritis Rheum 1998;41(4):596–602. [DOI] [PubMed] [Google Scholar]
- 37.Crawley E, Woo P, Isenberg D. Single nucleotide polymorphic haplotypes of the interleukin-10 5′flanking region are not associated with renal disease or serology in Caucasian patients with systemic lupus erythematosus. Arthritis Rheum 1999;42:2017. [DOI] [PubMed] [Google Scholar]
- 38.Houssiau FA, Lefebvre C, Vanden Berghe M, Lambert M, Devogelaer JP, Renauld JC. Serum interleukin 10 titers in systemic lupus erythematosus reflect disease activity. Lupus 1995;4:393–395. [DOI] [PubMed] [Google Scholar]
- 39.Llorente L, Richaud-Patin Y, Couderc J, et al. Dysregulation of interleukin-10 production in relatives of patients with systemic lupus erythematosus. Arthritis Rheum 1997; 40:1429–435. [DOI] [PubMed] [Google Scholar]
- 40.Tsao BP, Cantor RM, Kalunian KC, et al. Evidence for linkage of a candidate chromosome 1 region to human systemic lupus erythematosus. J Clin Invest 1997; 99:725–731. [DOI] [PMC free article] [PubMed] [Google Scholar]
- 41.Lander ES, Schork NJ. Genetic dissection of complex traits. Science 1994;265:2037–2048. [DOI] [PubMed] [Google Scholar]
- 42.Hung MC, Lau, YK. Basic science of HER-2/neu: A review. Semin Oncol 1999;26(4 Suppl 12):51–59. [PubMed] [Google Scholar]
- 43.Borden EC, Esserman L, Linder DJ, Campbell MJ, Fulton AM. Biological therapies for breast carcinoma: Concepts for improvement in survival. Semin Oncol 1999; 26(4 Suppl):28–40. [PubMed] [Google Scholar]
- 44.Temple SE, Lim E, Cheong KY, et al. Alleles carried at positions −819 and −591 of the IL10 promoter affect transcription following stimulation of peripheral blood cells with Streptococcus pneumoniae. Immunogenetics 2003;55(9):692–732. [DOI] [PubMed] [Google Scholar]
- 45.Kozlowski L, Zakrzewska I, Tokajuk P, Wojtukiewic MZ. Concentration of IL6, IL8 and IL10 in blood serum of breast cancer patients. Rocz Akad Med Bialymst 2003;48:82–84. [PubMed] [Google Scholar]
- 46.Toomey D, Harmey J, Condron C, Kay E, Bouchier-Hayes D. Phenotyping of immune cell infiltrates in breast and colorectal tumors. Immunol Invest 1999; 28(1):29–41. [DOI] [PubMed] [Google Scholar]
- 47.Venetsanakos E, Beckman I, Bradley J, Skinner J. High incidence of interleukin-10 mRNA but not IL2 mRNA detected in breast tumors. Br J Cancer 1997;75(12): 1826–1830. [DOI] [PMC free article] [PubMed] [Google Scholar]
- 48.Mainou-Fowler T, Miller S, Proctor SJ, Dickinson AM. The levels of TNF alpha, IL4 and IL10 production by T-cell in B-cell chronic lymphocytic leukaemia (B-CLL). Leuk Res 2001;25(2):157–163. [DOI] [PubMed] [Google Scholar]
- 49.Jurlander J, Lai CF, Tan J, et al. Characterization of interleukin-10 receptor expression on B-cell chronic lymphocytic leukemia cells. Blood 1997;89(11): 4146–4152. [PubMed] [Google Scholar]
- 50.Yen Chong S, Lin YC, Czarneski J, et al. Cell cycle effects of Il-10 on malignant B-1 cells. Genes Immun 2001;2(5)239–247. [DOI] [PubMed] [Google Scholar]
- 51.Sjoberg J, Aguilar-Santelises M, Sjogren, et al. Interleukin-10 mRNA expression in B-cell chronic lymphocytic leukemia inversely correlated with progression of disease. Br J Haematol 1996;92(2):393–400. [DOI] [PubMed] [Google Scholar]
- 52.Damle R, Wasil T, Fais F, et al. Ig V gene mutation status and CD38 expression as novel prognostic indicators in chronic lymphocytic leukemia. Blood 1999;94(6): 1840–1847. [PubMed] [Google Scholar]
- 53.Wallace AJ. Combined single strand conformation polymorphism and heteroduplex analysis. In Taylor GR (ed): Laboratory Methods for Detection of Mutations and Polymorphisms in DNA. Boca Raton, Florida: CRC Press, 1997:79–94.
- 54.Kronick MN. Heterozygote determination using automated DNA sequencing technology. In Taylor GR (ed): Laboratory Methods for Detection of Mutations and Polymorphisms in DNA. Boca Raton, Florida: CRC Press, 1997:175–189.
- 55.Kennedy GC, Matsuzaki H, Dong S, et al. Large-scale genotyping of complex DNA. Nature Biotechnol 2003;21:1233–1237. [DOI] [PubMed] [Google Scholar]
- 56.Matsuzaki H, Loi H, Dong S, et al. Parallel genotyping of over 10,000 SNPs using a one primer assay on a high density oligonucleotide array. Genome Res 2004;3: 414–425. [DOI] [PMC free article] [PubMed] [Google Scholar]
- 57.Liu WM, Di X, Yang G, et al. Algorithms for large scale genotyping microarrays. Bioinformatics 2003;19: 2397–2403. [DOI] [PubMed] [Google Scholar]
- 58.Kuklin A, Munson K, Gjerde D, Haefele R, Taylor P. Detection of single-nucleotide polymorphisms with the WAVE™ DNA Fragment Analysis System. Genet Test 1998;1(3):201–206. [DOI] [PubMed] [Google Scholar]
- 59.Spiegelman JI, Mindrinos MN, Oefner PJ. High-accuracy DNA sequence variation screening by DHPLC. Biotechniques 2000;29:1084–1092. [DOI] [PubMed] [Google Scholar]
- 60.Kuklin A, Davis AP, Hecker KH, Gjerde DT, Taylor PD. A novel technique for rapid automated genotyping of DNA polymorphisms in the mouse. Mol Cell Probes 1999;13(3):239–242. [DOI] [PubMed] [Google Scholar]
- 61.D’Alfonso S, Rampi M, Rolando V, Giordano M, Momigliano-Richiardi P. New polymorphisms in the IL-10 promoter region. Genes Immun 2000:1:231–233. [DOI] [PubMed] [Google Scholar]
- 62.Bidwell J, Keen L, Gallagher G, et al. Cytokine gene polymorphism in human disease: On-line databases, Suppl. 1. Genes Immun 2001;2:61–70. [DOI] [PubMed] [Google Scholar]
- 63.Patil N, Berno AJ, Hinds DA, et al. Blocks of limited haplotype diversity revealed by high–resolution scanning of human chromosome 21. Science 2001;294: 1719–1723. [DOI] [PubMed] [Google Scholar]
- 64.Rioux JD, Daly MJ, Silverberg MS, et al. Genetic variation in the 5q31 cytokine gene cluster confers susceptibility to Crohn disease. Nat Genet 2001;29:223–228. [DOI] [PubMed] [Google Scholar]
- 65.Daly MJ, Rioux JD, Schaffner SF, Hudson TJ, Lander ES. High-resolution haplotype structure in the human genome. Nat Genet 2001;29:229–232. [DOI] [PubMed] [Google Scholar]
- 66.Reich DE, Cargill M, Bolk S, et al. Linkage disequilibrium in the human genome. Nature 2001;411:199–204. [DOI] [PubMed] [Google Scholar]
- 67.Gabriel SB, Schaffner SF, Nguyen H, et al. The structure of haplotype blocks in the human genome. Science 2002;296:2225–2229. [DOI] [PubMed] [Google Scholar]
- 68.Johnson GC, Esposito L, Barratt BJ, et al. Haplotype tagging for the identification of common disease genes. Nat Genet 2001;29:233–237. [DOI] [PubMed] [Google Scholar]
- 69.Ke X, Cardon LR. Efficient selective screening of haplotype tag SNPs. Bioinformatics 2003;19(2):287–288. [DOI] [PubMed] [Google Scholar]
- 70.Meng Z, Zaykin DV, Xu CF, Wagner M, Ehm MG. Selection of genetic markers for association analyses using linkage disequilibrium and haplotypes. Am J Hum Genet 2003;73:115–130. [DOI] [PMC free article] [PubMed] [Google Scholar]
- 71.Zhang K, Deng M, Chen T, Waterman MS, Sun F. A Dynamic programming algorithm for haplotype block partitioning. Proc Natl Acad Sci USA 2002;99:7335–7339. [DOI] [PMC free article] [PubMed] [Google Scholar]
- 72.Carlson C, Eberle M, Rieder M, Yi Q, Kruglyak L, Nickerson D. Selecting a maximally informative set of single-nucleotide polymorphisms for association analyses using linkage disequilibrium. Am J Hum Genet 2004;74: 106–120. [DOI] [PMC free article] [PubMed] [Google Scholar]
- 73.Sebastiani P, Lazarus R, Weiss ST, Kunkel LM, Kohane IS, Ramoni MF. Minimal haplotype tagging. Proc Natl Acad Sci USA 2003;100:9900–9905. [DOI] [PMC free article] [PubMed] [Google Scholar]
- 74.Goldstein DB. Islands of linkage disequilibrium. Nat Genet 2001;29:109–111. [DOI] [PubMed] [Google Scholar]