Abstract
For non-model organisms that do not have sequence information readily available, amplified fragment length polymorphism (AFLP) is a well-established technique that can be used for genomic mapping applications such as genetic diversity studies or phylogenetic studies. While AFLP can be performed on a variety of systems, including gel-based systems that require multiple labor-intensive steps, the availability of a more automated system that integrates the assay, electrophoresis platform, and analysis software could enable researchers to greatly increase their throughput and facilitate routine AFLP analysis. We demonstrate the use of such a system for AFLP analysis on Hedysarum species. AFLP assays performed on samples belonging to two different species isolated from Utah identified different varieties that clustered as expected from their actual locations.
Keywords: AFLP, Hedysarum, capillary electrophoresis, GeneMapper
Amplified fragment-length polymorphism (AFLP) is a genetic mapping technique based on selective amplification of a subset of restriction enzyme–digested DNA fragments to create a unique fingerprint for a particular genome.1 Commonly utilized in plant and microbial organisms, the AFLP technique is used for a variety of applications, such as genetic mapping, genealogical studies among closely related individuals, quantification of genetic diversity within and among species, and phylogenetic studies of closely related species.2 The power of the AFLP technique derives from the ability to quickly generate large numbers of marker fragments for any organism, without any prior knowledge of the genomic sequence.
Successful AFLP assays depend on the availability of optimized reagents and a robust electrophoresis platform, as well as analysis software that can correctly score AFLP sample data. In this article, we demonstrate the use of the Applied Biosystems 3130xl Genetic Analyzer and GeneMapper software for AFLP analysis on Hedysarum boreale (Utah sweetvetch) and H.occidentale varieties.3 To permit variety identification of Hedysarum samples isolated from different locations in central Utah, AFLP analysis was performed using the Applied Biosystems Plant Mapping Kit, the 3130xl Genetic Analyzer, and GeneMapper software. Our results show that this system can provide informative AFLP analyses.
MATERIALS AND METHODS
Plant Materials
Seeds were collected from natural populations (Table 1) by the Utah Division of Wildlife Resources, Great Basin Research Center. Seeds were germinated on moist blotter paper and planted into single-plant cone containers. Genomic DNA was extracted from individual seedlings using the DNeasy 96 plant DNA extraction kit and MM300 mixer mill (Qiagen, Valencia, CA).
TABLE 1.
Description of Hedysarum Sweetvetch Populations
| Species | Population | Latitude, Longitude | County (Utah) |
| H. boreale | San Rafael Swell | 38.87, -110.72 | Emery |
| H. boreale | Rabbit Gulch | 40.18, -110.50 | Duchesne |
| H. boreale | Echo Reservoir | 40.94, -111.41 | Summitt |
| H. boreale | Cutoff | 40.24, -110.91 | Wasatch |
| H. occidentale | Joes Valley | 39.29, -111.26 | Emery |
AFLP Assay
Reagents from the Applied Biosystems Plant Mapping Kit consisting of the Ligation/Preselective Amplification Module and Selective Primer kits (part numbers listed below) were used to perform various steps of the AFLP assay. Briefly, genomic DNA was digested with the restriction enzymes EcoR1 (New England Biolabs #R0101S) and MseI (New England Biolabs #R0525S), ligated to adapters using T4 DNA Ligase (New England Biolabs #M0202S), and used in a preselective amplification step using the AFLP Ligation/Preselective Amplification Module (Applied Biosystems P/N 402004). An aliquot of the pre-selective amplification reaction was then used in the selective amplification step with primers from the AFLP I Selective Primer Kit (Applied Biosystems P/N 4303050). Reaction volumes and cycling conditions were utilized as described in the user manual. The selective amplification product was amplified using three primer pairs: FAM-EcoRI-ACA and MseI-CTT, FAM-EcoRI-ACA and MseI-CTC, and JOE-EcoRI-AGG and MseI-CAT. For all three pairs the EcoRI primer was used at a final concentration of 50 nM and the MseI primer at 250 nM.
Electrophoresis
One microliter of the selective amplification product was mixed with 0.5 μL of the GeneScan 500 ROX size standard (Applied Biosystems P/N 402985) and 8.5 μL of Hi-Di Formamide (Applied Biosystems P/N 4311320). The mixture was denatured and loaded on the 16-capillary system of the Applied Biosystems 3130xl Genetic Analyzer. A 36-cm capillary array (Applied Biosystems P/N 4315931) and 3130 POP-7 polymer (Applied Biosystems P/N 4352759) were used. The protocol used the run module Fragment Analysis36_POP-7 and dye set F.
Data Analysis
The workflow for analysis of data in GeneMapper software v3.7 comprises the following steps:
Addition of the appropriate samples to a new project.
Setting up the analysis parameters and running the analysis.
Review of results of the analyzed project.
It should be noted that steps 1 and 2 can be automated with the autoanalysis option in the instrument’s Data Collection software. By using this option, samples files for every run will be automatically added to GeneMapper and analyzed. The user will need to perform only Step 3 at the completion of the run. For analysis to be performed, the following parameters need to be specified in GeneMapper software: the Size Standard, which is a collection of fragments of known sizes used for sizing the sample fragments; the Panel (defined below); the Analysis Method, which is a collection of algorithms and other parameters determined by the user for peak detection, peak quality, and allele calling; and the Bin Set. In GeneMapper software, a panel represents the collection of expected size ranges and dye colors for the collection of markers. Within the panel there are bins that represent the actual fragment size and dye color for a given marker as determined on a given electrophoresis platform. The bin that is assigned to a marker is used to generate the allele call or genotype. If there are multiple alleles for a marker in a study, there will be bins assigned to each of those alleles, generating a bin set for that marker.
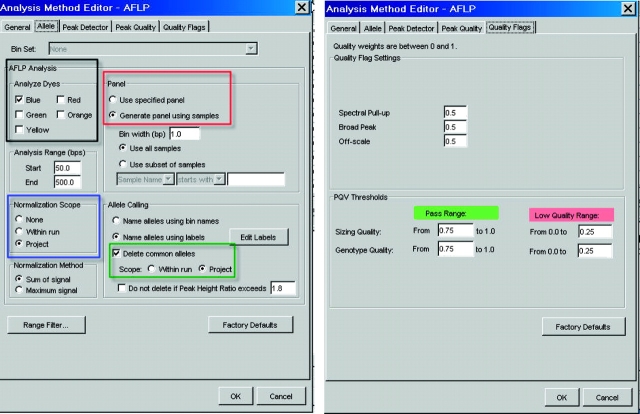
GeneMapper software contains a default AFLP-specific Analysis Method that contains settings designed to recognize and analyze AFLP data (Figure 1). Features of this Analysis Method include the ability to generate panels from samples that have been added to the project (red outline), normalization of data (blue outline), and analysis of multiple colors (black outline) in a single well that can be used for multiplex reactions (Figure 1). Since the number and type of fragments will be unknown at the start of an AFLP project, GeneMapper software can automatically create panels and bins from the collective set of peaks present in all samples. Alternatively, users can choose to generate panels and bins from a subset of samples that can then be applied to the rest of the samples. The normalization feature (blue outline in Figure 1) corrects for differences in signal intensity that could result from factors such as unequal starting template concentrations and differences in template quality or amplification efficiency. GeneMapper software offers two different methods for normalization: sum of signal and maximum signal. In addition, the analysis method also offers the option of deleting non-informative common peaks in the final analysis (green-outlined area in Figure 1). Users can choose to modify each of these parameters to suit the needs of their project and the type of data being generated. The specified analysis parameters can be saved in the Analysis Method, which can then be applied to all the samples. In addition, the same Analysis Method can be applied to subsequent assays, facilitating the use of consistent analysis parameters across an entire study. Once the final analysis parameters have been specified, the data can be analyzed and the results saved as part of a project. The analysis output can be set up to produce final results in the standard binary format, where 1s (ones) represent the presence and 0s (zeros) represent absence of a given fragment category (i.e., bin). The analyzed results can be exported in a format such as tab-delimited text or .csv and used in further analysis by downstream software packages.
FIGURE 1.
AFLP analysis method in GeneMapper software (left panel). The outlined regions highlight some of the parameters that can be used to optimize analysis. On the right, the quality flags for Sizing and Genotype quality are shown. The values shown are the default values and can be modified by the user.
Genealogical Analysis
Neighbor-joining genetic distance analysis4 was used to investigate genealogical lineages and population structure, based on pairwise comparisons of the total number of DNA polymorphisms (AFLPs) between individual plants. Pairwise comparisons of the total number of DNA polymorphisms between individual plants were computed from the binary matrix (75 plants by 371 fragment categories). The neighbor-joining genetic distance analysis4 was performed using PAUP* version 4.0b8.5 A graphic display of the neighbor-joining tree was developed using TREEVIEW.6
RESULTS
Electrophoresis on the 3130xl Genetic Analyzer
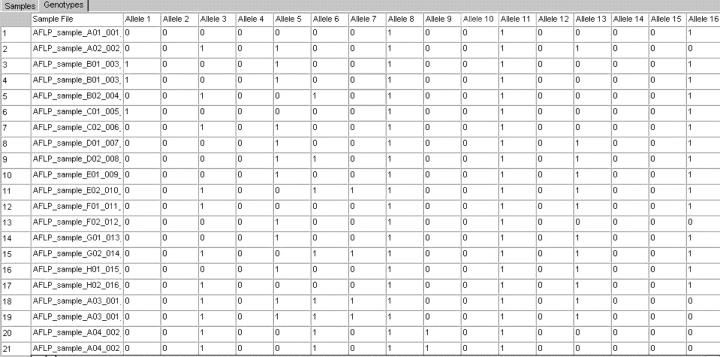
Ninety-six DNA samples were assayed using three primer pairs: FAM-EcoRI-ACA and MseI-CTT, FAM-EcoRI-ACA and MseI-CTC, and JOE-EcoRI-AGG and MseI-CAT. Two types of results were obtained: the sample plots containing the bins and alleles calls, and the genotypes table. For the sample plots, an example of a typical electropherogram is presented in Figure 2. On average, the three primer pairs generated around 150 or more well-resolved peaks that could be used in downstream analysis. An example of a polymorphic and common peak is indicated on the plots (Figure 2). The second type of results obtained is the genotypes for the alleles. As can be seen in Figure 3, each allele was assigned a binary value indicating presence or absence. Additional information such as size, peak height, or peak area of every allele can also be included in the genotypes table.
FIGURE 2.
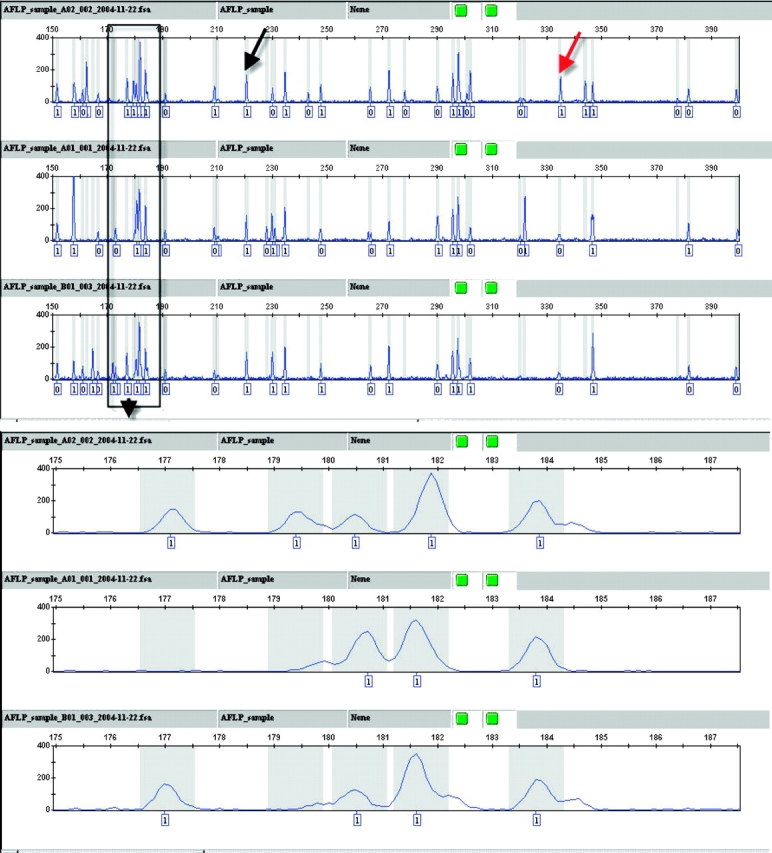
Electropherograms of three H. boreale AFLP samples run on the Applied Biosystems 3130xl Genetic Analyzer displayed in the GeneMapper software. The gray bars represent bins assigned to the peaks. The allele calls are shown on the bottom of each plot. The black arrow indicates a common peak present in all three samples, while the red arrow denotes a polymorphic peak that is present in just one sample. A magnified view of the groups of peaks present in boxed region of the upper panel is shown in the lower part of the figure. The rfu threshold for allele calling was set at 100, so that any peaks at 100 or higher rfu were assigned a 1 and those that were lower were assigned a 0.
FIGURE 3.
Final genotypes in a binary format for subset of the samples and alleles from the AFLP run with the primer pair FAM-Ecori-ACA and Msei-CTT as displayed in the Genotypes tab of the GeneMapper software.
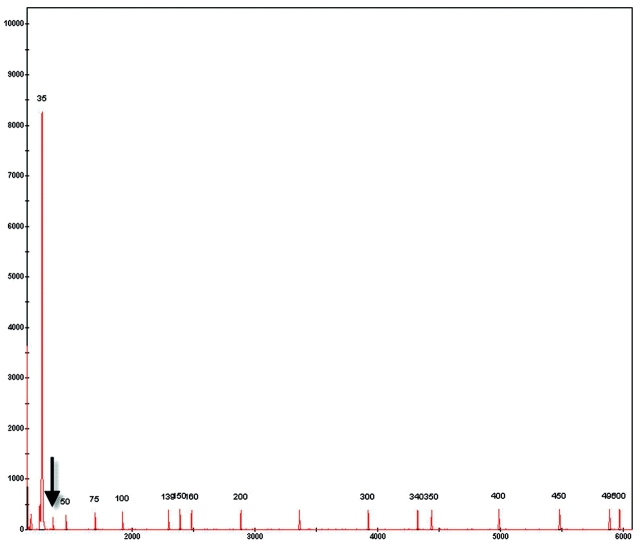
Before the genotypes were used in genealogical analysis, the results were reviewed as follows: the sizing quality, genotype quality, bin assignment, and allele calls were reviewed manually for accuracy. There are two categories of quality values (Figure 1, right panel): sizing quality (SQ) is an indicator of how well samples have been sized, and genotype quality (GQ) reflects the overall quality of the genotype results that were generated. Both SQ and GQ values are calculated from a series of individual values that are weighted depending on their importance to generate the final value. At the completion of the analysis, the software will automatically generate the SQ and GQ values either as numeric values ranging from 0 to 1 or as symbols, where a green square is assigned to passing samples, yellow triangles to samples that need to be checked, and red octagon symbols to samples that are low or failed quality values. Samples showing poor quality can be easily identified and reviewed so that necessary steps can be taken to fix problems. Three samples from the run with the FAM-EcoRI-ACA and MseI-CTT primer pair will be used to highlight the use of quality values in data review. As can be seen in Figure 4, the three samples show “check” quality symbols for two parameters—the sizing (SQ) and peak intensity, represented by the offscale or OS column. Examination of the sample plots indicated the presence of a typical primer peak with a very high peak height, which resulted in the OS quality check being triggered (data not shown). In addition, this primer peak interfered with sizing of the smallest fragment (35 bp) of the size standard (Figure 5). Since the product of the selective amplification was used directly without cleanup in electrophoresis, the presence of an offscale primer peak is not surprising. Reanalysis of the samples with an edited size standard where the 35-bp peak has been excluded from the analysis, resulted in a passing sizing quality value (Figure 6). It should be noted that since the Analysis Range was set from 50 to 500 bps (Figure 1, left panel) the exclusion of the 35-bp fragment will not affect the analysis of the Hedysarum sample fragments. If fragments smaller than 50 bp need to be analyzed, the size standard can be edited to assign the 35-bp peak to correct peak.
FIGURE 4.
Samples showing low quality values. Quality values are indicated on the right by the green squares (passing) and yellow triangle (check) symbols.
FIGURE 5.
Incorrect assignment of the 35-bp size standard fragment to the off-scale primer peak. The correct 35-bp peak of the size standard is indicated by the arrow. The numeric value of the sizing quality is indicated on top of the graph.
FIGURE 6.
Samples shown in Figure 5 showing passing SQ values after edits were made in the size standard to fix the incorrect assignment of the 35-bp peak.
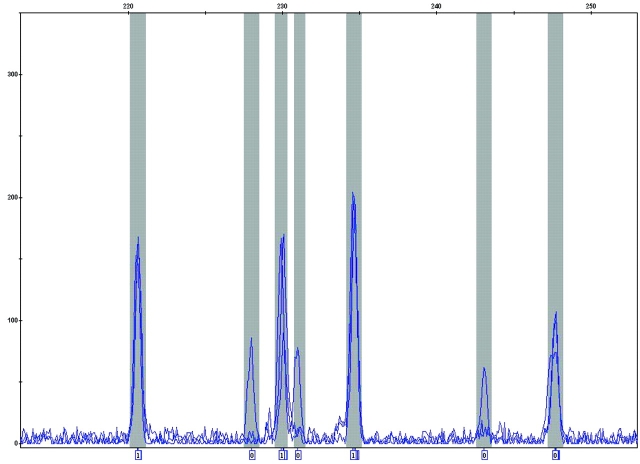
Review of bins was performed as follows: Bins were assigned using the “Generate panel using samples” option (red outlined area in Figure 1, left panel), and therefore peaks from samples were used for bin creation. Using the “Edit labels” option shown in Figure 1, the threshold for allele calling was set at 100 rfu, so that if a bin contained a peak above this threshold, the allele was considered to be present and was assigned a binary value of 1. To perform manual review of the bins, samples were displayed in the overlay mode, enabling identification of bins that needed to be edited, deleted, or added (Figure 7). At the end of this review process, the bin set was saved as a fixed bin set within the software, so that it could be applied to additional projects.
FIGURE 7.
Overlaying multiple plots to view bin assignment. A section of a sample plot in the GeneMapper software where peaks have been overlaid on top of each other with the blue dye color (FAM) is presented. The gray bars indicate the bins that have been assigned to the peaks shown. The 1 and 0 labels shown on the bottom of the graph represent the presence or absence of a particular allele, respectively, based on a threshold of 100 or higher rfu for presence. For a given bin, the multiple overlapping labels represent peaks from different samples that fall within the same bin but are slightly shifted with respect to their size, as determined by the apex of the peak.
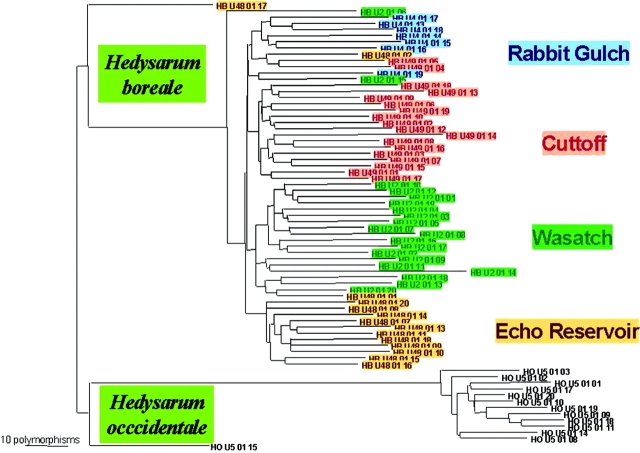
A total of 371 polymorphic DNA fragment categories were detected among the 75 Hedysarum samples using the three AFLP primers. Eleven samples were excluded from the analysis due to insufficient number of fragments or poor-quality data. Results of genealogical analysis using these 371 polymorphic DNA fragments are shown in Figure 8. Note that for a given pair of samples, the physical distance between them as measured by the length of the line separating them is reflective of the genetic distance between them. The greater the separation between two samples, the greater the number of differences between two samples. No two plants displayed identical profiles over these 371 fragment categories. The analysis showed that individual plants were correctly classified into one of two groups: H. boreale and H. occidentale (Figure 8). Moreover, most of the H. boreale plants were correctly classified into four groups corresponding to collection site (Figure 8). There were a few samples, such as HB U2 01 06, U48 01 02 and U2 01 15, that fell outside the expected groups. Examination of the electropherograms for these samples did not indicate problems with the number or quality of fragments. However, reanalysis of these samples with more primer pairs might be necessary to confirm whether these results were indicative of possible biological dispersal.
FIGURE 8.
Neighbor-joining cluster analysis of four Hedysarum boreale accessions and one H. occidentale accession, based on the number of DNA polymorphisms (AFLPs) between individual plants (see distance scale).
DISCUSSION
The Applied Biosystems Plant Mapping kit and the 3130xl Genetic Analyzer, in conjunction with the GeneMapper software, is an integrated system for sample loading, data collection, fragment size calling, and accurate allele calling in both graphical and tabular formats for AFLP assays. By using POP-7 polymer on the 3130xl system, multiple applications for both sequencing and fragment analysis can run seamlessly on a single system. The software features, such as the use of the samples for the generation of panels, normalization of the peak heights, ability to delete common peaks, and quality values, should enable accurate AFLP analysis that if necessary can be easily optimized for different parameters.
This system has been shown to be useful for species and variety identification of Hedysarum sweet-vetches. The results demonstrate informative biological data concerning the genetic identity of the Hedysarum collections. As expected, plants were separated into two distinct groups according to species identifications (i.e., H. boreale and H. occidentale). Moreover, detection of genetic identity within collection sites of H. boreale demonstrates the relatively precise nature of the AFLP detection techniques described here. Imprecise classifications of collection sites by DNA fingerprinting could be attributable to real biological dispersal or an insufficient amount of genetic data (i.e., an insufficient number of AFLP primer pairs).
LICENSING
The AFLP process is covered by patents owned by Key-gene N.V.
DISCLAIMER
Mention of trade names or commercial products in this article is solely for the purpose of providing specific information and does not imply recommendation or endorsement by the U.S. Department of Agriculture.
REFERENCES
- 1.Vos P, Hogers R, Bleeker M, Reijans M, van de Lee T, Hornes M, et al. AFLP: A new concept for DNA fingerprinting. Nucleic Acids Res 1995;23:4407–4414. [DOI] [PMC free article] [PubMed] [Google Scholar]
- 2.Savelkoul, PHM, Aarts HJM, De Haas J, Dijkshoorn L, Duim B, Otsen M, et al. Amplified-fragment length polymorphism analysis: The state of an art. J Clin Microbiol 1999; 37:3083–3091. [DOI] [PMC free article] [PubMed] [Google Scholar]
- 3.Welsh, SL. Names and types of Hedysarum L. (Fabaceae) in North America. Great Basin Naturalist 1995; 55:66–73. [Google Scholar]
- 4.Saitou N, Nei M. The neighbor-joining method: A new method for reconstructing phylogenetic trees. Mol Biol Evol 1987: 4:406–425 [DOI] [PubMed] [Google Scholar]
- 5.Swofford DL. PAUP*. Phylogenetic Analysis Using Parsimony (*and other Methods). Version 4. 1998: Sinaur Associates, Sunderland, Massachusetts.
- 6.Page, RD. Treeview: An application to display phylogenetic trees on personal computers. Comp Appl Biosci 1996;12:357–358. [DOI] [PubMed] [Google Scholar]


