Abstract
Many recent advances in biology and medicine have resulted from DNA sequence alignment algorithms and technology. Traditional approaches for the matching of DNA sequences are based either on global alignment schemes or heuristic schemes that seek to approximate global alignment algorithms while providing higher computational efficiency. This report describes an approach using the mathematical operation of cross-correlation to compare sequences. It can be implemented using the fast fourier transform for computational efficiency. The algorithm is summarized and sample applications are given. These include gene sequence alignment in long stretches of genomic DNA, finding sequence similarity in distantly related organisms, demonstrating sequence similarity in the presence of massive (approximately 90%) random point mutations, comparing sequences related by internal rearrangements (tandem repeats) within a gene, and investigating fusion proteins. Application to RNA and protein sequence alignment is also discussed. The method is efficient, sensitive, and robust, being able to find sequence similarities where other alignment algorithms may perform poorly.
Keywords: Sequence alignment, algorithm, software, cross-correlation
Many recent advances in biology and medicine stem from DNA sequence alignment algorithms and technology. For example, gene discovery, identification of genetic aberrations, and development of many novel medical therapies all depend on matching a DNA sequence to its correct location in the genome. Furthermore, alignment information is often crucial in the characterization of a gene’s function. For decades, the alignment methods of Dayhoff,1 Smith-Waterman,2 and Needleman-Wunsch3 have been enhanced and refined. However, improvements in speed or performance, such as FASTA4,5 and BLAST6,7 algorithms often sacrifice sensitivity and confidence in match quality. To date, relatively little use has been made of cross-correlation and the fast Fourier transform (FFT) for sequence matching.8,9 It has been suggested that DNA bases be mapped onto the complex plane before cross-correlation, although the implications of this approach have not been fully studied.10 Here we further explore this approach to DNA sequence alignment, allowing the full speed and power of digital signal-processing techniques, such as the fast Fourier transform (FFT), to be applied to the sequence alignment problem, providing information complementary to that generated by existing methods.
Applications of DNA sequence alignment vary widely, from genome assembly using shotgun contigs11,12 to cladistic sequence homology for building phylogenetic trees,13,14 with each application having different requirements. Evolutionary studies require a robust method for handling gaps, insertions, substitutions, translocations, and other rearrangements, while shotgun sequencing relies on rapid determination of exact sequence matches of overlapping ends. Many approaches are computationally inefficient when applied to large data sets. Global alignment and some heuristic schemes scale unfavorably as O(N2) processes, where the computational effort is proportional to the square of sequence length. Faster methods exist, but generally involve tradeoffs such as decreased sensitivity, limitations in dealing with large non-coding regions, or a requirement for preprocessing of sequence databases.15 Importantly, sequence alignment using cross-correlation can be implemented as a fast (O[N log2(N)]) process, and is robust in dealing with insertions, deletions, tandem repeats, and translocations. Furthermore, this method yields additional information that complements other popular methods for sequence alignment.
METHODS
First, a complex number is assigned to each nucleotide base, with complementary bases having opposite signs. For example, the DNA sequences AACGTGT and ACG are represented by two vectors: (i,i,−1,1,−i,1,−i) and (i,−1,1). A new vector can then be generated by cross-correlation

where g and h represent the sequences to be compared and * indicates the complex conjugate. Equation1 represents a kind of “sliding dot product” between the vectors representing the two sequences, one shifted by n units relative to the other, with n ranging from negative to positive values. It defines the cross-correlation function that, together with the assignment of complex numbers to the AGCT nucleotides, defines the algorithm.
Application of the cross-correlation function to DNA sequence alignment is as follows: A positive peak in the real part of the cross-correlation function indicates similarity between two sequences. A negative peak indicates complementary similarity, where one sequence is composed of complementary bases compared to a second sequence. When looking for complementary DNA, the 5′–3′ sense of one strand could be reversed before performing the cross-correlation. For peptide or protein sequence alignment, one or more complex numbers are assigned to each amino acid residue, and cross-correlation is performed. The algorithm has been tested and applied in both BASIC and R (http://www.r-project.org/) programming languages.
The cross-correlation can be computed using the fast Fourier transform (FFT), which is a fast O(N log2[N]) process.16 Briefly, the strategy is to perform an FFT on each of the two sequences, invert the sign of the imaginary part of one Fourier domain representation of one of the sequences, multiply the two Fourier domain functions, and transform the result back using the inverse FFT.
RESULTS AND DISCUSSION
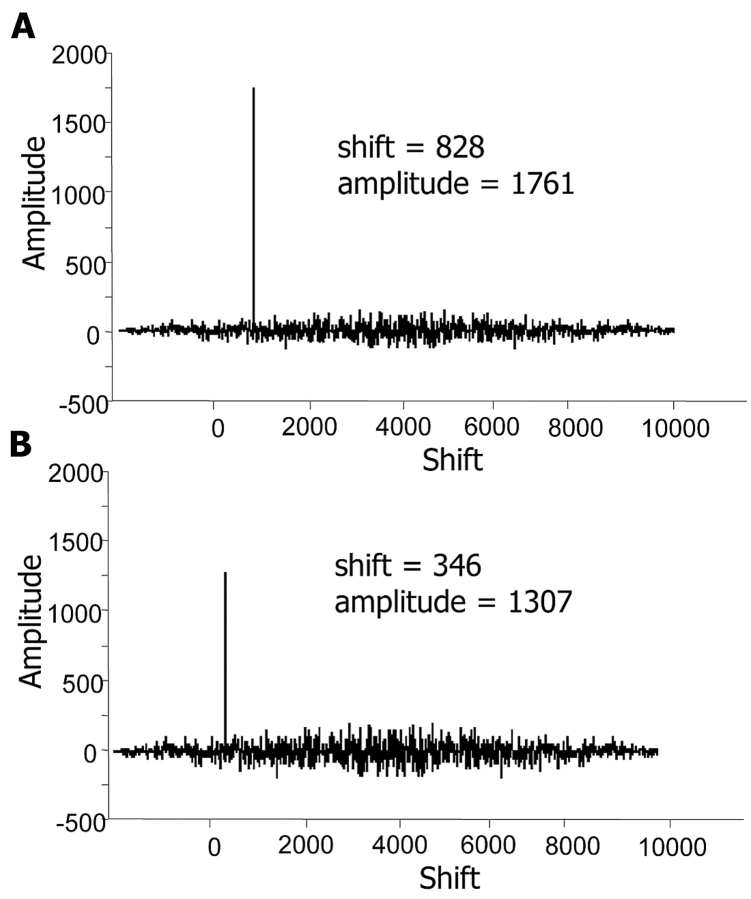
Results from cross-correlation alignment of the pyrG gene of Mycobacterium tuberculosis (NCBI GeneID: 885048) against a 10-kb stretch of genome DNA are shown in Figure 1A. The large peak of amplitude 1761 identified the presence of the pyrG gene. The amplitude equals the length of the shorter of the two sequences being compared, indicating a perfect match over the full length of the smaller sequence. As displayed in Figure 1B, base substitutions reduce peak amplitude, where the cross-correlation of the pyrG gene from Mycobacterium leprae (NCBI GeneID: 910493) aligned with the same 10-kb stretch of M. tuberculosis genomic DNA produced a peak of amplitude 1307, indicating a high but imperfect degree of sequence similarity.
FIGURE 1.
Real part of cross-correlation function using Equation 1. A: pyrG gene of M. tuberculosis, cross-correlated with a 10-kb region of M. tuberculosis genome. The large peak of amplitude 1761 identified the presence of the pyrG gene and indicated a perfect match over the full length of the gene. B: pyrG gene of M. leprae, cross-correlated with the same 10-kb region of M. tuberculosis genome produced a peak of amplitude 1307, indicating a high but imperfect degree of sequence similarity.
To test a more extreme case, we generated a series of artificial examples by random substitutions of up to 90% of the nucleotide bases in the M. tuberculosis pyrG gene. In four separate analyses, the peak amplitudes ranged from 124 to 180, greatly exceeding the background root mean squared (RMS) noise level of 28. Importantly, this demonstrates that the cross-correlation alignment method can be used to detect even deeply hidden sequence homology, whereas many existing alignment methods are unable to detect sequence homology reliably for such difficult cases.
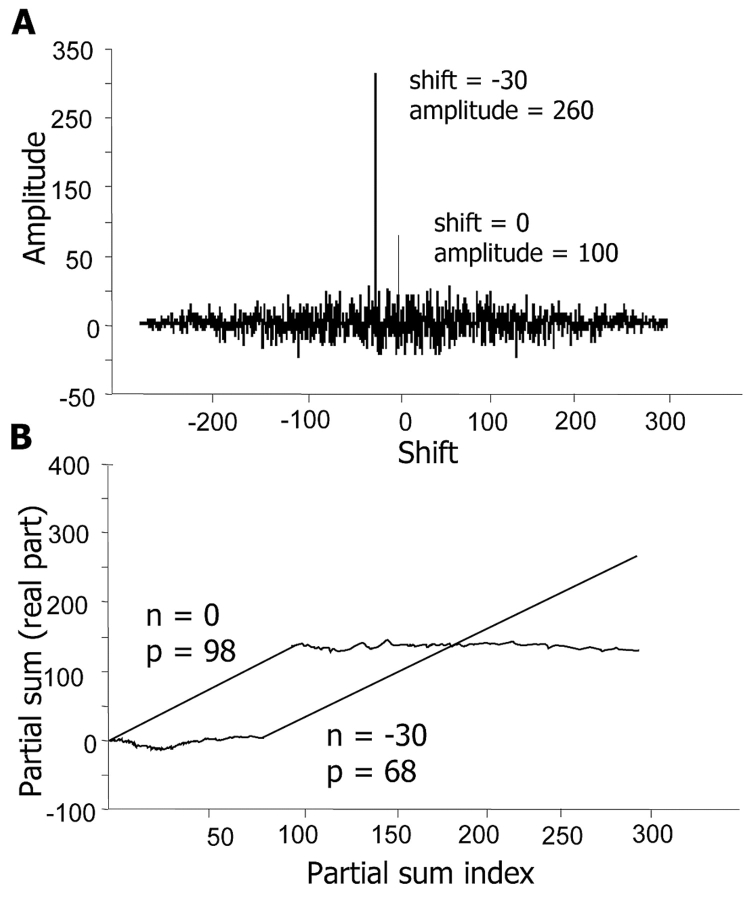
Peak amplitude can also be reduced due to peak splitting. This reduction is akin to a “gap penalty,” as found in conventional alignment methods. Insertion or deletion of a single nucleotide base produces a frame shift, which by the cross-correlation function will produce a split peak with a spacing of one unit. This decrease in amplitude is a useful scoring metric, with no adjustable parameters necessary for gap penalties. Insertion or deletion of larger nucleotide sizes would produce the corresponding reduction in amplitude and characteristic split peak in the cross-correlation alignment. As shown in Figure 2A, the MV4-11 cell line, which contains a well-characterized 30-nucleotide base internal repeat in the flt3 gene,17,18 was compared against the wild-type flt3. The shift values of 0 and −30 demonstrate that the variant flt3 gene in the MV411 contains the 30-bp repeat.
FIGURE 2.
Real part of cross-correlation function using Equation 1. A: MV4-11 variant of flt3 gene, cross-correlated with a reference sequence consisting of wild-type flt3 gene, where n = 0 means that the two sequences are unshifted relative to each other, and n = −30 means that the MV4-11 sequence is shifted 30 bases left with respect to wild-type sequence. B Real part of partial sum using equation 2 for MV4-11 variant of flt3 gene compared with a reference sequence consisting of wild-type flt3 gene, showing that location of the 30-base internal repeat occurs between nucleotide 68 and 98.
Global sequence alignment methods deal poorly with intrasequence rearrangements. This has been cited as a significant problem for global alignment methods, since intrasequence rearrangements are quite common among certain proteins.19,20 Illustrating with an artificial example, we generated a sequence by moving 99 residues from the end of the wild-type flt3 sequence mentioned above and placing them at the beginning of the sequence. Using an online sequence comparison Web page, neither Smith-Waterman nor Needleman-Wunsch performed well (personal communication, http://motif.Stanford.edu.alion). Both algorithms were run using the default settings, and neither correctly identified sequence similarity in the 99-residue piece that was moved (approximately 30% of the sequence). Smith-Waterman successfully found the similarity in the remaining 70% of the sequence, and Needleman-Wunsch failed to correctly identify any region of sequence similarity. In contrast, the cross-correlation alignment succeeded in finding all regions of sequence similarity.
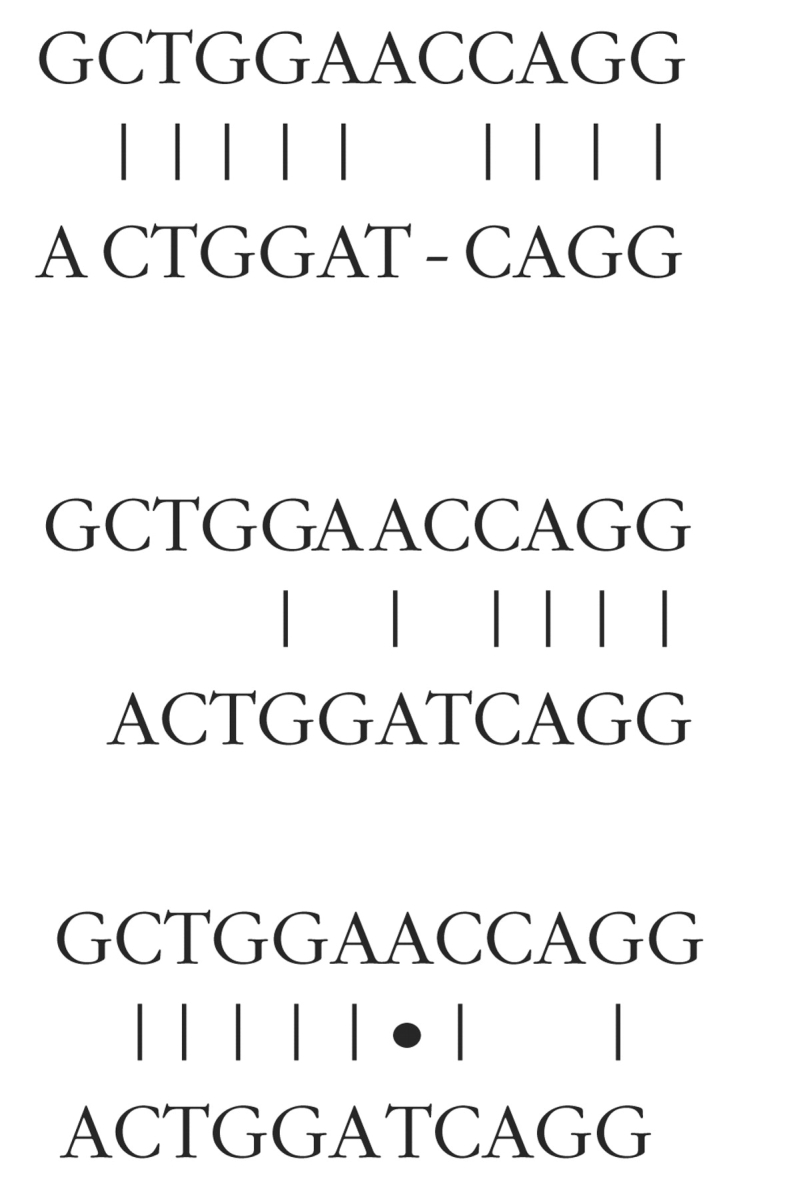
Although peaks in the cross-correlation function tell us that there is significant similarity between two sequences, they do not necessarily tell us where the similarity is located. However, one simple way to locate similar regions, or conserved domains, is to line one sequence up against another using the peaks in the cross-correlation function to determine the shift value. The base-by-base comparison can then be performed. This only has to be done a few times—once for each major peak in the cross-correlation function. This operation can be expressed in graphs looking somewhat like conventional alignment graphs; however, the graphs are not completely equivalent. For example, in comparing the sequence of ACTGGAT-CAGG against GCTGGAACCAGG, a traditional alignment graph could look like:

In contrast, alignment by cross-correlation will generate two alignment graphs, based on the presence of two significant peaks in the cross-correlation function. These look like:

where • represents a complementary match.
Conventional alignment methods attempt to combine all alignment information into a single graph, while the cross-correlation function may generate multiple graphs, each representing part of the alignment picture. Thus, the method can readily identify multiple homology domains, even when they are separated by insertions, deletions, or translocations.
A second approach to identify similarity domains is to hold n fixed and plot the function:

where Pn(m) represents a partial sum from Equation 1. To use this equation, a peak is selected from the cross-correlation function, and its shift value (n) is determined. The value of Pn(m) is then plotted as a function of m. Regions trending upward indicate sequence similarity, and regions trending downward indicate complementary similarity. A noiseless region with a slope of +1 corresponds to perfect matching of a region, and a slope of −1 indicates perfect complementary matching.
Figure 2B represents the partial sum plots of Pn(m) for the MV4-11 cell line, which contains a 30-bp internal repeat in the flt3 gene,18 as compared against the wild-type flt3. Values of n (−30 and 0) were selected from the positions of the two peaks in Figure 2A. Accordingly, the first similarity domain starts at position 1 of the wild type, and extends to position 98, while a second alignment starts at position 68, and extends to the end of the sequence, with the overlap caused by the 30-nucleotide internal repeat.17
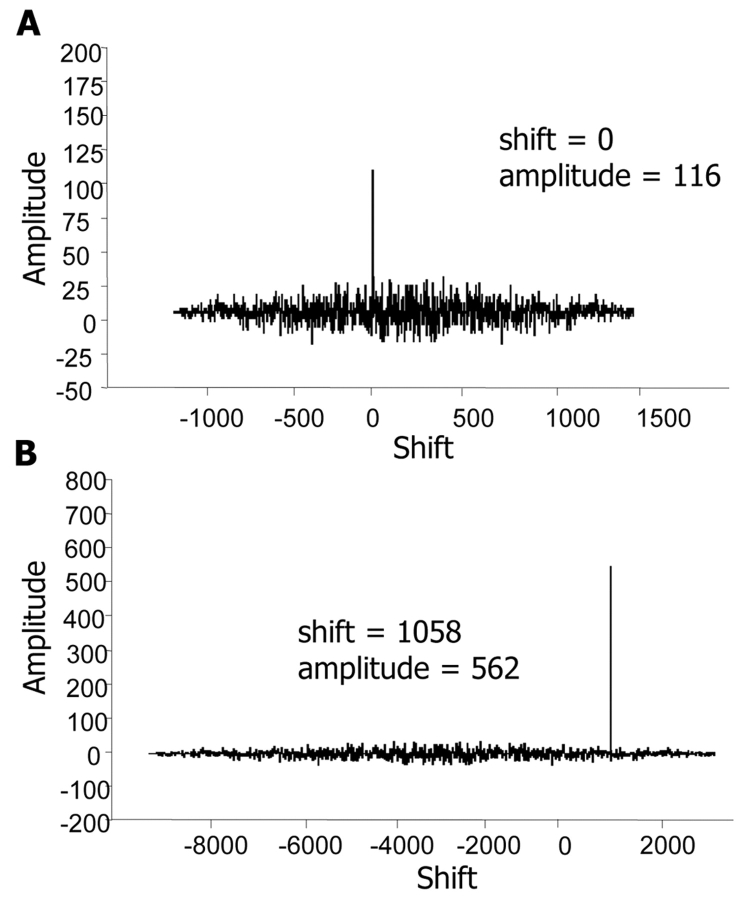
Finally, the nucleophosmin/anaplastic lymphoma kinase (NPM/ALK) fusion protein is associated with anaplastic large-cell lymphomas (ALCLs). A characteristic chromosomal translocation, t(2:5), results in the 3′ half of ALK on chromosome 2 being fused to the 5′ part of NPM from chromosome 5.21 Figure 3A presents a cross-correlation plot of the amino acid residues in the NPM protein against the fusion protein. Figure 3B presents a cross-correlation plot of the ALK protein against the fusion protein. The peaks in the cross-correlation plots are consistent with the position and sequence lengths of the fused protein sequence.
FIGURE 3.
Real part of cross-correlation function for the alignment of DNA sequences for the genes coding for (A) the NPM protein against the NPM-ALK fusion protein, and (B) the ALK protein against the NPM-ALK fusion protein. The amplitude and shift of peaks in the cross-correlation plots were consistent with the position and lengths of the fused protein sequence.
Notably, this cross-correlation alignment can harness the power of fast Fourier transform (FFT).22 Using FFT benchmarks, we estimate a computation time of 200 μsec to cross-correlate two DNA strands of 500 nucleotide bases on a typical 1.5-GHz personal computer.23 Applying this to shotgun sequence scanning of a small genome of 1 million bases with a coverage of 5x, the processing time to compare all pairs of 500 nucleotide base sequences would be less than 3 h.
CONCLUSIONS
In summary, the use of cross-correlation and the fast Fourier transform is a powerful technique that can be applied to detect DNA sequence similarities. This approach is extremely robust and is able to find sequence similarities that are undetectable by other methods. Importantly, the method is computationally efficient when implemented with the FFT, with computational effort scaling as N log2(N), making this method potentially useful for large, computationally intensive tasks, such as database searching and shotgun sequencing.
When combined with partial sum plots, the method is capable of not only detecting the presence of sequence similarities, but also locating the positions of similar regions between two DNA sequences. Alignment by the cross-correlation algorithm has been demonstrated for a wide variety of applications, including point mutations, translocations, and internal tandem repeats. The algorithm would also be well suited for comparing DNA sequences from distantly related organisms, shotgun sequencing, and protein database searching. From a broader perspective, the use of digital signal-processing techniques, especially the FFT and filtering functions, may be widely applicable in alignment studies, and may lead to the development of a new breed of powerful and efficient sequence analysis tools for DNA and protein.
Acknowledgments
This work was supported by the ARUP Institute for Clinical and Experimental Pathology.
REFERENCES
- 1.Dayhoff MO, Eck RV, Park CM. Atlas of Protein Sequence and Structure, vol. 5. Washington, DC: National Biomedical Research Foundation, 1972:75–84.
- 2.Smith TF, Waterman MS. Identification of common molecular subsequences. J Mol Biol 1981;147:195–197. [DOI] [PubMed] [Google Scholar]
- 3.Needleman SB, Wunsch CD. A general method applicable to search for similarities in the amino acid sequences of two proteins. J Mol Biol 1970;48:442–453. [DOI] [PubMed] [Google Scholar]
- 4.Pearson WR, Lipman DJ. Improved tools for biological sequence comparison. Proc Natl Acad Sci USA 1988;85:1444–1448. [DOI] [PMC free article] [PubMed] [Google Scholar]
- 5.Pearson WR. Effective protein sequence comparison. Methods Enzymol 1996;266:227–258. [DOI] [PubMed] [Google Scholar]
- 6.Altschul SF, Gish W, Miller W, Myers EW, Lipman DJ. Basic local alignment search tool. J Mol Biol 1990;215:403–410. [DOI] [PubMed] [Google Scholar]
- 7.Altschul SF, Madden TL, Schaffer AA, Zhang J, Zhang Z, Miller W, et al. Gapped BLAST and PSI-BLAST: A new generation of protein database search programs. Nucleic Acids Res 1997;25:3389–3402. [DOI] [PMC free article] [PubMed] [Google Scholar]
- 8.Felsenstein J, Sawyer D, Kochin R. An efficient method for matching nucleic acid sequences. Nucleic Acids Res 1982;10:133–139. [DOI] [PMC free article] [PubMed] [Google Scholar]
- 9.Katoh K, Misawa K, Miyata T. MAFFT: A novel method for rapid multiple sequence alignment based on fast Fourier transform. Nucleic Acids Res 2002;30:3059–3066. [DOI] [PMC free article] [PubMed] [Google Scholar]
- 10.Rajasekaran S, Jin X, Spouge JL. The efficient computation of position-specific match scores with the fast Fourier transform. J Comput Biol 2002;1:23–33. [DOI] [PubMed] [Google Scholar]
- 11.Siegel AF, van den Engh G, Hood L, Trask B, Roach JC. Modeling the feasibility of whole genome shotgun sequencing using a pairwise end strategy. Genomics 2000;68:237–246. [DOI] [PubMed] [Google Scholar]
- 12.Sasaki T, Burr B. International rice genome sequencing project: The effort to completely sequence the rice genome. Curr Opin Plant Biol 2000;3:138–141. [DOI] [PubMed] [Google Scholar]
- 13.Storm CR, Sonnhamer EL. Comprehensive analysis of orthologous protein domains using the HOPS database. Genome Res 2003;13:2352–2362. [DOI] [PMC free article] [PubMed] [Google Scholar]
- 14.Yap YL, Zhang XW, Danchin A. Relationship of SARS-CoV to other pathogenic RNA viruses explored by tetranucleotide usage profiling. BMC Bioinformatics 2003;4;43. [DOI] [PMC free article] [PubMed] [Google Scholar]
- 15.Giladi R, Walker MG, Wang JZ, Volkmuth W. SST: An algorithm for finding near-exact sequence matches in time proportional to the logarithm of the database size. Bioinformatics 2002;18:873–877. [DOI] [PubMed] [Google Scholar]
- 16.Press WH, Teukolsky SA, Vetterling WT, Flannery BP. Numerical Recipes in C. The Art of Scientific Computing. 2nd ed. New York: Cambridge University Press, 1992:545, 546.
- 17.Abu-Duhier FM. Genomic structure of Human flt3: Implications for mutational analysis. British J Haematol 2001;113:1076–1089. [DOI] [PubMed] [Google Scholar]
- 18.Borkhardt A, Repp R, Haupt E, Brettreich S, Buchen U, Gossen R, et al. Molecular analysis of MLL-1/AF4 recombination in infant acute lymphoblastic leukemia. Leukemia 1994;8:549–553. [PubMed] [Google Scholar]
- 19.States DJ, Boguski MS. Sequence analysis primer. In Gribskov M, Devereux J (eds): Sequence Analysis Primer. New York: Stockton Press, 1991:96.
- 20.States DJ, Botstein D. Molecular sequence accuracy and the analysis of protein coding regions. Proc Natl Acad Sci USA 1991;88:5518–5522. [DOI] [PMC free article] [PubMed] [Google Scholar]
- 21.Morris SW, Kirstein MN, Valentine MB, Dittmer KG, Shapiro DN, Saltman DL, et al. Fusion of a kinase gene, ALK, to a nucleolar protein gene, NPM, in non-Hodgkin’s lymphoma. Science 1994;263:1281–1284. [DOI] [PubMed] [Google Scholar]
- 22.Press WH, Teukolsky SA, Vetterling WT, Flannery BP. Numerical Recipes in C. The Art of Scientific Computing. 2nd ed. New York: Cambridge University Press, 1992:504–509.
- 23.Frigo M, Johnson SG. The benchFFT Home Page. http://www.fftw.org/benchfft/.


