Abstract
This paper presents a multidimensional profile of the human serum proteome, produced by a two-dimensional protein fractionation system based on liquid chromatography followed by characterization with capillary electrophoresis (CE). The first-dimension separation was done by chromatofocusing over a pH range from 8.5 to 4.0, where proteins were separated by their isoelectric points (pI). In this dimension, fractions were collected based on pH. The first-dimension pI fractions were then resolved in the second dimension by high-resolution, reversed-phase chromatography with a gradient of trifluoroacetic acid (TFA) in acetonitrile and TFA in water. A selected protein fraction collected from the second dimension by time was characterized by CE for molecular-weight estimation and for presence of isoforms. Molecular-weight estimation was done by sodium dodecyl sulfate capillary gel electrophoresis, where proteins were separated in the range of 10,000–225,000 Da. Detection of isoforms was done by capillary isoelectric focusing over a pH range of 3–10. A selected second-dimension fraction that contained the putative serum iron–binding protein transferrin was analyzed by these two CE techniques for molecular-weight determination and the presence of isoforms. The combination of two-dimensional protein fractionation and CE characterization represents an advanced tool for proteomics.
Keywords: Proteomics, chromatography, capillary electrophoresis, capillary isoelectric focusing, capillary gel electrophoresis
An ultimate result of proteomics is the under-standing of complex biological systems, which can lead to new diagnostics and therapy. Serum is a widely studied proteome due to its extremely complex composition, easy availability, and the presence of known biomarkers, such as transferrin. Transferrin is a glycoprotein that is the principal iron transport in blood.1 Transferrin levels are used in the diagnosis, monitoring, and treatment of anemia. In this study, we present a multidimensional approach to proteome profiling where the serum is fractionated into intact proteins, followed by molecular characterization of a select fraction. Fractionation is done using an automated two-dimensional (2D) system based on liquid chromatography to separate proteins according to their pI and hydrophobic properties. The pH fraction containing the putative transferrin is subsequently analyzed by capillary electrophoresis (CE) as a third dimension for molecular-weight determination and characterization of isoforms.
MATERIALS AND METHODS
Preparation of the Serum Sample
Twenty milliliters of blood were drawn from an adult male. The blood sample was collected into 10-mL sterile vacutainer tubes (Becton, Dickinson, Franklin Lakes, NJ) without anti-coagulant present. The blood was left to clot for 30 min at room temperature, then centrifuged at 212 g for 45 min at 8°C. The serum supernatant was carefully removed, and centrifuged at 5000 g for 20 min at 8°C. The serum supernatant was removed, aliquoted, and frozen at −80°C. The protein concentration was determined by biuret assay to be 85.6 mg/mL.
Two-Dimensional Protein Fractionation
The intact serum proteins were fractionated by pI and hydrophobicity with an automatic 2D fractionation system, the ProteomeLab PF 2D (Beckman Coulter, Inc., Fullerton, CA). The chemistry components of this system include the start buffer (pH 8.5) and eluent buffer (pH 4.0) for the first dimension, a chromatofocusing column, and a high-performance reversed-phase column.
An aliquot of 30 μL (2.6 mg protein) of serum was brought to 800 μL using the start buffer and injected into the 2D protein fractionation system. The first-dimension separation was by chromatofocusing over a pH gradient from pH 8.5 to 4.0, which separates the proteins by pI at a flow rate of 0.2 mL/min at room temperature. After the pH gradient was completed, the column was washed with 1 M sodium chloride to elute proteins with pI less than 4.00, followed by water to regenerate the column. Protein elution was monitored by absorbance at λ = 280 nm. Fractions were collected at 0.3 pH unit intervals in the pH gradient and at 5-min intervals outside of the pH gradient.
The first-dimension fractions were then separated in a second dimension that used a high-performance reversed-phase column with a flow rate of 0.75 mL/min at 50°C. A gradient was formed using 0.1% trifluoroacetic acid (TFA; J.T. Baker, Phillipsburg, NJ) in water and 0.08% TFA in acetonitrile (Burdick & Jackson, Muskegon, MI). From each pI fraction, 200 μL was injected onto the second-dimension column. The proteins were detected by absorbance at λ = 214 nm. Fractions were collected from the second dimension in 15-sec intervals, 187.5 mL per fraction, from 14 to 22 min. The resulting 32 fractions were collected in a standard 96-microwell plate (Nunc, Rochester, NY).
Third-Dimension CE Characterization
Sample Preparation for SDS CGE
Approximately 12 μg of protein from the second-dimension fraction, which contained the retention time of 15.9 min from the pH 6.16–6.45 fraction of human serum, and 50 μg of human transferrin standard (Sigma-Aldrich, St. Louis, MO) were analyzed. The human serum fraction was concentrated in a SpeedVac SC110 (Savant, Holbrook, NY) into a translucent pellet. The wells containing the protein sample were denatured in 0.9% SDS and 4% β-mercaptoethanol for 3 min at 100°C. The transferrin standard and the molecular-weight size standards (Beckman Coulter, Inc.), 10–225 kDa, were treated under the same conditions. The molecular-weight size standards were used to create a calibration curve by plotting the log molecular weight of the standards versus 1/mobility. This curve was used to estimate the molecular weight of the protein samples. A 10-kDa internal standard was added to the samples and transferrin standard for SDS-CGE analysis. The final protein concentration of the sample was 240 μg/mL for SDS-CGE analysis.
SDS-CGE Separation Method
The ProteomeLab PA 800 (Beckman Coulter Inc.), equipped with photo diode array detector set at λ = 220 nm, was used for the SDS-CGE analysis. Bare-fused silica capillary, 50 μm ID × 30.2 cm (20.2 cm effective length to detector) was used for the separation. Separation was performed at constant voltage of 15 kV with reverse polarity in SDS–molecular weight gel buffer. The current was stable at −27 μA. Capillary was thermostated at 25°C. Sample was electrokinetically introduced at 5 kV for 20 sec.
Sample Preparation for CIEF
As a reference, 25 μg of human transferrin standard was solubilized in the chromatographic start buffer and 200 μL was run on the second dimension of the 2D protein fractionation system. The same method of collection as the serum samples was used for the standard. Approximately 27 μg of protein from fractionated human serum as described for SDS CGE and 25 μg of human transferrin standard were concentrated in a speed vacuum centrifuge. Both samples were then buffer exchanged with 400 μL of Type I water, using Ultrafree-MC, 30 kDa MW cutoff filters (Millipore, Billerica, MA). The samples were concentrated to 2–3 μL. Twenty-five microliters of ampholyte/marker gel mixture were added to the sample. The CIEF markers, ribonuclease A (RA) (Beckman Coulter Inc.) (pI 9.45), and glucose oxidase (GO) (pI 4.2) (Sigma-Aldrich), were selected based on the estimated pI value of human transferrin from SWISS-PROT, which was 6.14–6.63. These standards were used to create a calibration of pI vs. migration time for the estimation of the pI of unknown samples.
CIEF Separation Method
The ProteomeLab PA 800 with a detection at λ = 280 nm was used for CIEF. During the separation, the capillary was thermostated at 20°C. A neutral coated capillary, 50 μm I.D. × 30.2 cm (20 cm effective length to detector), was used for the separation. Prior to introduction of the sample/ampholyte gel mixture, the capillary was rinsed with anolyte solution and water to clean the capillary surface and then filled with sample/ampholyte mixture at 30 PSI for 1.50 min. The focusing step was performed for 6 min at constant voltage of 15 kV with normal polarity, and 0.5 PSI pressure was applied at the anode and cathode ends of the capillary. The mobilization step was performed for 39 min at a constant voltage of 21 kV with normal polarity, and 0.5 PSI pressure was applied at the anode side of the capillary.
RESULTS AND DISCUSSION
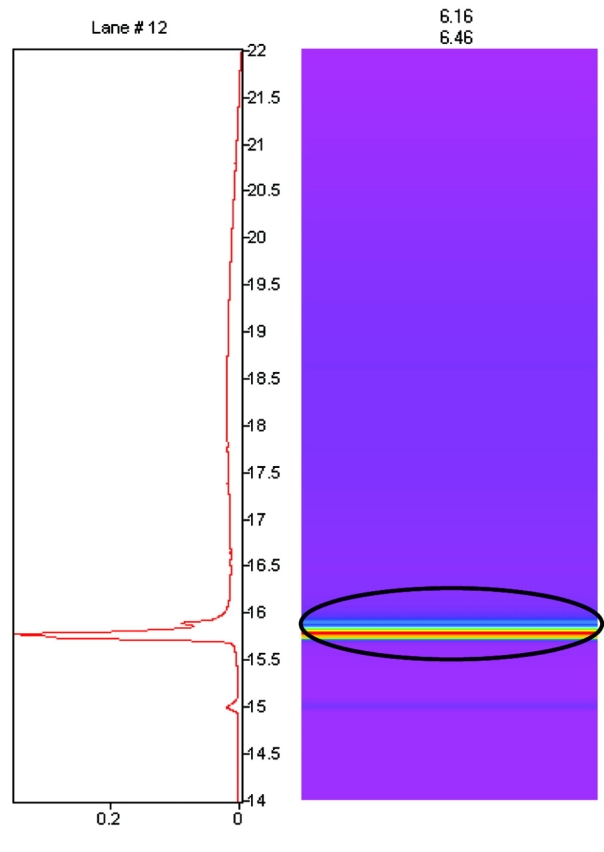
Figure 1 shows the 2D map of the pH fraction 6.16–6.45 from human serum. The circled protein band represents the absorbance intensity of the second-dimension separation of this pH fraction. The human transferrin standard run on the 2D protein fractionation system was eluted with a pI of 6.3–6.4 and had a second-dimension retention time of 15.9 min (data not shown), the same as the intense peak with this retention time shown in Figure 1. In addition, treatment of this serum sample with anti-transferrin results in the disappearance of this peak. These observations putatively identify the dominant peak in Figure 1 as human transferrin.
FIGURE 1.

The pI/hydrophobicity map of the pH 6.16–6.45 fraction from human serum. Shown is the second dimension for this pH fraction graphically (right) and as a chromatogram (left). At the top of the lane are the starting and ending pH measured for the first-dimension fraction. The circled peak is putatively identified as transferrin.
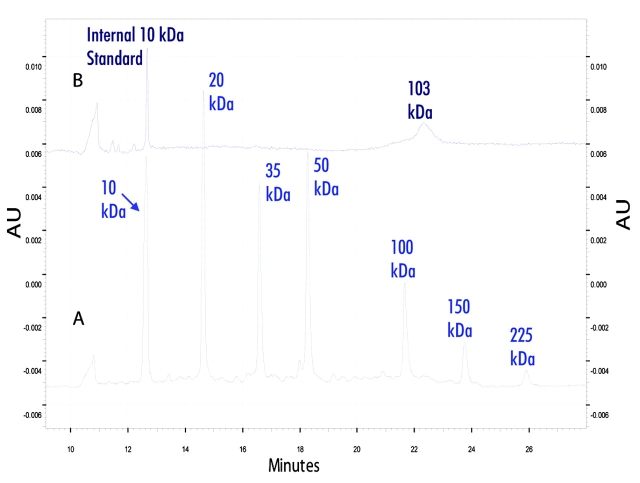
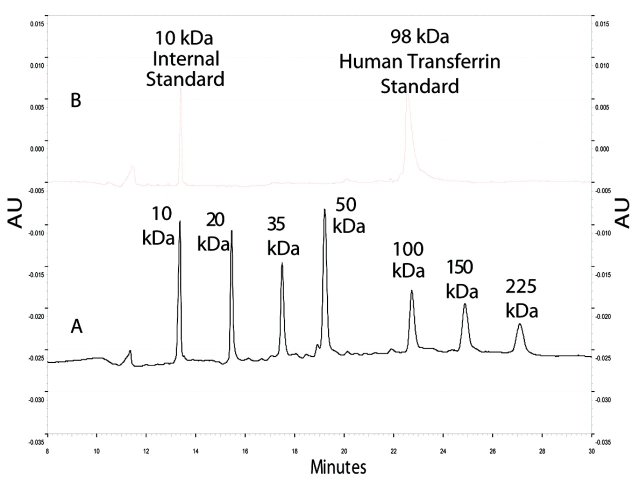
After 2D protein fractionation, the putative transferrin band from human serum and the human transferrin standard at 15.9 min retention time were analyzed further with SDS-CGE (Figures 2 and 3, respectively). The calibration curve with the molecular-weight standards demonstrated good linearity, with a goodness of fit of R2 greater than 0.99. The apparent molecular weight of the intact protein from the human serum fraction was 103 kDa. The apparent molecular weight of the human transferrin standard was estimated at 98 kDa. These molecular-weight values were similar, and the 5-kDa difference was presumably due to the variations observed in the glycosylation of the transferrin standard compared to the transferrin in the serum sample (Knudson V, Betgovargez E, Simonian MH, unpublished results) and the effect of the difference in glycosylation on SDS-CGE.
FIGURE 2.
Electropherograms of SDS-CGE molecular-weight analysis of the intact protein fraction. A is the electropherogram of molecular-weight standards and B is the serum fraction containing the putative transferrin at 103 kDa with internal 10-kDa standard.
FIGURE 3.
Electropherograms of SDS-CGE molecular-weight analysis of standards. A is the electropherogram of molecular-weight standards and B is human transferrin standard at 98 kDa with internal 10-kDa standard.
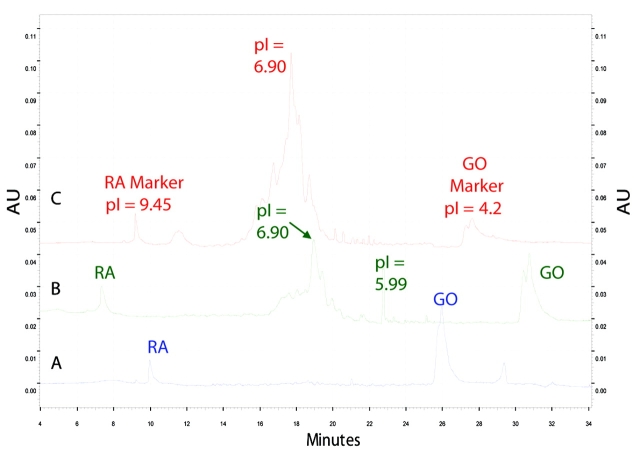
The same second-dimension serum fraction and human transferrin standard were separately analyzed by CIEF (Figure 4). The electropherogram patterns were similar for both the serum sample with the putative transferrin and transferrin standard (Figure 4B and 4C, respectively). The patterns for both the serum sample and the transferrin standard have a broad range of pH for the main component, which indicates several isoforms. The isoforms are due to the known polymorphic variants of human transferrin.2 This demonstrates the resolving capability of CIEF. The protein peak at pI 5.99 was detected only in the serum fraction sample. This perhaps indicates the presence of another protein that has the same retention time and similar pI as transferrin on the 2D liquid chromatography system.
FIGURE 4.
Electropherograms of CIEF separation showing the different isoforms of transferrin. A are the standard markers ribonuclease A (RA, pI 9.45) and glucose oxidase (GO, pI 4.2), B is the serum fraction containing the putative transferrin and the markers RA and GO, and C is the human transferrin standard and the markers RA and GO.
In this study, multidimensional profiling of the human serum proteome utilized a 2D fractionation of the intact proteins followed by molecular-weight and isoform characterization by CE. For the fraction that contained transferrin, the apparent molecular weight was estimated by SDS-CGE. The isoforms of the transferrin fraction and transferrin standard were resolved by CIEF. The variations of human serum transferrin glycosylation—specifically the amount of sialic acid residues—have clinical implications. Patients with cancer and patients with rheumatoid arthritis show an increased level of sialic acid residues for transferrin, whereas patients with heavy alcohol consumption have an absence of sialic acid.3–6 Analysis of intact proteins from the combination of these two systems demonstrates an advanced tool for proteomics.
REFERENCES
- 1.Brutis AC, Ashwood RE. Tietz Textbook of Clinical Chemistry, 2nd ed. Philadelphia: WB Saunders, 1994: 711–713.
- 2.Douabin-Gicquel V, Soriano N, Ferran H, Wojcik F, Palierne E, Tamim S, et al. Identification of 96 single nucleotide polymorphisms in eight genes involved in iron metabolism: Efficiency of bioinformatic extraction compared with a systematic sequencing approach. Hum Genet 2001;109:393–401. [DOI] [PubMed] [Google Scholar]
- 3.van Eijk HG, van Noort WL, de Johg G, de Jong G. Human serum sialo transferrins in disease. Clinica Chimica Acta 1987;165:141–145. [DOI] [PubMed] [Google Scholar]
- 4.Storey EL, Mack U, Anderson GJ, Powell LW, Halliday JW. Desialyated transferrin as a serological marker of chronic excessive alcohol ingestion. Lancet 1987;329:1292–1294. [DOI] [PubMed] [Google Scholar]
- 5.Matsumoto K, Maeda Y, Kato S, Yuki H. Alteration of asparagine-linked glycosylation in serum transferrin of patients with hepatocellular carcinoma. Clinica Chimica Acta 1994;224:1–8. [DOI] [PubMed] [Google Scholar]
- 6.Feelders RA, Vreugdenhill G, de Jong G, Swaak AJ, van EijK HG. Transferrin microheterogeneity in rheumatoid arthritis. Relation with disease activity and anemia of chronic disease. Rheumatol Int 1992;12:195–199. [DOI] [PubMed] [Google Scholar]


