

Abstract
Protein identification plays an important role in today’s academic and industrial proteomic research. Commonly used methods for the separation of proteins from complex samples include liquid chromatography (e.g., ion exchange, reversed-phase, hydrophobic interaction), or types of gel electrophoresis (e.g., 1d and 2d PAGE). Relevant proteins separated in the latter way are often cut out, cleaved with trypsin “in gel,” and the resulting peptide mixtures combined with matrix and spotted onto a target plate for matrix-assisted laser desorption/ionization time-of-flight mass spectrometry (MALDI-ToF-ms) analysis. Subsequently, proteins can be identified by comparison of the resulting peptide mass fingerprints against different databases.1 since the success of protein identification can be enhanced by the desalting and concentration of the samples, an innovative C18-membrane was incorporated into a microspin column (Vivapure C18 micro spin column, Vivascience AG, Hannover, Germany) to analyze its performance for sample preparation prior to MALDI-ToF-ms. Rapid concentration of single or multiple 200-μl volumes through an available membrane only 2 mm in diameter allowed for analysis of very dilute samples. We observed the successful and rapid desalting of urea-containing protein samples at 100 fmol/μl up to a mass of ~70 KDA and the concentration of digest peptides from a solution of 1 fmol/μl using C18-membrane technology.
Keywords: Sample preparation, in-gel digestion, MALDI-ToF, desalting and concentration, C18
In the post-genomic era, much effort has been invested in the field of proteomics to identify new biomarkers or targets for drug discovery. A challenging task of all proteomic research is therefore the preparation of protein samples from very complex mixtures of biomolecules—e.g., serum, urine, or cell/tissue lysates. For analysis and identification of specific proteins by mass spectrometry, samples first have to be fractionated by various strategies. Often in the past, liquid chromatography has been the approach of choice. Two-dimensional separations based on orthogonal chemistries (e.g., gel filtration followed by ion exchange chromatography steps, or ion exchange followed by reverse-phase chromatography steps) would be used to reduce the complexity of protein mixtures. Such approaches are now playing an important role in “top-down” proteomics, where analysis of the intact molecule is carried out.2
A separation step more common to proteomic research is two-dimensional polyacrylamide gel electrophoresis (2D PAGE).3 Here again, orthogonal approaches are applied to separate proteins according to their isoelectric point and molecular weight. This high-resolution technique yields focused spots of protein, which can be cut out and the protein-containing gel plug digested with trypsin. The digest solution often contains dilute peptides among interfering buffer components or other contaminants, which reduce the high sensitivity of analysis by MALDI-ToF-MS. Similarly, during solution-state digestion of proteins it is necessary to reduce and alkylate samples to break and prevent reformation of cross-links between cysteine residues. This usually improves digestion, but the reaction has the drawback of needing to be carried out in high concentrations of denaturant, such as 8 M urea.4 Accepted methods to remove aqueous contaminants are usually reversed-phase C18 chemistries in the form of bonded silica. Peptides in aqueous solution bind to C18 derivatized surfaces through hydrophobic interactions, allowing small interfering molecules (salts, buffers, and chaotropes) to be washed off. The peptides are then eluted with various organics compatible with the ensuing analytical technique. Several products are available where the C18 material is embedded into a small pipette tip. Minimizing the bed volume allows for the elution of bound peptides in low microliter volumes. However, these devices often have limitations. For example, volumes that can be loaded are limited by the tip size, or the back pressure imposed by the packing material; pipettors cannot apply large pressures. If binding efficiency of the stationary phase is also low, the need to pass the same sample through the device multiple times introduces repetitive pipetting steps, though liquid-handling robots can ease this. Here we show examples of the capabilities of a new C18 membrane, in a microspin column format, for the fast desalting and concentration of low-level samples of peptides. Though C18 stationary phases are not normally considered appropriate for large proteins, data are presented here to the contrary, due to the unique binding characteristics of the membrane. Furthermore, the configuration and composition of the device overcomes the more conventional problems mentioned above by utilizing centrifugal force and large surface areas while maintaining small bed volumes to minimize standard handling issues.
MATERIALS AND METHODS
Preparation of Standard Gel Plugs and Tryptic Digestion
A 12%, 1 mm thick polyacrylamide gel was poured, incorporating a known quantity of bovine serum albumin (BSA) (Sigma, St. Louis, MO) as quantified by amino acid analysis. The gel was allowed to polymerize for 24 h and then fixed in 10% acetic acid, 40% methanol in water for 1 h. One-millimeter gel plugs that were calculated to contain a nominal concentration of 100 fmol BSA were excised. These were washed, reduced with dithiothreitol (DTT), S-alkylated with iodoacetamide, then digested in-gel with trypsin (sequencing grade modified trypsin, Promega, Madison, WI) using an Investigator ProGest protein digestion station (Genomic Solutions, Huntingdon, UK). These resulted in final digest volumes of ~20 μL, which were diluted to 100 μL with 0.1% formic acid. One-half microliter of this solution was used directly for MALDI-ToF-MS analysis, and the remaining sample was used for cleanup with the Vivapure C18 Micro Spin columns.
SDS-PAGE for Analysis of Reduced and Alkylated Proteins
Protein samples were lyophilized after elution from the Vivapure C18 devices and redissolved in lithium dodecyl sulphate (LDS) sample buffer according to the manufacturer’s instructions before analysis under non-reducing conditions on 12% NuPAGE precast bistris gels using an MES buffer (Invitrogen Ltd., Paisley, UK). Gels were stained with Sypro Ruby (Molecular Probes, Inc., Eugene, OR) and were imaged with a ProXpress Multi-wavelength fluorimager (PerkinElmer LAS Ltd., UK).
Reduction and Alkylation of Proteins
Four proteins, covering the mass range ~15–65 kDa and containing cysteine residues involved in crosslinks, were separately studied: hen egg lysozyme (Swiss-Prot database entry LYC_CHICK), bovine tryp-, trypsinogen (TRY1_BOVIN), chicken ovalbumin (OVAL_, CHICK), and BSA (ALBU_BOVIN), all supplied by Sigma (St. Louis, MO). One hundred pmol/μL stock solutions were made up in water, 0.1% trifluoroacetic acid (TFA). Ten microliters of each stock was added to 200 μL 10 M urea, 0.25 M Tris-HCl (pH 8.0). Twenty microliters of 87 mM DTT in 100 mM Tris-HCl (pH 8.0) was added and the four samples were incubated at 50°C for 30 min. The samples were cooled to 18°C and 20 μL 200 mM iodoacetamide in 100 mM Tris-HCl (pH 8.0), was added. The samples were incubated in the dark for 15 min at 18°C. For the non-alkylated samples, DTT and iodoacetamide were omitted and just the 100 mM Tris-HCl was added. The final concentration of urea was 8 M, with 4 pmol/μL of protein in each sample. These samples were diluted to 0.1 pmol/ μL and 2 M urea before cleanup with the Vivapure C18 Micro Spin device ready for MALDI-ToF-MS and SDS-PAGE analysis.
Sample Preparation and Cleanup with the Vivapure C18 Micro Spin Column
All work was carried out on a Heraeus BioFuge Pico (Kendro Laboratory Supplies, Osterode, Germany). The membrane was washed with 200 μL 100% acetonitrile/0.1% TFA by centrifugation for 1 min at 400 g, the flow-through discarded, and the step repeated. The membrane was equilibrated with 200 μL 0.1% TFA in water by centrifugation for 2 min at 400 g, the flow-through discarded, and the step repeated. The sample was loaded and centrifuged for 2 min at 400 g. The flow-through was discarded. Bound sample was washed with 200 μL of 0.1% TFA by centrifugation for 1 min at 400 g, the flow-through discarded, and the step repeated. When urea samples were used, this step was repeated four times. Aqueous content was reduced by centrifugation at 13,000 g for 30 sec. The flow-through was discarded. A PCR tube was attached to the bottom of the spin column and both inserted into a 2-mL tube. Optimal and minimal elution volumes were determined by binding a 1-pmol load of standard peptides angiotensin and bombesin (Sigma, St. Louis, MO) and eluting with 1, 2, 3, or 4 μL of 50% acetonitrile/0.1% TFA and α-cyano-4-hydroxycinnamic acid (10 mg/mL). Three microliters of a solution of 50% acetonitrile/0.1% TFA and α-cyano-4-hydroxycinnamic acid (10 mg/mL) were loaded onto the membrane for peptides and 5 μL 90% acetonitrile/0.1% TFA for proteins and centrifuged at 400 g for 1 min and another 30 sec at 13,000 g.
MALDI-ToF Mass spectrometry
One-half microliter of the peptide samples were spotted under the same conditions (dried droplet) onto a MALDI target. One-half microliter of the protein samples were spotted using sinapinic acid as matrix. The peptide samples were analyzed with a Reflex III MALDI-ToF and the protein work with an Ultraflex MALDI-ToF/ToF (both Bruker Daltonics UK Ltd., Coventry, UK). The peak lists produced were searched against the SPtrEMBL database using Mascot (Matrix Science Ltd., London, UK).5
RESULTS
Initially, the elution volume was investigated to obtain the highest signal intensities for different peptides, and therefore highest recovery. A 1-pmol load of angiotensin II (1046 Da) and bombesin (1619 Da) was used and eluted with 1, 2, 3, and 4 μL of 50% acetonitrile/ 0.1% TFA and α-cyano-4-hydroxycinnamic acid (10 mg/mL). Signal intensities were compared for each elution volume and summarized (Figure 1). Elution with 2 μL rendered the best signal intensities.
FIGURE 1.

Elutions with 1–4 μl of 50% acetonitrile/0.1% TFA and α-cyano-4-hydroxycinnamic acid versus ion count for angiotensin II (1046) and bombesin (1619) for 1-pmol load.
We investigated the sample preparation of a standard digest of BSA with a nominal concentration of 1 fmol/μL. The sample was mixed (1:1) with matrix in 50% acetonitrile/0.1% TFA and 0.5 μL spotted at nine positions on a stainless steel MALDI target. Only one of the nine spots gave signals that could be analysed (Figure 2A). One hundred microliters of the BSA digest was used for preparation with the Vivapure C18 Micro Spin columns. One-half microliter of the eluate was spotted six times onto a target to give dried droplet preparations. All spots gave very consistent results using the Vivapure C18 device (Figure 2B), in contrast to the preparations without.
FIGURE 2.
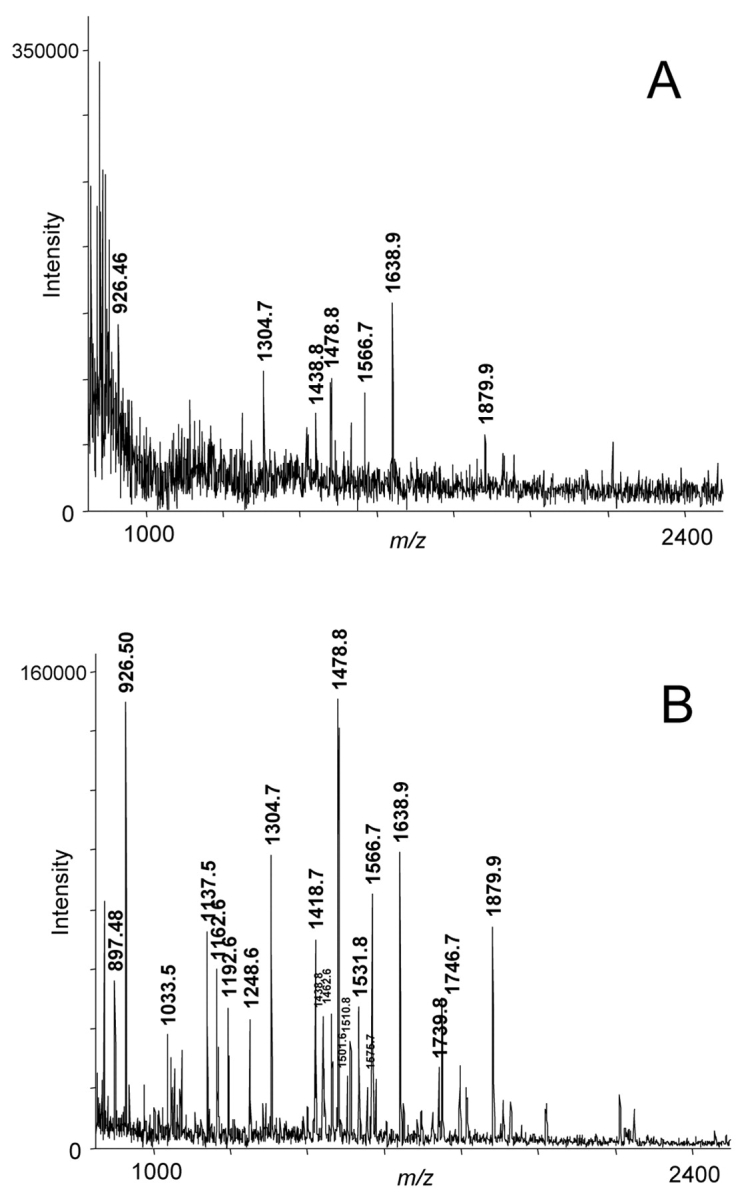
A: MALDI spectrum of 0.5 μl of a <1 fmol/μl BSA digest. B: spectrum of 0.5 μl of the 3-μl eluate after preparation with the Vivapure C18 device. The annotated signals belong to BSA peptides.
The obtained peak lists were used for Mascot’s mass fingerprint search, and the results were compared (Table 1). A significant improvement of all parameters was seen after sample preparation with Vivapure C18 Micro Spin columns.
TABLE 1.
Mascot Scores, Searched and Matched Peptides, and Sequence Coverage for BSA, Before and After Sample Preparation with the Vivapure C18 MicroSpin Column
| Original sample | VP C18 | |
| Mascot score | 111 | 251 ± 35 |
| Searched peptides | 7 | 26 ± 1 |
| Matched peptides | 7 | 20 ± 4 |
| Sequence coverage | 14% | 34 ± 3% |
Insulin (5.7 kDa), ubiquitin (8.6 kDa), cytochrome c (12.4 kDa), hen egg lysozyme (14.3 kDa), myoglobin (17.0 kDa), trypsinogen (24.0 kDa), carbonic anhydrase (29.0 kDa), enolase (46.7 kDa), and BSA (66.4 kDa) were all used to test the binding and recovery of proteins from the C18 membrane. Notably “sticky” proteins were recovered easily (i.e., BSA, Figure 3B; ovalbumin, Figure 3A; and cytochrome C, data not shown). Further, the 4 cysteine-containing proteins, whether reduced and alkylated or in their denatured non-alkylated states in 2 M urea, were cleaned up with the C18 spin columns. Alkylation of BSA, ovalbumin, trypsinogen, and lysozyme was demonstrated by 1D SDS-PAGE (Figure 3A) and shown to be extensive, if not complete. The spectra for lysozyme (Figure 3C, D) show clearly the exact mass difference of 456 Da, obtained after alkylating the cysteine residues with iodoacetamide to give eight carboxyamidomethylcysteines. All together, these results demonstrate the successful binding and recovery of different proteins with the C18 membrane.
FIGURE 3.

A. Sypro Ruby–stained SDS-PAGE. +, sample treated with DTT and iodoacetamide, −, sample without treatment. B–D: MALDI spectra: BSA (B); lysozyme without (C) and with (D) alkylation after sample preparation with Vivapure C18 Micro Spin columns.
DISCUSSION
The quality of MALDI mass spectra is highly dependent on the sample preparation step prior to measurement. This includes the methods of crystallizing samples on the targets, so-called dried droplet or thin-layer approaches, for which each laboratory has its own minor variations. As generally agreed, the removal of contaminating salts and concentration of samples can ease and improve analysis considerably.
In addition, minimizing losses is very important. Losses can occur due to binding to the plastics the samples are contained in and to any device and stationary phase that might be used for sample cleanup and/or concentration. If losses are large, the concentration step can be redundant. The novel membrane of the Vivapure C18 device has low nonspecific binding properties and when incorporated into a large volume device combines this advantage with speed. Since mass transfer effects contain a time element, losses to plastics will be limited if diffusion is not given a significant chance to occur. The production of a high-quality spectrum from 100 μL of a 1-fmol/μL standard digest of BSA shows that high-speed processing of large volumes of dilute sample can be carried out. Only 1 min of centrifuge time was required to bind these peptides safely to the membrane, ready for washing and elution. This easy desalting and concentration of a standard digestion of BSA resulted in improved mass spectra, showing more signals with highly reduced background (Figure 2A, B). Consequently, the resulting mass fingerprint data displayed increased Mascot scores and sequence coverages (Table 1).
Moreover, being able to process large volumes of sample does not mean elution volumes must be high. Using a membrane gives a large surface area, but a very low bed volume. Combining this with centrifugal force means small amounts of eluent can be applied and recovered. To achieve the maximum concentration effect, elution with 2 μL appears best, but since nearly the same peak intensities are achieved with a 4-μL elution volume, total yields may be increased with greater volumes (Figure 1). Theoretically, loading 200 μL onto a device and eluting with a volume of 2–4 μL, can result in a 50- to 100-fold concentration. In this study, the minimal volume for elution was not used routinely, as this requires a high working speed when processing many samples in parallel in order to avoid evaporation of eluate and inconsistent small volumes. Also, it should be noted that a fixed angle rotor was used in the centrifuge for these experiments. This biases binding to only part of the membrane if the device orientation is kept consistent. Swinging-bucket rotors may offer improvements in terms of greater stability of elution with lower volumes.
Several products are available, most using C18 stationary phases incorporated into pipette tips or spin columns. However, repetitive pipetting steps lead to delays in sample processing. The device used here offers significant advantages, including easy parallel processing and the possibility of multiple additions of sample without much more effort to process larger than 200-μL volumes if necessary. Furthermore, it no longer limits the operator to reactions carried out in minimal volumes. Dilution of highly concentrated reagent mixtures as used in chemical modification reactions should now be feasible even where low sample amounts are present, subject to maintaining the chemical integrity of the membrane.
The broad mass working range of the membrane was demonstrated by using protein and peptide samples with molecular weights from less than 1 kDa up to approximately 70 kDa. Elution of fully unfolded, non-crosslinked BSA from a C18 membrane (Figure 3B) appears somewhat unusual, as this is normally assigned to C4 or C8 phases. Thus, the membrane coupled with C18 chemistry is very flexible. This is an encouraging achievement and illustrates the potential use of these devices in top-down proteomics approaches where intact proteins are analyzed without digestion. For instance, in “in source decay” sequencing, a form of top-down proteomics, it has been noted that disulphide cross-links are inhibitory to fragmentation.6 The ease of handling protein samples in urea during a simple but ubiquitous reaction, alkylation, used in so many guises within protein analysis, is clearly demonstrated here.
In summary, this C18 spin column offers a very fast and effective tool to simultaneously desalt and concentrate up to 200 μL (or multiples thereof) of highly dilute peptide or urea-containing protein solutions, in a single pass, from any source—e.g., 2D-PAGE, chromatographic methods, or directly from biological samples.
REFERENCES
- 1.Pappin DJ. Peptide mass fingerprinting using MALDI-ToF mass spectrometry. Methods Mol Biol 1997;4:165–173. [DOI] [PubMed] [Google Scholar]
- 2.Nemeth-Cawley JF, Tangarone BS, Rouse JC. “Top Down” characterization is a complementary technique to peptide sequencing for identifying protein species in complex mixtures. J Proteome Res 2003;2:495–505. [DOI] [PubMed] [Google Scholar]
- 3.Gorg A, Weiss W, Dunn MJ. Current two-dimensional electrophoresis technology for proteomics. Proteomics 2004;4:3665–3685. [DOI] [PubMed] [Google Scholar]
- 4.Stone KL, Williams KR. Enzymatic digestion of Proteins and HPLC peptide isolation. In Matsudaira P (ed): A Practical Guide to Protein and Peptide Purification for Microsequencing, 2nd ed., San Diego: Academic Press, 1993:43–69.
- 5.Perkins DN, Pappin DJ, Creasy DM, Cottrell JS. Probability-based protein identification by searching sequence databases using mass spectrometry data. Electrophoresis 1999; 20:3551–3567. [DOI] [PubMed] [Google Scholar]
- 6.Suckau D, Resemann A. T3-sequencing: Targeted characterization of the N- and C-termini of undigested proteins by mass spectrometry. Anal Chem 2003;75:5817–5824. [DOI] [PubMed] [Google Scholar]