Abstract
Variability is a major complicating factor in analysis by two-dimensional gel electrophoresis. Improvements in methodologies have focused on improving individual gel quality rather than reproducibility. We homogenized rat cardiac tissue and rehydrated using a matrix of buffers to determine the optimal sample conditions. Six buffers were used to solubilize the proteins. Solubilized proteins were separated by isoelectric focusing using four buffers. Gels were run in triplicate to assess the method of preparation yielding the least variability. Number of spots and variability were different between conditions. Proteins solubilized in a buffer containing 5 M urea, 2M thiourea, 2% CHAPS, 2% SB 3–10, ampholytes, DTT, and protease inhibitors and focused in a buffer containing 9 M urea and 4% NP40 had the lowest coefficient of variation. Variability was compared across isoelectric point ranges and was different. Minimizing technical variability in two-dimensional polyacrylamide gel electrophoresis is critical to identify differences between conditions. Sample preparation should be optimized to minimize variability as well as to maximize the number of spots seen.
Keywords: Reproducibility, variability: two-dimensional gel electrophoresis, heart
The goal of expression proteomics is to identify proteins that are present in different abundance between sets of samples. A number of approaches are available, but the most widely used is two-dimensional gel electrophoresis.1,2 The ability of this technique to separate intact proteins with high resolution and to quantitate proteins and separate many post-translational modifications has not yet been matched by newer techniques. However, variability between groups of samples makes analysis difficult.3–6 In addition to true differences between groups, biological variability occurs between samples in the same group. Variability that occurs during the sample preparation step can be caused by incomplete solubilization or presence of substances that affect separation such as salts or DNA, and result in changes in migration of proteins. Variability can also be introduced during the focusing and electrophoresis stage due to differences in protein hydration into the immobilized pH gradient (IPG) strip, current flow through the IPG strip, reduction and alkylation of proteins, and equilibration of the IPG strip after focusing. Problems during the second-dimension sodium dodecyl (lauryl) sulfate–polyacrylamide gel (SDS-PAGE) include incomplete entry of proteins into the gel and current leak. A final source of variability is the visualization of protein spots and the identification of what is a spot and what are the spot boundaries. While image analysis and informatic approaches can attempt to correct for the variability,7,8 reducing it experimentally is preferable. In this study we have optimized a protocol for separating proteins on a 2D gel and quantified the variability among replicate samples. The goal of these studies was to find a combination of buffers that reduced the variability of 2D electrophoresis.
MATERIALS AND METHODS
Rats were sacrificed according to protocols approved by the MUSC Institutional Animal Care and Use Committee. Hearts were perfused with saline and the left ventricular free wall was dissected free. Samples were frozen in liquid nitrogen and stored at −80°C until used. Frozen tissue was placed in a BioPulverizer with additional liquid nitrogen and ground to a powder.
As an initial approach to identify the method that produced the most and best-focused spots, a matrix of preparation techniques was used consisting of six solubilization buffers and four focusing buffers. This matrix is similar to that previously used by Stanley et al. to optimize the appearance of individual gels.9 The complete preparation methods can be found in the MI2DG protocol database at www.agml.org. Rat heart left ventricle (100 mg) was ground in a tissue homogenizer in 200 μL of each of the following buffers: (1) 9 M urea, 4% NP40, 0.2% Biolytes and 1% dithiothreitol (DTT); (2) 5 M urea, 2 M thiourea, 2% CHAPS, 2% SB 3–10, 0.2% Biolytes and 1% DTT; (3) 7 M urea, 2 M thiourea, 2% CHAPS, 1% ASB 14, and 0.2% Biolytes; (4) 10 mM Tris·HCl, 5 M urea, 2M thiourea, 2% CHAPS mixed in a 50:50 mixture of 2,2,2-trifluoroethanol (TFE) and ddH2O, 0.2% Biolytes, and 1% DTT; (5) 5 M urea, 2 M thiourea, 2% SDS and 10% glycerol, 0.2% Biolytes, and 1% DTT; or (6) 60 mM Tris (pH 6.8), 2% SDS, and 10% glycerol. All homogenization buffers except number 6 contained leupeptin (1 μM), Pepstatin (1 μM), Aprotinin (0.3 μM), EDTA (2.5 mM), sodium orthovanadate (0.2 mM), sodium fluoride (50mM), PMSF (2.5 mM), and Benzonase (50U/100 μL). The lysate was then sonicated on ice with three 2-sec pulses with a 3-sec rest between pulses. The sonication was repeated every 15 min for 1 h, after which the lysates were centrifuged for 5 min at 750 g at 4°C to remove debris. Protein concentration was measured using an RCDC protein assay (Bio-Rad). Protein concentrations were typically between 7 and 10 mg/mL. Protein (200 μg) from each of the six preparation methods was added to each of buffers 1–4 without protease inhibitors or Benzonase. After a 30-min 100,000 g centrifugation, the final volume of 185 μL was used to rehydrate an 11-cm IPG strip (pH 4–7). Proteins were focused in a Protean IEF cell (Bio-Rad) for 100,000 V-h with a maximum voltage of 8000 V and a maximum current of 50 μA/strip. After focusing, strips were equilibrated sequentially in buffers containing DTT and iodoacetamide, and separated by SDS-PAGE on an 8–16% gradient gel using a Criterion Doceca cell (Bio-Rad, Hercules, CA). Gels were washed with deionized water, fixed with 10% methanol/7% acetic acid, stained overnight in the dark with Sypro Ruby (Molecular Probes, Eugene, OR), destained in 10% methanol/7% acetic acid, and imaged on an FX Pro Plus fluorescent imager (Bio-Rad). Images were analyzed using PDQuest software version 7.1. Spots were automatically detected on all 24 images, followed by manual editing of spots to improve detection and eliminate artifacts. Numbers of spots were counted and the amount of streaking and adequacy of focusing was assessed by two investigators with experience in 2D gel analysis. Eight sets of conditions were chosen for further analysis based on the objective and subjective criteria. Samples from these methods were run in triplicate and matched together using PDQuest. After automated matching, spot alignment was improved by manual spot detection and matching. Molecular weight and pI were assigned based on molecular-weight standards and known isoelectric migration. Total number of spots was counted in each gel and the average number of spots on the sets of three gels was reported. Normalized protein abundance was calculated as spot intensity for an individual spot divided by spot intensity for all valid spots and reported as parts per million. Correlation coefficient was determined for each pair of gels in a matchset using the PDQuest software and was reported as the average of the three comparisons from each set of three gels. Mean values and standard deviation for every spot in the sets of three were determined and coefficient of variation (CV) was calculated as standard deviation divided by the mean. Mean and median CV was calculated for the total group of spots from each set of gels. Spots were ordered according to isoelectric point, and mean CV was also calculated for spots within each 1-pI unit on the gel.
RESULTS AND DISCUSSION
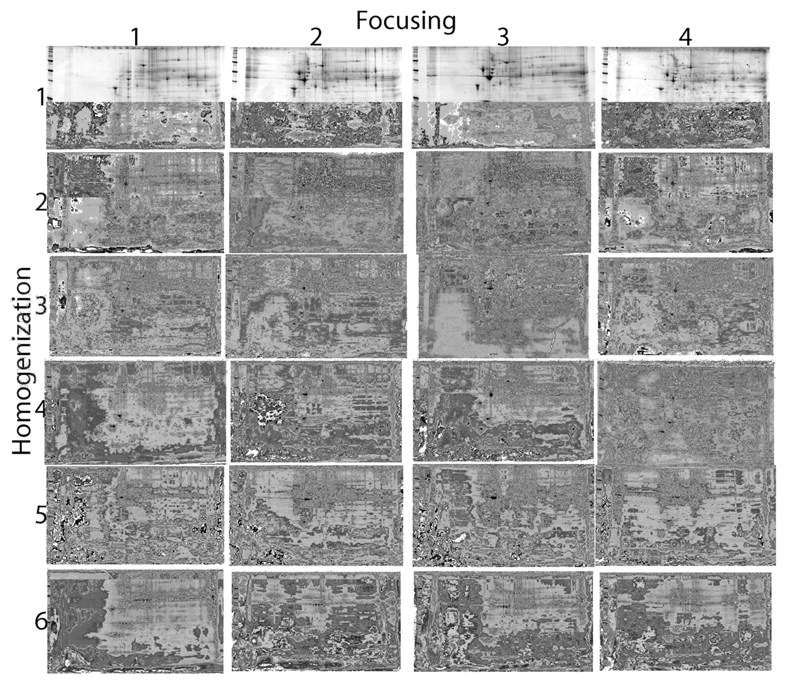
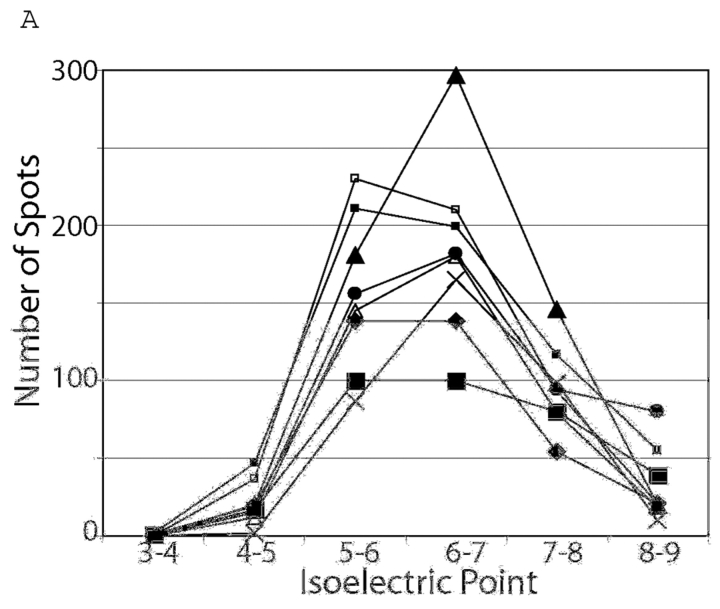
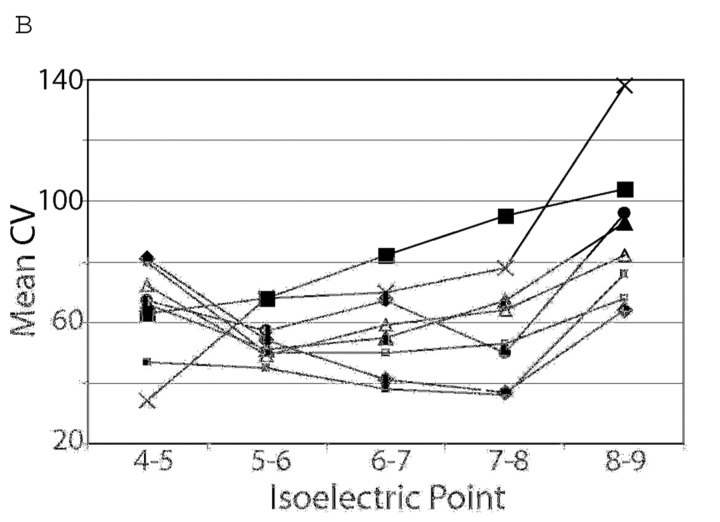
Rat heart lysates were prepared from six left ventricles using six different buffers. Each lysate was focused using one of four focusing buffers. The 24 resulting gels are seen in Figure 1. Protein spots were identified and the numbers of spots in each gel were determined (Table 1). The number of spots in a gel ranged from 121 for the sample homogenized in buffer 6 and focused in buffer 1 to 524 for the sample homogenized in buffer 2 and focused in buffer 3. Based on number of spots and the quality of the gel as judged by two investigators, eight combinations of conditions were chosen for further analysis to determine variability between gels prepared from the same sample for each condition. Conditions for further analysis were chosen because they had large numbers of spots present or appeared to be well resolved. Samples from ventricles prepared from these samples were separated by two-dimensional electrophoresis (2DE) in triplicate in order to compare the amount of variability between these samples. This approach eliminates biological variability and the variability that occurs during sample preparation. Remaining variability is caused by the focusing and electrophoresis process, staining, spot detection, and alignment. Numbers of spots, average correlation coefficient, and mean and median coefficient of variation for spot intensities from each of the sets of gels are shown in Table 2. The sample homogenized in buffer 2 and focused in buffer 3 (2–3) again showed the highest number of spots. Variability as indicated by correlation coefficient was similar between gels, but the mean and median coefficient of variation was smallest in the 2–1 sample preparation method. To determine whether there were differences in variability between pI regions of the gels associated with the buffers used, the number of spots (Figure 2A) and average coefficient of variation (Figure 2B) were determined for each pI region. All gels had more spots present in the 5–7 pI range than at the extremes of the gel. The 2–1 sample had more spots in the 5–6 pI range but the 2–3 sample had more in the 6–7 and 7–8 pI range. Variability as described by the mean CV within each pI range also differed between sample preparation methods. The sample preparation method using buffers 2–2 had the highest variability at the acidic end of the spectrum but the lowest at the alkaline end. Conversely, the method using buffers 2–4 had the smallest variability at the acidic end but the greatest at the alkaline end of the spectrum. The sample homogenized in buffer 2 and focused in buffer 3 consistently had the most spots visualized, but the sample using buffers 2 and 1 had almost as many spots with a better mean and median coefficient of variation. The sample homogenized and focused in buffer 2 had the highest mean CV at the acidic end of the gel but the lowest mean CV at the alkaline end.
FIGURE 1.

Two-dimensional gels obtained from rat left ventricle. Six homogenization and four focusing buffers were used. Focusing and homogenization buffers are described in the text. Numbers of spots for each combination are shown in Table 1.
TABLE 1.
Number of Spots in Gel from 24 Combinations of Homogenization and Focusing Buffers
| Homogenization Buffer | |||||||
| 1 | 2 | 3 | 4 | 5 | 6 | ||
| Focusing Buffer | 1 | 253 | 356 | 376 | 154 | 222 | 191 |
| 2 | 333 | 384 | 222 | 295 | 333 | 121 | |
| 3 | 183 | 524 | 267 | 343 | 334 | 338 | |
| 4 | 454 | 283 | 429 | 279 | 317 | 273 | |
TABLE 2.
Spot Intensity Variability in Eight Triplicate Sets of Gels
| Total Spots | Average Cor.Coef | Average CV | Median CV | |
| 1–4 | 551 | 0.86 | 53 | 41 |
| 2–1 | 611 | 0.89 | 44 | 36 |
| 2–2 | 354 | 0.89 | 49 | 38 |
| 2–3 | 619 | 0.87 | 58 | 48 |
| 2–4 | 313 | 0.85 | 73 | 67 |
| 3–1 | 461 | 0.85 | 65 | 53 |
| 4–1 | 274 | 0.84 | 83 | 87 |
| 4–3 | 406 | 0.85 | 58 | 47 |
FIGURE 2.
A: numbers of spots in each 1 pI unit on eight sets of triplicate gels. All gels had more spots between pI5 and 7 than in other regions of the gel. B: Mean coefficient of variation of spots in each 1 pI unit on eight sets of triplicate gels. 2–2♦ 2–1▪; 2–3▴; 2–4×; 1–4□; 3–1•; 4–1▪ 4–3▵
Strategies to improve the appearance of a gel based on comparing combinations of buffers have been used previously. Previous studies showed that mixing homogenization and focusing buffers improved number of spots and resolution,9 however, these studies did not look at the effect on variability. While variability is a widely recognized problem in 2DE, relatively few groups have focused on quantifying it and identifying the sources.10 We have described a method to quantify and optimize variability that occurs during 2DE, imaging, and spot detection. Our results demonstrate that different combinations of buffers change results with respect to both numbers of spots seen and the amount of variability in spot intensity. We have also demonstrated that the optimal conditions to quantify protein intensity may be different depending on the part of the gel that is of interest. These studies suggest that experimental conditions should be tested to optimize variability.
Acknowledgments
Support for this project came from the Department of Veterans Affairs. This project has been funded in whole or in part with federal funds as part of the NHLBI Proteomics Initiative from the National Heart, Lung, and Blood Institute, National Institutes of Health, under Contract No. N01-HV-28181.
REFERENCES
- 1.Klose J. Protein mapping by combined isoelectric focusing and electrophoresis of mouse tissues. Humangenetik 1975;26:231–243. [DOI] [PubMed] [Google Scholar]
- 2.O’Farrell PH. High resolution two-dimensional electrophoresis of proteins. J Biol Chem 1975;250:4007–4021. [PMC free article] [PubMed] [Google Scholar]
- 3.Choe LH, Lee KH. Quantitative and qualitative measure of intralaboratory two-dimensional protein gel reproducibility and the effects of sample preparation, sample load, and image analysis. Electrophoresis 2003;24:3500–3507. [DOI] [PubMed] [Google Scholar]
- 4.Terry DE, Desiderio DM. Between-gel reproducibility of the human cerebrospinal fluid proteome. Proteomics 2003;3:1962–1979. [DOI] [PubMed] [Google Scholar]
- 5.Voss T, Haberl P. Observations on the reproducibility and matching efficiency of two-dimensional electrophoresis gels: Consequences for comprehensive data analysis. Electrophoresis 2000;21:3345–3350. [DOI] [PubMed] [Google Scholar]
- 6.Zhan X, Desiderio DM. Differences in the spatial and quantitative reproducibility between two second-dimensional gel electrophoresis systems. Electrophoresis 2003;24:1834–1846. [DOI] [PubMed] [Google Scholar]
- 7.Dowsey AW, Dunn MJ, Yang GZ. The role of bioinformatics in two-dimensional gel electrophoresis. Proteomics 2003;3:1567–1596. [DOI] [PubMed] [Google Scholar]
- 8.Mahon P, Dupree P. Quantitative and reproducible two-dimensional gel analysis using Phoretix 2D Full. Electrophoresis 2001;22:2075–2085. [DOI] [PubMed] [Google Scholar]
- 9.Stanley BA, Neverova I, Brown HA, Van Eyk JE. Optimizing protein solubility for two-dimensional gel electrophoresis analysis of human myocardium. Proteomics 2003;3:815–820. [DOI] [PubMed] [Google Scholar]
- 10.Molloy MP, Brzezinski EE, Hang J, McDowell MT, VanBogelen RA. Overcoming technical variation and biological variation in quantitative proteomics. Proteomics 2003;3:1912–1919. [DOI] [PubMed] [Google Scholar]


