Abstract
In order to study the effect of increased CD4 cell counts on the biology of hepatitis C virus (HCV), we analyzed the genetic variability of HCV generated over 8 y in eight human immunodeficiency virus-1 (HIV-1) and HCV co-infected patients. This was a retrospective study in which HIV patients were selected who had profound immune impairment evident over four years and were co-infected with HCV genotype 1 and who then went on highly active antiretroviral therapy (HAART). These patients achieved different degrees of immune reconstitution, measured as increased CD4 cell counts during a 4- to 8-y period, following initiation of HAART. HCV genetic variability was determined by measuring the genetic diversity (Hamming distance, HD), and complexity (number of viral variants) in plasma samples collected at yearly intervals just before and after the initiation of HAART. The parameters were assessed by molecular cloning and sequencing of a 575-bp fragment including the HCV envelope 1 and envelope 2 genes (E1/E2), containing the hypervariable region 1 (HVR1). significantly increased HVR1 genetic diversity was observed in analyzed samples where the patients’ CD4 cell counts were ≥100 compared with CD4 cell counts <100. A significant increase in genetic diversity in HVR1 was detected in co-infected patients whose CD4 cell counts increased from <100 to >400 over a period of more than 4 y of HAART therapy. This was in contrast to a minimal increase in HCV genetic diversity of HVR1 occurring in patients whose CD4 cell counts failed to rise much over 200 over 7 y of follow up. Insertion and deletion of HCV genomic fragments in the E1/E2 region was documented in one patient who developed fulminant hepatitis C.
Keywords: genetic variability of HCV, HVR1, CD4 cell counts, HIV/HCV
Hepatitis C virus (HCV) is a positive single-stranded RNA virus with a substantial replication rate. HCV infects patients as a quasispecies, characterized by great genetic diversity, which can be measured as the Hamming distance (HD).1 This variability arises from both HCV polymerase infidelity and evolutionary adaptation to host immune pressure. Spontaneous viral clearance after acute hepatitis C infection is associated with a drastic decrease in viral diversity shortly after seroconversion. In those patients who fail to clear virus after seroconversion, this is followed by a marked increase in diversity. In contrast, those patients who develop fulminant hepatitis after seroconversion show almost no viral diversity.1 Continued genetic variability allows virus to circumvent the immune response, leading to chronic infection resulting in the development of chronic liver disease, cirrhosis, and in some cases hepatocellular carcinoma.
Co-infection by HCV and HIV are common. In the United States, an estimated 150,000–300,000 HIV patients are co-infected with HCV.2 HIV infection appears to accelerate the progression of HCV-related liver disease. Progressive and often fatal hepatitis C infection resulting in aggressive cirrhosis, bleeding, and hepatocellular carcinoma have become new severe problems for HIV/HCV co-infected patients, who are surviving longer due to highly active antiretroviral therapy (HAART).3–6
The presence of HIV may increase the severity of HCV infection by promoting high HCV replication and the loss of CD4 cells. The enhanced HCV replication generates sequence variability through increased error rate of the HCV polymerase. The immune system appears to drive the diversity of the viruses and requires a CD4 cell threshold to demonstrate augmented viral sequence diversity. In this study, we examined the HCV genetic variability in eight HIV/HCV co-infected patients who were subsequently treated with HAART. Six patients who achieved undetectable viral loads had profound impaired immune function, characterized by CD4 cell counts <100 cells/mm3 persisting for more than 4 y prior to initiation of HAART. These patients showed variable degrees of response to HAART, i.e., immune reconstitution, as measured by increased CD4 cell counts. One patient with milder immune impairment and stable CD4 cell counts before and after HAART served as a control. An additional patient who failed to develop any measurable viral or immunologic response to HAART therapy, and who subsequently developed fulminant liver failure, was studied as a negative control. The viral variability was assessed by sequencing the envelope gene (E1/E2) both within and outside the hypervariable region 1 (HVR1). Isolated HCV viral RNAs from patients’ plasma collected once each year following HAART was analyzed by amplifying sequences in this 575-bp area by reverse transcription polymerase chain reaction (RT-PCR) and sequencing amplicons cloned into bacterial vectors. We analyzed approximately 450 sequences from 45 samples taken from eight patients, to examine genetic diversity and viral variants within this hypervariable region of HCV. These finding were correlated with the degree of immune reconstitution achieved in these patients. The sequencing results indicate a strong direct association between increased sequence diversity in association with reconstitution of immune function, while failure to improve immune function led to a paradoxical blunting of viral diversity in association with progression of liver disease.
PATIENTS AND METHODS
Patients
Eight HIV/HCV co-infected patients were chosen for this study. They had been followed between 1989 and 2002 at the Center of AIDS Research and Treatment at North Shore University Hospital. Blood samples collected previously from patients who had participated in an earlier study to determine the utility of the nucleic acid sequence-based amplification assay (NASBA) for quantitation of HIV viral RNA in plasma samples were used for this study.7 This NASBA study had been approved by our investigation review board (IRB). All patients provided informed consent for the NASBA study, which allowed samples to be used for other studies correlating viral load to clinical disorders. HAART therapy was initiated at some time after March 1996 in each of these patients. These patients had samples taken prior to HAART and after HAART or prior to death. The original plasma samples collected in EDTA tubes had been processed and stored at −70°C for up to 8 y. Quantitative HIV viral load had already been determined in each sample using the NASBA assay.7 Selected samples taken at yearly intervals following HAART were taken for this study. The measurement of CD4, CD8 counts, and alanine aminotransferase (ALT) were carried out in the pathology laboratory at North Shore University Hospital as part of the general care of each patient. The genetic diversity (HD) and genetic complexity (number of viral variants) of the HVR1 and flanking sequences from E1/E2 of the HCV genome were determined in these yearly serial plasma samples as previously described.1
RT-PCR
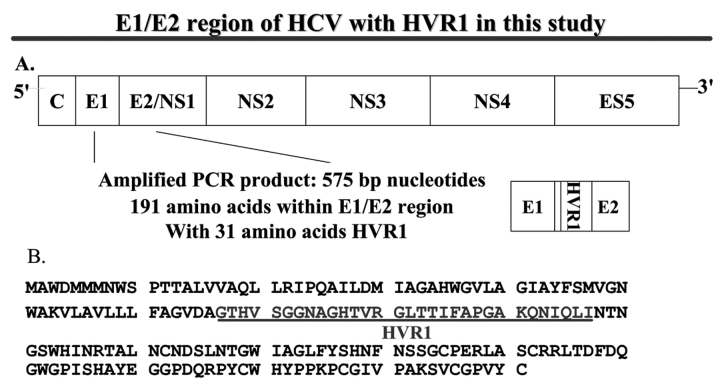
The viral sequences spanning the E1/E2 region containing HVR1 of HCV genome were selected for this study based on previous publications8 and are described in Figure 1A. Total RNA was extracted from 280 μL plasma with QIAamp viral RNA mini kit (Qiagen, Valencia, CA) following manufacturer’s instructions. Five microliters of viral RNA was used in one-step RT-PCR reaction with HCV-specific primers (Qiagen one-step RT-PCR kit). Nested PCR was performed to increase the sensitivity and specificity with a different set of primers. To ensure the fidelity of DNA synthesis, a supplement of 0.1 U of Platinum Pfx DNA polymerase (Invitrogen, Carlsbad, CA) was added to the RT-PCR and nested PCR reaction mix. The primers from the E1 and E2 genes of the HCV genome used in this study have been reported.8 To reduce the risk of contamination, appropriate precautions were taken.9
FIGURE 1.
E1/E2 region of HCV with HVR1 in this study. A: scheme of the genomic organization of HCV. The observed and predicted location of polyprotein cleavage sites are indicated. C, nucleocapsid protein gene; E, envelope gene; ns, nonstructural protein gene. The location of PCR products is indicated under the HCV genome. B: E1/E2 amino acid sequence and the location of HVR1.
Molecular Cloning and Sequencing
The RT-PCR products amplified from the E1/E2 region of the HCV genome were purified with High Pure PCR Product Purification Kit (Roche, Indianapolis, IN), cloned into a pDrive cloning vector, and transformed into Qiagen EZ Competent cells provided in the Qiagen PCR cloning kit according to manufacturer’s instructions. Approximately 20 clones were selected at each time point from each patient for sequence analysis. For sequencing, plasmid DNA was extracted using a plasmid kit (Quantum Prep MiniPrep Kit, Bio-Rad Laboratories, Hercules, CA) according to the manufacturer’s recommendations. The double-stranded plasmid DNA was sequenced using ABI big dye terminator chemistry and modified Sanger method on ABI Prism 3100 Genetic Analyzer (Applied Biosystems, Foster City, CA).
Data Analysis
Genetic variability was analyzed from predicted amino acid (AA) sequences (191 AAs in length, amplified from the E1/E2 region of the HCV genome, including the 31 AA of HVR1, as shown in Figure 1B). After exclusion of defective or unreadable sequences, approximately 450 clones derived from 45 samples from eight patients were used in this analysis. The genetic variability was represented as HCV genetic diversity and complexity in this study. The genetic diversity was calculated by the HD, measuring the number of amino acid differences between two sequences.1 The mean HD, the average of the value taken for all the sequence pairs derived from a single sample, was calculated separately for the 31-AA HVR1 region and the 160-AA entire sequence outside the HVR1.1 The most frequently isolated viral sequence from the initial pre-HAART patients’ samples was used as an internal reference for subsequent viral sequence comparison.
The HCV genetic complexity was indicated by the number of viral variants within the 31-AA HVR1 and the other 160-AA E1/E2 region outside the HVR1 from the same samples. The phylogenetic trees were constructed based on the 575-bp consensus nucleotide sequences from each visit by using PHYLIP, Phylogeny Inference Package computer programs for inferring phylogenies.10 At each time point, we aligned at least 10 clones to generate consensus sequences for each patient by use of ClustalW software. 1 The GenBank database references used to confirm the HCV genotype included 1A (D10749), 1B (D11355), and 1C (D14853).
Statistical Analysis
The results in this paper are expressed as the mean ± SD. Relationships between quantitative variables were analyzed by Pearson’s product-moment correlation coefficient (r). The statistical significance of r was tested using a t-test. The comparison of two different groups was done by student’s t test with one-tail distribution and two-sample unequal variance. In all tests, a P value less than 0.05 was considered statistically significant.
Nucleotide Sequence Accession Numbers
The sequences were submitted to GenBank and were assigned accession numbers as follows: AF529693-AF529814, AF547436-AF547498, AF547500-AF547619, AY342430-AY342613.
RESULTS
Subject Characteristics
We selected a total of eight patients for the current study. One patient with relatively mild immune-suppression prior to successful HAART (viral load <400 RNA copies/mL) developed stable CD4 cell counts of ~500 cells/mm3 while on HAART (#1) was chosen as a control. Three patients with profound immune suppression for over 4 y prior to HAART therapy and who demonstrated only marginal immunological improvement with successful HAART, with CD4 cell counts rising from <100 cells/mm3 to only >100 to <300 cells/mm3 (patients 2, 3, 4) were chosen as marginal responders to HAART (group 1). This group was compared to a second group of similarly severely immune-suppressed patients with CD4 cell counts of <100 cells/mm3 for over 4 y prior to HAART but who showed significantly greater improvement in immune function after initiation of HAART, with CD4 cell counts increasing from <100 to >400 cells/mm3 (patients 5, 6, 7) (group 2). Finally, one severely immune-suppressed HIV patient with a CD4 cell count between 0 and 16 cells/mm3 and with long-standing HCV infection who failed to respond to HAART during the 10 mo follow-up and who died from severe progressive HCV was included as a nonresponding control to see how viral diversity and complexity changed in unsuccessful HAART (patient 8). The sequences from patient 8 were not included in the analysis of genetic diversity and complexity and are presented individually due to unusual viral genomic changes detected in association with progressive severe hepatic failure occurring while on unsuccessful HAART. The relevant clinical information about the eight patients in this study is described in detail in Table 1. The consensus sequences were derived from 575-bp nucleotide sequences generated from plasma samples taken at each subsequent visit for all eight patients, and these were used for phylogenetic analysis.
TABLE 1.
Clinical Characteristics of Patients
| Patient | Age (yr) | Race | Sex | HCV Geno-type | HAART Therapy | HIV Viral Load (Copies/mL)* | CD4 Count (Cells/mm3) (Change) | ALT Level (Average) U/L |
| 1 | 45 | W | F | 1a | Yes | <50 | 414–638 | 174.2 |
| 2 | 46 | W | M | 1a | Yes | <50 | 33–161 | 55.5 |
| 3 | 51 | W | F | 1b | Yes | <50 | 20–130 | 90.8 |
| 4 | 48 | W | F | 1a | Yes | <50 | 15–277 | 113.7 |
| 5 | 58 | B | F | 1a | Yes | <50 | 78–1196 | 71.0 |
| 6 | 45 | W | M | 1a | Yes | <50 | 76–814 | 74.0 |
| 7 | 47 | W | M | 1a | Yes | <50 | 50–422 | 71.0 |
| 8 | NA | W | M | 1a | Yes | >170,000 | 0–16 | NA |
*Results after HAART therapy.
The phylogenetic tree (data not shown) revealed distinct clusters of unique viral sequences for each patient, indicating that the sequences from all of the samples were internally consistent and without cross-contamination. The phylogenetic reconstruction showed all patients were infected with HCV genotype 1 based on the reference sequences from known HCV genotypes. The sequences from seven patients were clustered to HCV genotype 1a, while one patient clustered to HCV genotype 1b (patient 3). The genotypes for these eight patients were consistent with the results previously recorded in the clinical laboratory, in which HCV genotyping was performed using reverse hybridization with the line probe assay (LiPA; InGeN, Rungis, France).
Higher Genetic Diversity in HIV/HCV Co-infected Patients with CD4 Cell Counts ≥100 Cells/mm3
A total of 424 amino acid (AA) sequences were derived from the PCR amplification and cloning of HCV viral sequences in 42 plasma samples drawn from seven HIV/HCV co-infected patients. A survey of the derived AA sequences was used to analyze genetic diversity and complexity of the viral sequences in relation to the patients’ CD4 cell counts. The mean HD and the number of viral variants were determined, and then compared with the CD4 cell counts, at each sample draw. We assessed the effect of changes in CD4 cell counts on the genetic diversity and complexity within the 31-AA HVR1 as well as the 160-AA E1/E2 regions outside the HCV HVR1. As shown in Table 2, the mean HD in the isolates from patients with CD4 cell counts ≥100 cells/mm3 was significantly higher than the mean HD when the CD4 cell count was <100 cells/mm3, in the 31-AA HVR1 (4.7±5.3 vs. 20.5±13.9, P value < 0.0001), and in the 160-AA E1/E2 outside HVR1 (3.5±2.4 vs. 6.6±4.9, P=0.0068). The mean HD in HVR1 in the samples from patients with CD4 cell counts ≥100 to <200cells/mm3, ≥200 to <500 cells/mm3, and ≥500 cells/mm3 were 20.5±10.4, 22.8±15.7, and 14.4±16.4, with P=0.0013, 0.011, and 0.0045, respectively, when compared with the samples from patients with CD4 cell counts <100 cells/mm3. The mean HD in the 160-AA E1/E2 region outside HVR1 was 6.5±3.6, P=0.042 for CD4 cell count ≥200 to <500 cells/mm3 and 8.2±6.6, P=0.016 for CD4 cell count ≥500 cells/mm3 compared with CD4 <100 cells/mm3. There was no significant difference in the mean number of viral variants based on 10 sequences from each sample within HVR1 and the E1/E2 region outside HVR1 in the groups with different CD4 cell counts. No significant difference in CD8 counts in these two categories with CD4 <100 cells/mm3 and ≥100 to <200 cells/mm3 suggested that the higher genetic diversity within HVR1 when CD4 >200 cells/mm3 was substantially driven by CD4 cell counts.
TABLE 2.
Genetic Diversity, Number of Viral Strains and CD8 Cell Counts in HIV/HCV
| Co-infected Patients with Different CD4 Cell Counts | |||||
| CD4 <100 (N=10) | CD4 ≥100 (N=32) | CD4 ≥100 to <200 (N=12) | CD4 ≥200 to <500 (N=7) | CD4 ≥ 500 (N=13) | |
| CD4 Cell Count | 60.1±23.8 | 414.2±278.5 | 141.2±23.5 | 354.6±60.5 | 698.4±184.0 |
| Genetic Diversity | 20.5±13.9 | 20.5±10.4 | 22.8±15.7 | 14.4±16.4 | |
| (Mean HD) HVR1 | 4.7±5.3 | p<0.0001 | P=0.00013 | P=0.011 | P=0.0045 |
| No. of Viral Variants | |||||
| HVR1 | 4.1±2.3 | 4.3±1.8 | 4.6±1.8 | 4.6±1.9 | 3.9±1.8 |
| Genetic Diversity (Mean HD) | 6.6±4.9 | 6.5±3.6 | 8.2±6.6 | ||
| E1/E2 Outside HVR1 | 3.5±2.4 | P=0.0068 | 4.8±2.8 | P=0.042 | P=0.016 |
| No. of Viral Variants | |||||
| E1/E2 outside HVR1 | 7.8±2.0 | 8.6±1.6 930.0±398.4 |
8.3±1.4 | 9.3±1.2 1202.6±278.6 |
8.4±1.9 1110.9±300.7 |
| CD8 Count | 412.7±205.3 | P<0.0001 | 577.4±291.3 | P<0.001 | P<0.001 |
The genetic diversity was calculated by mean HD from predicted AA sequences within HRV1 (31 AA), and E1/E2 outside HVR1 (161 AA) obtained from each sample and the number of viral strains was based on the 10 predicted AA sequences within HRV1 and E1/E2 outside HVR1 from each sample. The data represent mean ± SD. P value for comparison with the CD4 <100 cells/mm3 group by student t-test. A P value < 0.05 represents statistical significant difference. None of the other differences were statistically significant except where a P value is indicated.
Correlation of Genetic Diversity of HCV HVR1 in HIV/HCV Co-infected Patients with the Change of CD4 Cell Counts
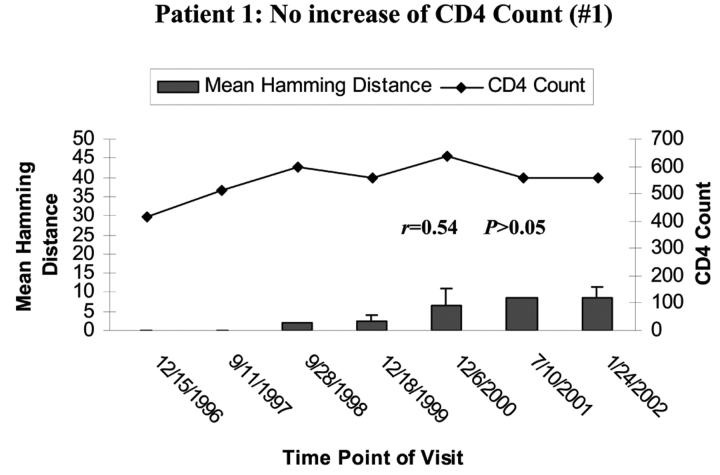
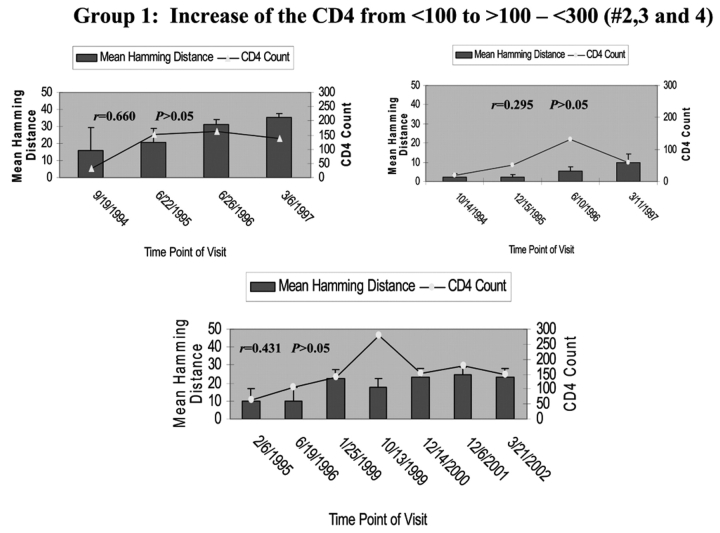
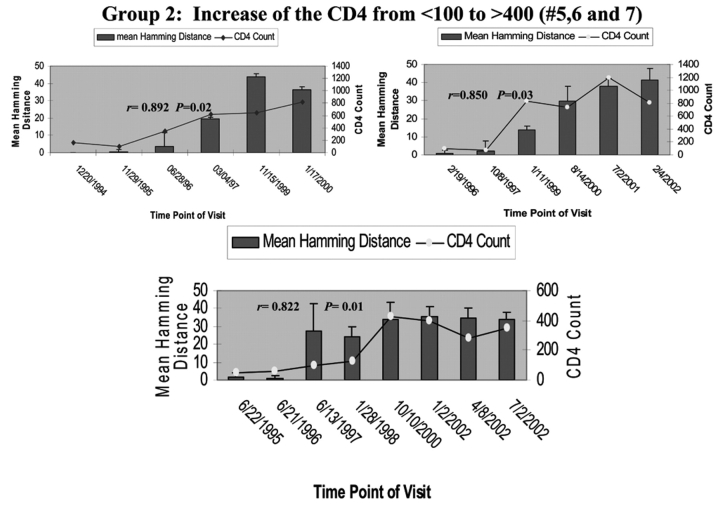
To determine the effect of an increase in CD4 cell counts on HCV genetic diversity, we compared the HD and the change of CD4 cell counts during the period of follow-up in all seven HIV/HCV co-infected patients. Patient 1’s CD4 cell counts remained around 500 cells/mm3 during the 6 y of follow-up, while the mean HD within the HVR1 of HCV was shown to gradually increase over time. There was no correlation between increased genetic diversity within HVR1 and CD4 cell counts in this patient (Pearson’s correlation coefficient was 0.54, P>0.05, as shown in Figure 2A). In group 1, CD4 cell counts increased over time from <100 to ≥100–<300 cells/mm3. The mean HD within the HVR1 was marginally changed over time. Again there was no correlation between increased HVR1 genetic diversity and CD4 cell counts, with P>0.05 in group 2, as shown in Figure 2B. In group 3 (patients 5, 6, and 7), in which the CD4 cell counts increased dramatically from <100 to >400 cells/mm3, there was a significant increase in HVR1 genetic diversity observed during the 6-y follow-up period. The increased HVR1 diversity correlated with the change in CD4 cell counts, with r of 0.892, 0.850, and 0.822 with P=0.02, 0.03, and 0.01 in patients 5, 6, and 7, respectively (Figure 2C). The results strongly indicate a correlation between increased genetic diversity within HVR1 of HCV and increased CD4 cell counts.
FIGURE 2.
Correlation of mean HD with CD4 cell counts. The bars represent the mean HD; the line, CD4 cell counts. The date of each visit is labeled under the bars. A: Patient 1 with stable CD4 cell counts over 6 y. Note litlle change in HD. B: group 1 with CD4 cell counts increased from <100 to <300 cells/mm3 over 3–6 y. Changes in HD increase with improvement in CD4 count but not to the degree seen in group 2 patients, whose CD4 counts rose over 400 cells/mm3. C: group 2 with CD4 cell counts increased from <100 to >400 cells/mm3 over 5–7 y.
Increased Genetic Diversity of HVR1 of HCV in HIV/HCV Co-infected Patients with CD4 Cell Counts Increased from <100 to >400 Cells/mm3
To reduce the effect of the CD4 cell counts on genetic diversity of HVR1 and the E1/E2 region outside of HVR1 of HCV in the initial samples, the average fold change of HD during the period of follow-up was calculated using the mean HD from the first visit as a baseline and a divisor for the mean HD at subsequent visits. The average fold change of HD within the HVR1 of HCV in group 2, where CD4 cell counts increased from <100 to >400 cells/mm3 over the 6-y follow up showed a statistically significant increase in average fold change in the HVR1 (P = 0.0081, Table 3) when compared with group 1, whose CD4 cell counts increased from <100 to <300 cells/mm3. There was no significant difference in the average fold increase in HD in the 160-AA E1/E2 region outside HVR1 between group 3 and group 2.
TABLE 3.
Increased Genetic Diversity of HVR1 and E1/E2 outside HVR1
| Years of follow up | Total No. Sequences | Increased Genetic Diversity–HVR1 (Fold Change) | Increased Genetic Diversity–E1/E2 outside HVR1 (Fold Change) | ||
| Patient 1 CD4 ≈ 500 | |||||
| cells/mm3 | #1 | 7 | 62 | 3.955±3.775 | 5.093±4.498 |
| Group 1 | #2 | 4 | 33 | 1.603±0.555 | 1.839±0.962 |
| CD4<100–300 | #3 | 4 | 31 | 2.002±1.463 | 0.456±0.395 |
| cells/mm3 | #4 | 8 | 66 | 1.855±6.389 | 2.595±1.284 |
| Group2 | #5 | 8 | 59 | 19.537±16.513 | 1.330±0.979 |
| CD4 <100 to >400 | #6 | 7 | 69 | 17.357±19.252 | 1.594±1.284 |
| cells/mm3 | #7 | 7 | 104 | 12.797±7.741 | 0.890±0.348 |
| P=0.0081* | |||||
The genetic diversity was calculated by mean hamming distance from predicted amino acid sequences within HRV1 (31AA) and E1/E2 outside HVR1 (160AA) obtained from each sample. Average of increased genetic diversity = average of mean HD of the each sample/mean HD of the first sample in each patient. Patient 1: CD4 cell counts maintained at ≈ 500 during the period of study. Group 1: CD4 cell counts increased from <50 to >100–<300. Group 2: CD4 cell counts increased from <100 to >400. *Group 2 compared with group 1.
Individual HCV Genetic Complexity over Time
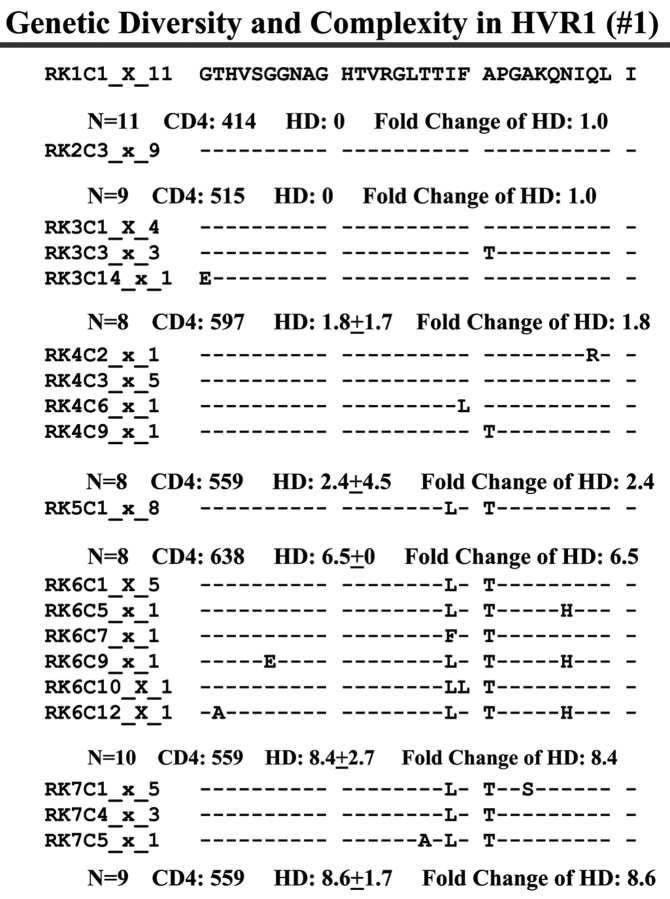
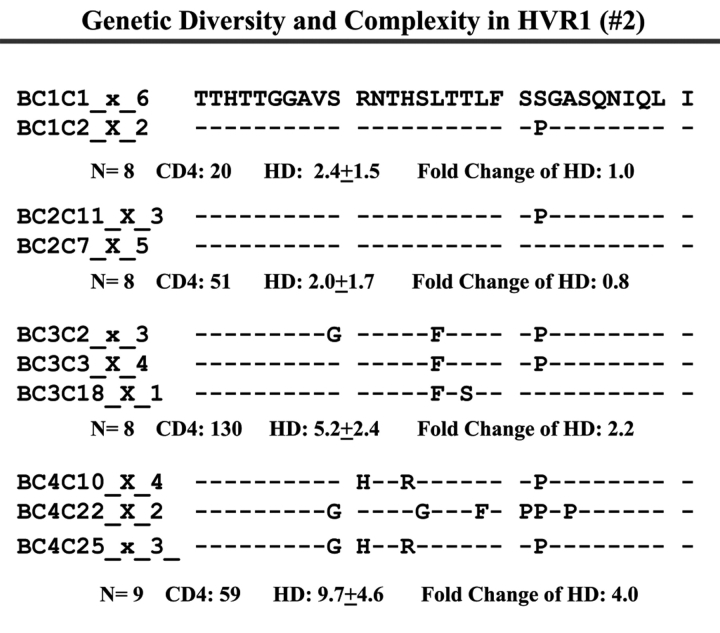
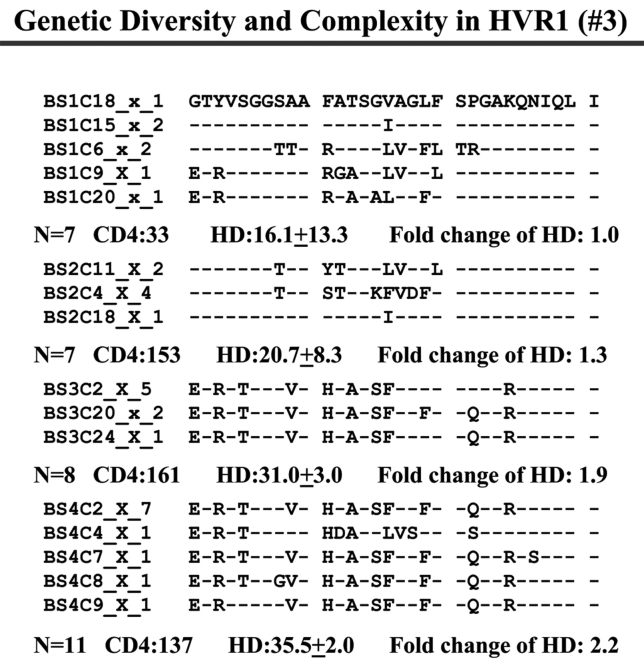
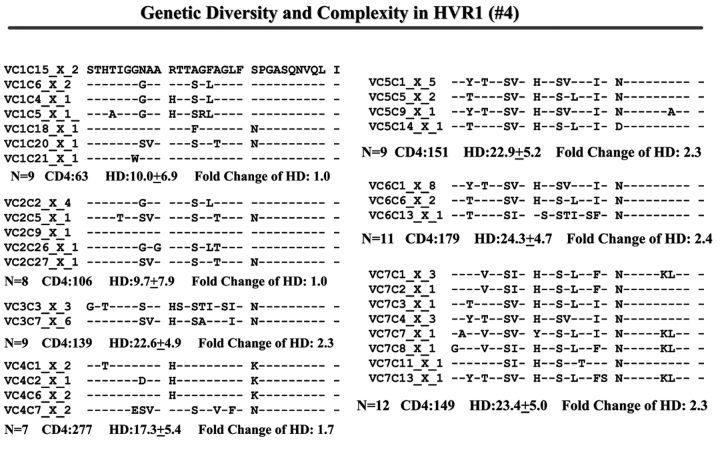
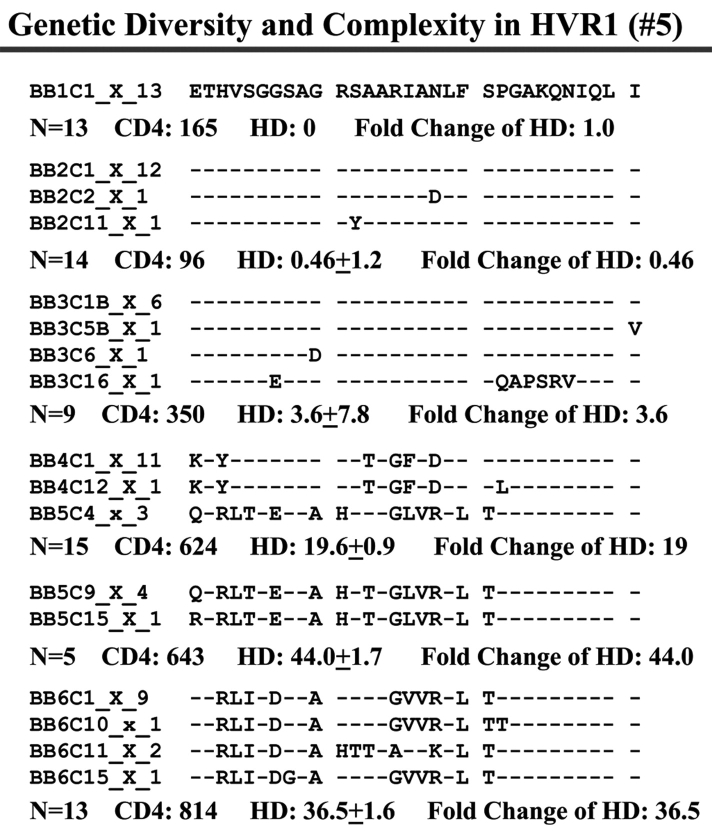
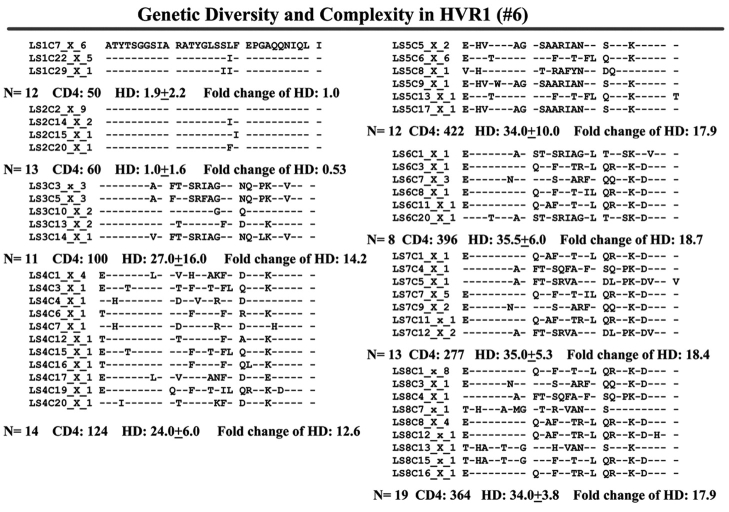
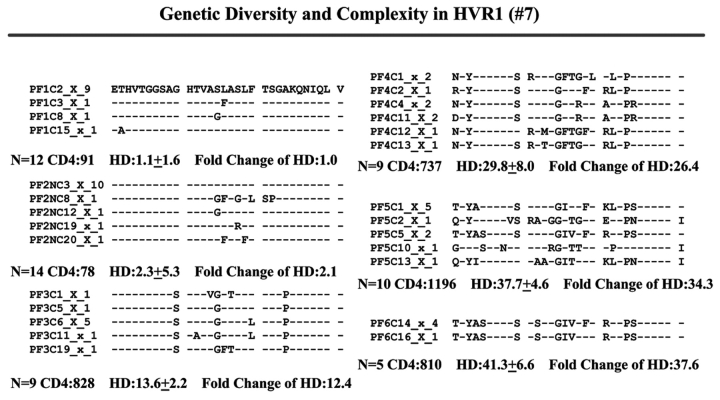
When we examined viral variants as genetic complexity within the 31-AA HVR1 region from each group individually, we found one viral variant in control 1 (with CD4 cell counts ~500 cells/mm3 over 6 y, Figure 3a) in the isolates from the baseline and second follow-up sample, and three viral variants in the last follow-up sample. In group 1, with increasing CD4 cell counts from <100 to ≥100–<300 cells/mm3 over time, the baseline samples showed a few viral variants in the isolates, with the number of viral variants detected increasing in small measure during the follow-up period isolations, as seen in Figure 3 (B, C, and D). In group 2, which demonstrated an increase in CD4 cell counts from <100 to >400 cells/mm3 in the samples obtained during 4–7 years’ follow-up, new viral variants appeared over time and became the predominant species in the latest samples (Figure 3E, F, and G) even though the total numbers of viral variants were not significantly different, as shown in Table 3.
FIGURE 3.
Individual changes of HCV genetic diversity and complexity over time. Thirty-one-AA sequences within HCV HVR1 region were aligned. The dashed line indicates the identical AA in that location. The number of the sequences, CD4 count, iD value, and fold change of the HD over time are indicated below each year’s AA sequence. A: control, CD4 approximately 500 cells/mm3. B, C, and D: group 1, CD4 <100 to 300 cells/mm3. E, F, and G: group 2, CD4 <100 to >400 cells/mm3.
Viral Genomic Fragment Deletion in the E1/E2 Region of HCV in a Patient with Severe Progressive Fatal HCV Probably Complicated by HCC
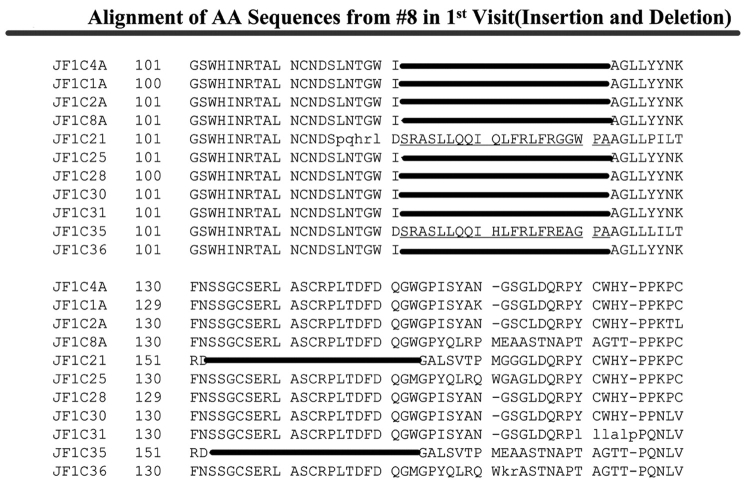
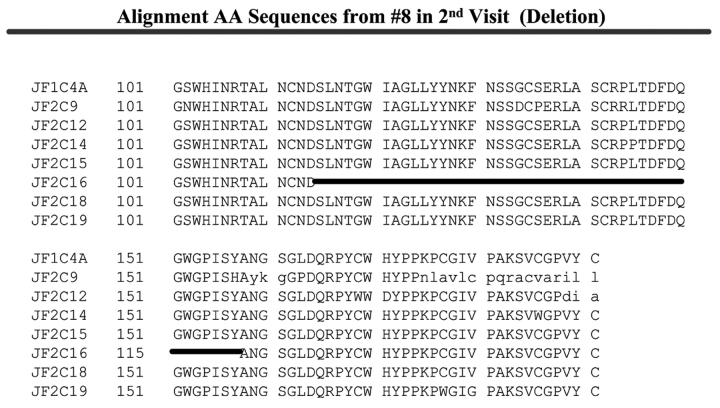
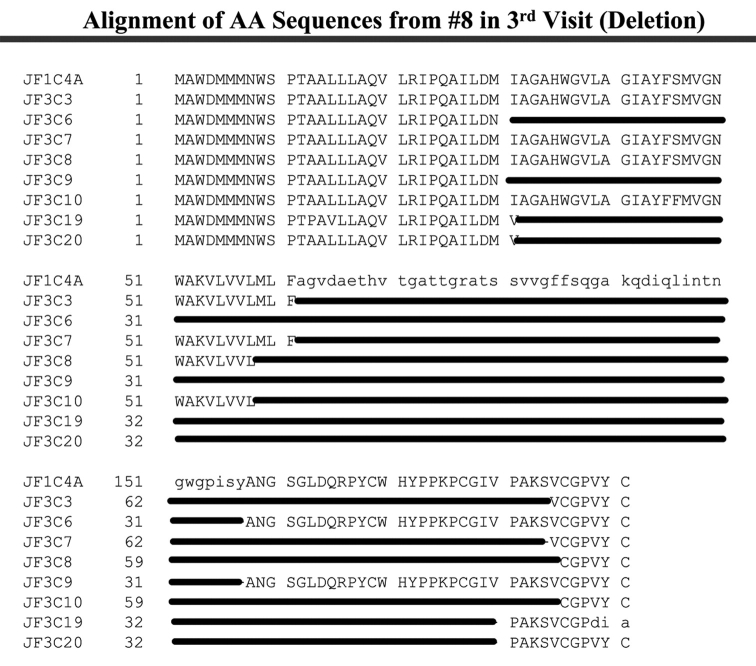
Patient 8 harbored unusual genomic variants in plasma samples obtained from three individual visits, over a single-year period, shortly before the patient died from HCV. As shown in Figure 4A, the baseline sample contained two different viral sequences with a 21-AA fragment insertion located between AAs 122 and 123 and a 21-AA fragment deletion from AA 153 to 173 out of the 11 E1/E2 region sequences we examined. Upon analysis of the second sample, there was a single sequence with a 43-AA fragment deletion from AA 115 to 157 in the E1/E2 region among the seven cloned and analyzed sequences (Figure 4B). This larger deletion appeared to correlate with a general decline in health and liver function. The final patient plasma sample, obtained 10 mo after the first sample, amplified viral sequences with large HCV genomic fragment deletions in the E1/E2 region; these appeared to be the predominant viral variants, since all eight sequences demonstrated large fragment deletions. Two sequences had a 123-AA deletion from AA 62 to 184, four sequences were analyzed with 127-AA deletions, with two of the sequences having deletions of AA 31 to 157, and two of the sequences showed deletions of AA 59–185. In addition, two of the isolated viral sequences had a 149-AA deletion from AA 32 to 180, as shown in Figure 4C. This patient’s immune system failed to show any improvement.
FIGURE 4.
Alignment of AAs from patient 8. A: 21-AA insertion between AA 122 and 123, 21-AA deletion in the region AA 133 to 153 in 2/11 sequences from the first visit. B: 43-AA deletion in the region AA 115 to 157 in 1/7 sequences from the second visit. C: Two 123-AA deletions from AA 62 to 184, two 127-AA deletions from AA 31 to 157, two 127-AA deletions from AA 59 to 185, two 149-AA deletion from AA 32 to 180 among eight sequences from third visit.
DISCUSSION
HCV was identified in 1989 as the major etiologic agent of non-A, non-B hepatitis.12 One of the most disturbing features of HCV is its long-term persistence in the host, followed by development of chronic liver disease, 13 cirrhosis, and in some cases hepatocellular carcinoma,14 cryoglobulinemia,15 and autoimmunity.16,17 Due to shared transmission routes, the prevalence of HCV is especially high among persons infected with HIV. HIV infection appears to accelerate the progression of HCV-related liver disease18—an issue whose importance has increased with prolonged survival of HIV-infected persons receiving HAART. In HIV-infected patients with long-term undetectable HIV viral load and increased CD4 cell counts, liver failure has become one of the leading causes of mortality. Therefore, understanding the effect of immune reconstitution, due to HAART therapy, on HCV replication and genetic variability in HIV/HCV co-infected patients is important for the development of strategies to control both viruses.
This study shows a clear correlation between increased HCV genetic diversity and CD4 cell counts in HIV/HCV co-infected patients with significant immune reconstitution. This study has uniquely characterized the effect of immune reconstitution, measured by CD4 cell counts, on HCV genetic variability, and differs from previous studies in several significantly ways.
First, to avoid the potential for genotype-specific differences in variability, we restricted our analysis to subjects infected with HCV genotype 1, the most prevalent genotype in the United States. Indeed, a study of HIV/HCV co-infected patients found that the complexity of HVR1 differed according to HCV genotype.19,20 Similarly, other researchers have noted lower genetic diversity in the patients/subjects infected with HCV genotype 2 or 3.21
Second, our patients had severe impaired immune function with CD4 cell counts <100 that persisted for more than 4 y before initiation of HAART, which provides a baseline of HCV genetic variability mainly introduced by HCV replication without immune suppression.
Third, the samples obtained in yearly intervals over 3–6 y following initiation of HAART provide a sufficient timeline to gauge the effect of increasing CD4 cell counts and viral replication on HCV variability. Finally, the different degrees of immune reconstitution characterized as CD4 cell counts from <100 to 1000 cells/mm3 allows us to analyze the effect of incrementally increased CD4 cell counts on HCV genetic variability.
The genetic variability was represented as HCV genetic diversity (mean HD) and complexity (number of viral variants). A total of 424 AA sequences were derived from 42 plasma samples taken from seven HIV/HCV co-infected patients, and were used to determine genetic diversity and complexity analysis based on the CD4 cell counts. We found the mean HD when the CD4 cell counts were ≥100 cells/mm3 were significantly higher than when the CD4 cell counts were <100 cells/mm3. This suggests that increasing CD4 counts put tremendous immunological pressure on HCV, which can be overcome only by an increased genetic diversity of the HVR1 region. This seems to occur when the CD4 cell counts rises above 100 cells/mm3. Diversity in the E1/E2 region outside HVR1 becomes apparent only after the CD4 cell count rises to ≥200 cells/mm3. When the patients were classified into two groups based on the degree of increase in CD4 cell counts following HAART, we found significantly increased genetic diversity of the HVR1 region as CD4 counts rose in both groups. However, there was a positive correlation between genetic diversity of HRV1 and CD4 cell counts in group 2, where the CD4 cell counts increased from <100 to >400 cells/mm3 during the follow- up period, in contrast to group 1, where there was less impressive improvement of immunity. A gradual increase in genetic diversity in the HVR1 region was noted in a control patient with stable CD4 cell counts ~500 cells/mm3 over a 6-y extended follow-up. The results support the hypothesis that both CD4 cell immune-dependent accumulation of genetic diversity and mutation caused by viral replication error in HVR1 contribute to this effect.
The distribution of mutations has been reported to be uneven, but the basis of this variability is unexplained. A hot spot for mutation is described within the HVR1, which presents B and T epitopes shown to induce protective immunity against HCV.22,23 It is postulated that genetic variation results in the production of HCV quasispecies. Interactions between host and virus selects for those quasispecies better adapted to survival. CD4 cells have important regulatory functions through their Th1/Th2 secretion profiles, which support either CTL responses or antibody production. HIV infection thus may serve as a model to study the influence of humoral and cellular immune deficiencies on HCV genetic heterogeneity. In contrast, early studies provide conflicting results because of shortcomings in characterization of the studied populations. In order to reduce the basal genetic diversity and complexity, only the patients who had CD4 cell counts <100 cells/mm3 for more than 4 y were included in our study. The increased genetic diversity with increased CD4 cell counts may suggest that under CD4 cells’ immune-suppression, new HCV quasispecies are produced due to the high mutation rate. These new quasispecies are better able to survive due to immune escape. Our phylogenetic analysis results also support this hypothesis (data not shown). When CD4 cell counts were stable during the follow- up (patient 1), there was no tendency to form clusters with sampling time. No major new quasispecies appeared without a change of CD4 cells’ immune suppression. The emergence of new quasispecies was observed only after increasing CD4 cell counts, especially when the CD4 cell counts increased from <100 cells/mm3 to >400 cells/mm3 (data not show). Our study clearly indicates that the HCV genetic diversity of HVR1 was mainly driven by immune suppression exerted by CD4 cells and exacerbated by HCV replication error. When CD4 cell counts significantly increase in HIV/HCV co-infected patients with successful HAART, the restored CD4 cell immunity breaks the balance between HCV virus and host with the emergence of new viral quasispecies. A higher viral replication rate may aid in survival, also allowing the virus to escape the restored immunity, or avoid clearance from the body.
Finally, we observed an increased incidence of insertion and deletion of E1/E2 region in the HCV genome in one patient who failed to respond to HAART and died from progressive HCV. This is the first report of genomic insertion and deletions within the E1/E2 region of HCV temporally followed by large fragment deletions in this region in a patient who developed rapidly deteriorating hepatitis C. Whether these deletions are seen specifically in patients whose hepatitis C suddenly worsens with progressive HIV needs to be explored further in patients dying of progressive hepatitis C complicating HIV to better understand how such massive genomic deletions come about and to understand what role these deleted virions play in the progression of HCV liver disease.
Acknowledgments
Supported by funds from The North Shore University Hospital AIDS Awareness Committee and the Jane and Dayton T Brown Viral Laboratory, North Shore University Hospital, Manhasset NY.
REFERENCE
- 1.Farci P, Shimoda A, Coiana A, Diaz G, Peddis G, Melpolder JC, et al. The outcome of acute hepatitis C predicted by the evolution of the viral quasispecies. Proc Natl Acad Sci USA 2002;99:3081–3086. [DOI] [PubMed] [Google Scholar]
- 2.Sherman KE, Rouster SD, Chung RT, Rajicic N. Hepatitis C virus prevalence among patients infected with human immunodeficiency virus: A cross-sectional analysis of the US adult AIDS Clinical Trials Group. Clin Infect Dis 2002;34(6):831–837. [DOI] [PubMed] [Google Scholar]
- 3.Benhamou Y, Di Martino V, Bochet M, Colombet G, Thibault V, Liou A, Katlama C, et al. MultivirC Group. Factors affecting liver fibrosis in human immunodeficiency virus-and hepatitis C virus-coinfected patients: Impact of protease inhibitor therapy. Hepatology 2001;34(2):283–287. [DOI] [PubMed] [Google Scholar]
- 4.Benhamou Y, Bochet M, Di Martino V, Charlotte F, Azria F, Coutellier A, et al. Liver fibrosis progression in human immunodeficiency virus and hepatitis C virus coinfected patients. The MultivirC Group. Hepatology 1999;30(4):1054–1058. [DOI] [PubMed] [Google Scholar]
- 5.Center for Disease Control and Prevention. 1999 USPHS/IDSA guideline for the prevention of opportunistic infection in persons infected with human immunodeficiency virus: Disease-specific recommendations. USPHS/IDSA Prevention of Opportunistic Infectious Working Group. U.S. Public Health Service/Infectious Disease Society of America. Morbid Mortal Wkly Rep 1999;48:1–82. [Google Scholar]
- 6.Cooper CL, Cameron DW. Interpretation of undetectable hepatitis C virus RNA levels in HIV–hepatitis C virus co-infection. AIDS 2004;18(2):337–338. [DOI] [PubMed] [Google Scholar]
- 7.Ginocchio CC, Wang XP, Kaplan MH, Mulligan G, Witt D, Romano JW, et al. Effects of specimen collection, processing, and storage conditions on stability of human immunodeficiency virus type 1 RNA levels in plasma. J Clin Microbiol 1997;35(11):2886–2893. [DOI] [PMC free article] [PubMed] [Google Scholar]
- 8.Farci P, Alter HJ, Govindarajan S, Wong DC, Engle R, Lesniewski RR, et al. Lack of protective immunity against reinfection with hepatitis C virus. Science 1992;258:135–140. [DOI] [PubMed] [Google Scholar]
- 9.Kwok S, Higuchi R. Avoiding false positives with PCR. Nature (London) 1989;39:237–238. [DOI] [PubMed] [Google Scholar]
- 10.Felsenstein J. PHYLIP—Phylogeny Inference Package (Version 3.2). Cladistics 1989;5:164–166. [Google Scholar]
- 11.Thompson J, Higgins D, Gibson T. CLUSTAL W: Improving the sensitivity of progressive multiple sequence alignment through sequence weighting, position-specific gap penalties and weight matrix choice. Nucleic Acids Res 1994;22:4673–4680. [DOI] [PMC free article] [PubMed] [Google Scholar]
- 12.Choo QL, Kuo G, Weiner AJ, Overby LR, Bradley DW, Houghton M. Isolation of a cDNA clone derived from a blood-borne non-A, non-B viral hepatitis genome. Science 1989;244:359–362. [DOI] [PubMed] [Google Scholar]
- 13.Plagemann PGW. Hepatitis C virus. Arch Virol 1991;120:165–180. [DOI] [PMC free article] [PubMed] [Google Scholar]
- 14.Resnick RH, Koff R. Hepatitis C–related hepatocellular carcinoma: Prevalence and significance. Arch Int Med 1993;153:1672–1677. [PubMed] [Google Scholar]
- 15.Misiani R, Bellavita P, Fenili D, Vicari O, Marchesi D, Sironi PL, et al. Interferon-2a therapy in cryoglobulinemia associated with hepatitis C virus. N Eng J Med 1994;330:751–756. [DOI] [PubMed] [Google Scholar]
- 16.Thiele DL. Implications of anti–hepatitis C reactivity in “autoimmune” chronic active hepatitis. Gastroenterology 1990;99:1531–1533. [DOI] [PubMed] [Google Scholar]
- 17.McFarlane BM, Bridger C, Tibbs CJ, Saleh MG, Fuzio A, Verucchi G, et al. Virus-induced autoimmunity in hepatitis C virus infections: A rare event. J Med Virol 1994;42:66–72. [DOI] [PubMed] [Google Scholar]
- 18.Bica I, McGovern B, Dhar R, Stone D, McGowan K, Scheib R, et al. Increasing mortality due to end-stage liver disease in patients with human immunodeficiency virus infection. Clin Infect Dis 2001;32:492–497. [DOI] [PubMed] [Google Scholar]
- 19.Babik J, Holodniy M. Impact of highly active antiretroviral therapy and immunologic status on hepatitis C virus quasispecies diversity in human immunodeficiency virus/hepatitis C virus-coinfected persons. J Virol 2003;77:1940–1950. [DOI] [PMC free article] [PubMed] [Google Scholar]
- 20.Roque-Afonso A, Robain M, Simoneau D, Rodriguez-Mathieu P, Gigou M, Meyer L, et al. Influence of CD4 cell counts on the genetic heterogeneity of hepatitis C virus in patients coinfected with human immunodeficiency virus. J Infect Dis 2002;185:728–733. [DOI] [PubMed] [Google Scholar]
- 21.Neau D, Jouvencel AC, Legrand E, Trimoulet P, Galperine T, Chitty I, et al. Hepatitis C virus genetic variability in 52 human immunodeficiency virus–coinfected patients. J Med Virol 2003;71(1):41–48. [DOI] [PubMed] [Google Scholar]
- 22.Simmons P. Genetic diversity and evolution of hepatitis C virus—15 years on. J Gen Virol 2004;85:3173–3188. [DOI] [PubMed] [Google Scholar]
- 23.Christie JML, Chapel H, Chapman RW, Rosenberg WM. Immune selection and genetic sequence variation in core and envelope regions of hepatitis C virus. Hepatology 1999;30(4):1037–1044. [DOI] [PubMed] [Google Scholar]


