

Abstract
A large study of combustion particle exposures for drivers of diesel-powered trucks was conducted in collaboration with an epidemiologic study of lung cancer outcomes for workers in the trucking industry. Three components of diesel exhaust combustion particles (PM2.5, elemental carbon, and organic carbon) were measured inside the driver cabs of diesel-powered trucks from 36 different trucking terminals across the United States between 2001 and 2005. In-cab particle exposures for drivers assigned to both short and long distance trips were observed, as well as information on the smoking status of the driver, truck characteristics such as age and model, and weather conditions during the sampling session. This article summarizes these findings and describes the relationship between exhaust particles and various determinants of exposure. The results suggest that in-cab particle exposures are positively related to smoking, ambient particle concentrations, truck age, and open windows, with other significant modifying factors such as weather. This study represents the largest and most comprehensive exposure assessment of drivers in the trucking industry, encompassing a 4-year period of observations on diesel and exhaust particle exposures nationwide. The results are relevant not only to the occupational group of truck drivers being examined but also to the general population that live, commute, or work within proximity to diesel-fueled traffic or trucking terminals.
Keywords: diesel, occupational health, PM, traffic, trucking industry
INTRODUCTION
Diesel exhaust contains respirable particles with mutagenic and carcinogenic compounds(1–2) and has been linked to increased risk of lung cancer mortality in more than 35 epidemiologic studies.(3–4) Of particular interest are the rates in occupational groups exposed to diesel exhaust, such as on-road drivers of diesel-powered trucks. Although epidemiologic studies illuminating the increased cancer risks are numerous, none of these studies have included detailed exposure assessments, and for this reason, the dose-response relationship remains uncertain.(5) Although multiple national and international health organizations have declared diesel exhaust to be a “probable” human carcinogen,(2,6–8) the lack of quantitative exposure data has been consistently cited as the fundamental problem in determining causality from the existing occupational health studies of diesel exposure.(3,9)
In an attempt to address this issue, a national exposure assessment of combustion particles has been performed to complement epidemiologic data on lung cancer mortality for workers in the U.S. trucking industry, including drivers (nondriver exposure models are presented elsewhere).(10–11) The epidemiologic study is being conducted with cooperation from the International Brotherhood of Teamsters and four large unionized trucking companies. This retrospective cohort study contains approximately 55,000 people working in 1985, whose lung cancer mortality experience has been determined through 2000. The exposure assessment is intended to provide data for the epidemiologic study, monitoring occupational exposures across the United States from the four trucking companies to define current exposure levels in the industry. These exposure estimates will help predict historical levels and assign cumulative exposures to members in the epidemiologic cohort. The ultimate goal of the study is to estimate lung cancer risk for this occupational group.
Airborne combustion particles inside and outside the truck cabs represent a complex mixture, and the components vary as a function of the sources. Three aspects of fine particulate matter were assessed that might together serve as indicators of exposure to diesel exhaust and other combustion products: mass of particles less than 2.5 μm in diameter (PM2.5), and elemental carbon (EC) and organic carbon (OC) in particles less than 1 μm in diameter (PM1).
METHODS
Driver exposures were measured at 36 truck freight terminals across the United States, sampling for a 1-week period at each terminal and visiting a new terminal approximately every month during 2001–2005. The terminal locations and time periods visited were generated randomly by a computer within predesignated regions of the United States to ensure the final sample was regionally representative of the approximately 150 eligible large trucking terminals (>100 employees) in the epidemiologic cohort. There are two general types of truck driving operations at each terminal:
local pick up and delivery (P&D) operations, and
long haul (LH), which transports trailers to and from terminals several hundred miles away.
Usually, P&D drivers work during the day and LH drivers work at night, although this is not uniformly the case.
Drivers were asked to perform their normal driving activities with a sampling box mounted in the cab to measure particle concentrations in their work environment. All drivers who volunteered for sampling gave informed consent and completed a short questionnaire about their work and smoking activities. The sampling protocol was approved by the Harvard School of Public Health Human Subject Committee.
The particle collectors, their pumps, and a real-time monitor for temperature and humidity (HOBO; Onset Computer Corp, Bourne, Mass.) were mounted in a box housing connected to an external battery and attached to the dashboard on the passenger side of the cab prior to the driver’s leaving on his assigned route; it was retrieved as soon as possible after his return. A picture of the monitor setup is provided in Figure 1. The average elapsed time for the integrated particle samples obtained from these boxes was 10.5 hr. Similar methods were used to measure ambient conditions at an upwind site along the perimeter of the trucking terminal from which the driver was dispatched.
FIGURE 1.
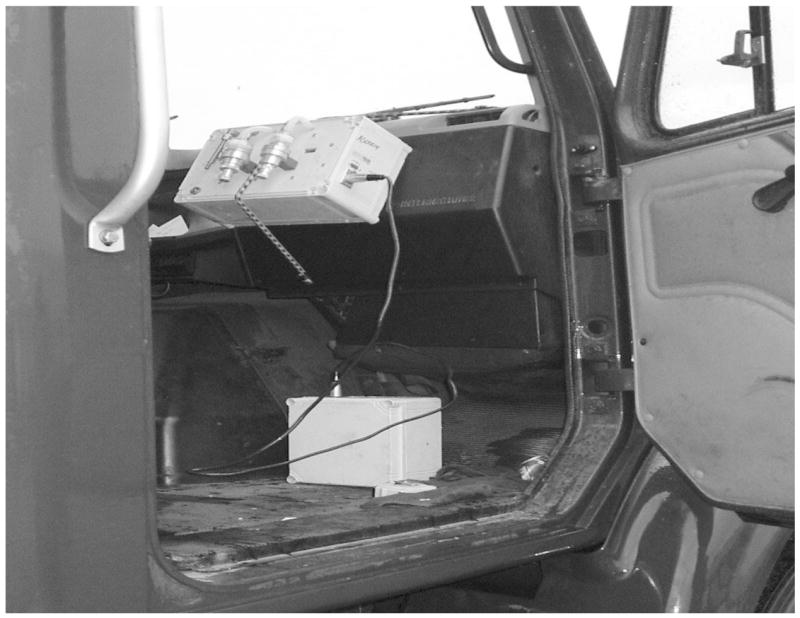
Sampler box setup in truck cab
To cross-validate measurements, PM2.5 and carbon monoxide (CO) data were collected from monitors in the Environmental Protection Agency (EPA) Aerometric Information Retrieval System (AIRS) network within a 50–100 km radius around each geocoded terminal address. Because of limited temporal coverage in the EPA monitoring network (collected only every other day), the AIRS data could not be matched directly with each individual driver route. For this reason, the radii of monitor values were averaged over the study week and compared with the average driver exposures from each sampling trip.
The LH trucks are generally equipped with air conditioning; however, P&D trucks are not air conditioned and are often driven with the windows open. Unfortunately, direct information was not collected from the driver on whether he had the window open or shut during the observed route; instead, window status based on a combination of in-cab CO2 concentrations and the indoor-outdoor temperature differential were estimated. It was hypothesized that the correlation between indoor and outdoor temperatures would be maximized when the window was open, and CO2 levels would be highest when the window was closed. Based on these assumptions, temperature and CO2 for P&D nonsmoking drivers (smoking would have artificially inflated CO2 levels in the cab) were analyzed.
In Figure 2, a clear cutoff point in the distribution of in-cab CO2 levels was distinguished, while the correlation between in-cab and ambient temperature observations was maximized at CO2 levels 700–800 ppm. Based on the combined information from the CO2 and temperature analysis, a cutoff point for open-shut windows at 750 ppm was approximated, with values below given the label “open” and values above given the label “shut.” Because this analysis was based on data from integrated samplers (session averages and not real-time data) when windows were partially open or closed during a session, a dichotomous variable (open/shut) would not accurately represent the relationship between window status and exposure. Unfortunately, these “partial” cases could not be clearly identified.
FIGURE 2.
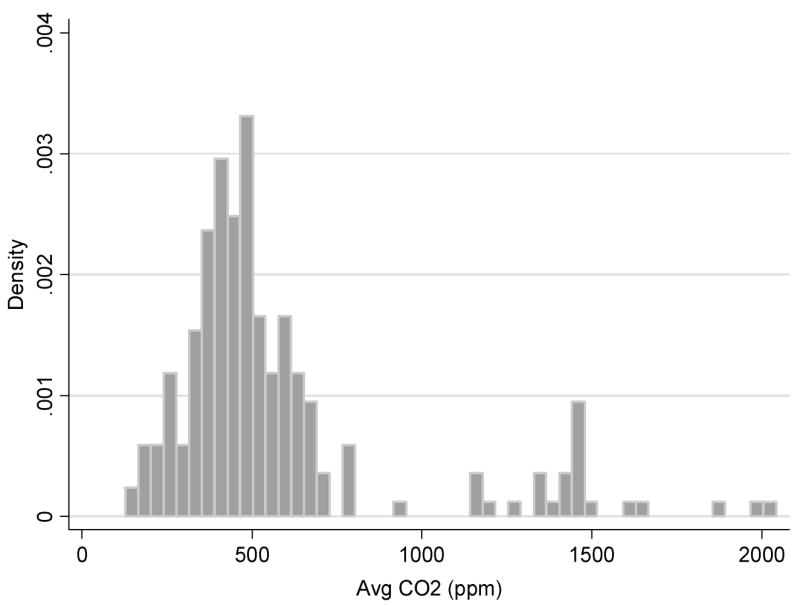
CO2 levels in nonsmoking P&D trucks. Note: Y-axis scales the height of the bars so that the sum of their areas equal one. Ambient average CO2 is equal to 360 ppm and Massachusetts indoor air standard of 650 ppm.(12)
PM2.5 was measured by collecting particles on a 37-mm Teflon filter, 0.2 μm diameter pore size, after passing through a precision machined cyclone separator (GK2.05SH [KTL]; BGI, Inc., Waltham, Mass.) to remove particles greater than 2.5 μm aerodynamic diameter. Mass collected on the filter was determined by gravimetric analysis using an analytical balance (Micro-Gravimetric No. M5; Mettler Instruments Corp., Hightstown, N.J.). The filters were preweighted after humidity equilibrium (temperature within 20–23°C and relative humidity 40 ± 5% for at least 48 hr) in a chamber. At the end of sampling, the filter was taken back to the laboratory and reweighed after humidity equilibrium to determine weight gain. This method using the KTL cyclone is equivalent to the EPA PQ200 Federal Reference Method.(13) EC and OC in PM1 were determined by NIOSH method 5040.(14) PM1 was collected on a 22-mm quartz tissue filter, preceded by a precision machined cyclone separator (SCC1.062 Triplex; BGI) to remove particles greater than 1.0 μm aerodynamic diameter.
The relationship between EC and mass of diesel emissions varies with operating conditions (other combustion sources also emit EC and OC). Lightly loaded and idling diesel emissions have low EC and high OC and are indistinguishable from general gasoline engine emissions.(15) However, EC in PM1 was chosen as the primary marker of diesel exposure because of interest in a marker of fresh diesel and other vehicle emissions before they had agglomerated into the accumulative mode of atmospheric aerosols. Measurements made during a feasibility study using side-by-side DustTrak samplers with PM2.5 and PM1 inlet impactors showed that the PM1 mass is normally 90–98% of the PM2.5 mass in the vehicle cabs.(16)
Moreover, EC is not a significant component of cigarette smoke (0.49%) and is a small component of gasoline car engine emissions (2–5 mg/km) and propane emissions when compared with heavy-duty truck engine emissions (early 1990s technology, 164 mg/km).(17) There was also an artifact associated with OC data where there was cigarette smoking. It is known that quartz fiber filters (used for EC + OC measurements) will adsorb polar hydrocarbon vapors from the airstream and cigarette smoke has a high concentration of polar vapors.(18,19) In those settings, the OC content frequently exceeded PM2.5.
All the statistical analyses were performed using STATA Version 8.2. The concentration data are not normally distributed, and summary statistics are presented for both the arithmetic and geometric means and standard deviations (Tables I–III). All data comparisons were made using nonparametric statistical tests (Spearman Rho, Wilcoxon rank sum, Kruskal-Wallis) unless otherwise noted. The 36 site visits yielded a total of 349 LH and 576 P&D observations for PM1 (EC and OC), and 334 LH and 545 P&D observations for PM2.5. Because PM2.5and PM1 were measured on separate filters, the differences in sample sizes were the result of losses that occurred on only one of the filters during a given session.
TABLE I.
EC Summary Statistics (in μ/gm3)
| Smoking Status
|
|||||||||
|---|---|---|---|---|---|---|---|---|---|
| Location
|
P & D
|
LH
|
Window Status
|
||||||
| P&D Drivers (N = 576) | LH Drivers (N = 349) | Terminal Background (N = 348) | Non-Smoker (N = 366) | Smoker (N = 111) | Non-Smoker (N = 173) | Smoker (N = 78) | Open (N = 193) | Shut (N = 173) | |
| Arithmetic | |||||||||
| Mean | 1.6 | 1.4 | 0.8 | 1.4 | 2.0 | 1.3 | 1.7 | 1.5 | 1.3 |
| SD | 2.3 | 0.8 | 1.0 | 1.1 | 1.9 | 0.7 | 0.9 | 1.7 | 0.9 |
| Geometric | |||||||||
| Mean | 1.2 | 1.1 | 0.5 | 1.1 | 1.3 | 1.1 | 1.4 | 1.2 | 1.0 |
| SD | 2.8 | 2.3 | 3.3 | 2.5 | 3.8 | 1.9 | 2.4 | 2.0 | 3.0 |
Notes: Using Wilcoxon rank sum tests, no significant differences were detected between driver types. Smoker exposures significantly higher than nonsmokers for all concentrations. Open windows significantly higher than closed windows for all concentrations. The geometric mean (GM) is an estimator of the median, and the geometric standard deviation (GSD) is a unitless multiplicative factor, e.g., one standard deviation above the GM is GM × GSD.
TABLE III.
PM2.5 Summary Statistics (in μ/gm3)
| Smoking Status
|
|||||||||
|---|---|---|---|---|---|---|---|---|---|
| Location
|
P & D
|
LH
|
Window Status
|
||||||
| P&D Drivers (N = 545) | LH Drivers (N = 334) | Terminal Background (N = 339) | Non-smoker (N = 348) | Smoker (N = 104) | Non-smoker (N = 160) | Smoker (N = 74) | Open (N = 168) | Shut (N = 180) | |
| Arithmetic | |||||||||
| Mean | 27.8 | 52.6 | 11.9 | 19.1 | 50.1 | 25.4 | 41.7 | 19.9 | 18.5 |
| SD | 39.0 | 327.7 | 8.7 | 11.5 | 51.1 | 19.1 | 45.3 | 11.5 | 11.5 |
| Geometric | |||||||||
| Mean | 20.1 | 23.1 | 8.9 | 16.2 | 36.5 | 19.3 | 32.8 | 17.2 | 15.3 |
| SD | 2.1 | 2.5 | 2.4 | 1.8 | 2.4 | 2.3 | 3.2 | 1.7 | 1.9 |
Notes: Using Wilcoxon rank sum tests, no significant differences were detected between driver types. Smoker exposures significantly higher than nonsmokers for all concentrations. Open windows significantly higher than closed windows for all concentrations. The geometric mean (GM) is an estimator of the median, and the geometric standard deviation (GSD) is a unitless multiplicative factor, e.g., one standard deviation above the GM is GM × GSD.
There were missing data across the various predictors of in-cab exposures, including substantial missing data on smoking and vehicle characteristics, and no observed data for window status. These missing data complicated the use of multiple regression techniques, and for this reason, the impact of the predictors are estimated and discussed individually. Future site visits will include a revised sampling plan to fill in these data gaps, and the observations on the individual effects will be cross-validated with the newly collected data in a multiple regression context.
RESULTS AND DISCUSSION
Summary statistics of particle concentrations observed in driver cabs are presented in Tables I–III by job description, smoking, and predicted window status, as well as the ambient conditions observed at the home terminal during the sampling trips. Observed levels are low by comparison with a similar study of the industry done in the 1980s(20) that used identical analytical methods and sampling protocol to collect EC and PM2.5 at six large U.S. trucking terminals. During the earlier time period, in-cab EC concentrations were much higher (P&D: GM = 4.0, GSD = 2.0; LH GM = 3.8, GSD = 2.3) compared with the levels observed in the present study (P&D: GM = 1.2, GSD = 2.8; LH GM = 1.1, GSD = 2.3). This is likely the result of the downward trend in ambient PM over time, as well as the changing regulatory environment imposing restrictions on fuel composition, idling, vehicle type, etc.
The following results describe the individual factors related to driver exposures: smoking, job description, ambient conditions, window status (up or down), weather, and vehicle characteristics.
Smoking
Tables I–III present the summary statistics by smoking status for the two groups of drivers. Smokers were exposed to significantly higher particle concentrations than nonsmokers for both P&D and LH drivers (p < 0.05 for EC, and p < 0.01 for OC and PM2.5), with the largest effect on OC and PM2.5. The geometric means (Tables I–III) show an approximate doubling of OC and PM2.5 concentrations due to smoking in the truck cabs, while the ratio is much closer to one (no effect) for EC. The latter result is consistent with similar studies showing only a small fraction of EC in cigarette smoke.(20)
Differences by Job Description
Summary statistics by P&D and LH drivers are shown in Tables I–III. There were no significant differences in particle exposures across the two driver groups, with the exception of significantly higher OC and PM2.5 concentrations in the subset of nonsmoking LH drivers compared with nonsmoking P&D drivers (p < 0.01). Although the explanation behind this difference remains unclear, it may be attributable in part to differences in traffic composition between interstate (LH) and intercity (P&D) driving, as well as to increased idling time for LH drivers.
Correlation with Ambient Particle Concentrations
Table IV lists the correlation coefficients relating in-cab particle measurements to observed terminal background conditions, as well as EPA AIRS measurements of PM2.5 and CO within a 50–100 km radius of the terminal (not route specific). In-cab particle concentrations were significantly correlated (r = 0.2–0.5; p < 0.01) with background concentrations measured upwind at the driver’s home terminal during that same period. Because P&D drivers remain more local, the association between terminal background and in-cab measurements was stronger for P&D drivers (r = 0.4–0.5; p < 0.01) than for LH drivers (r = 0.2–0.4; p < 0.01). The results also show that the AIRS PM2.5 data is more closely related to in-cab PM2.5 and OC concentrations than it is to in-cab EC levels, while the in-cab EC levels are more highly correlated with the AIRS CO data.
TABLE IV.
Spearman Rho Correlations for EPA AIRS Data and Observed Particle Concentrations
| Terminal Background Value
|
LH Personal SamplesA |
P&D Personal SamplesA |
|||||||
|---|---|---|---|---|---|---|---|---|---|
| EC | OC | PM2.5 | EC | OC | PM2.5 | EC | OC | PM2.5 | |
| Terminal background value | 0.2 | 0.4 | 0.3 | 0.5 | 0.4 | 0.4 | |||
| Mean AIRS PM2.5 within 50 km | 0.4 | 0.6 | 0.8 | 0.2 | 0.3 | 0.3 | 0.1 | 0.4 | 0.4 |
| Mean AIRS PM2.5 within 100 km | 0.3 | 0.5 | 0.7 | 0.2 | 0.3 | 0.3 | 0.1NS | 0.3 | 0.4 |
| Mean AIRS CO within 50 km | 0.5 | 0.3 | 0.1 | 0.4 | 0.1NS | 0.2 | 0.4 | 0.0NS | 0.1NS |
Notes: The top row correlates upwind terminal background values with personal samples matched by time and date. The other three rows correlate weekly means of study data with weekly means of AIRS data. Correlations not significant (p > 0.05) are subscripted with NS.
Nonsmoking drivers only.
Similar studies support this correlation between EC and CO, pointing to traffic as the common source for both pollutants.(21–25) The correlation provides evidence that ambient CO is a better marker of EC than PM2.5, which has important implications for the reconstruction of historical exposures for this cohort. The relatively low correlations observed between in-cab measurements and the EPA monitors suggest that route-specific information is necessary to predict driver exposures more accurately. However, the evidence remains suggestive of a regional component to driver exposures that must be accounted for in a prediction model.
Truck Windows and Exposure
Summary statistics for particles based on the open-shut designation for nonsmoking P&D drivers are provided in Tables I–III. The results provide evidence of an external source for particle exposures, with higher concentrations when the windows are open (p < 0.01 for EC, p < 0.05 for OC and PM2.5). This is consistent with other findings in the literature showing increased particle concentrations from traffic exposures with open windows.(26–28)
Although the LH in-cab CO2 levels showed a similar distribution and cutoff point, the relationships between a dichotomized open-shut status were not significant (not shown). This is not surprising given the modifying effect of air-conditioning systems in the LH trucks. However, these results are subject to misclassification of exposures, since direct observations were not made on window status. For this reason, future site visits will include a revised sampling plan to collect this information that will be used to cross-validate the findings from the less rigorous method of estimating window status using CO2 and the indoor-outdoor temperature differential.
Weather
Weather data on wind speed, relative humidity, precipitation, temperature, and barometric pressure were observed from the closest monitoring station to the main terminal and matched to the specific sampling time periods using an online source (Weather Underground, Inc., Ann Arbor, Mich.). The weather variables from this source correlated very highly (r > 0.9; p < 0.01) with a limited set of weather observations made by our on-site weather station and were representative of weather conditions at the base terminal during the driver shift. These weather indicators were not significantly related to OC and PM2.5.
However, average wind speed and temperature were both significantly related to in-cab EC concentrations. Increasing temperature, which is likely a surrogate for window status for P&D drivers since there is not a large seasonal component to ambient PM, had a significant and positive effect on EC concentrations (r = 0.1; p < 0.01). Wind speed was negatively correlated with in-cab EC concentrations (r = −0.4; p < 0.01), which is similar to other findings in the literature showing faster winds associated with increased dispersal rates and lower particle concentrations.(29–33)
Vehicle Characteristics
Vehicle characteristics were obtained on some of the trucks sampled, including production year, make, and model. Although make and model did not have a significant effect on in-cab particle concentrations, EC levels were significantly impacted by truck age (R2 = 0.34; p < 0.01). This relationship is displayed in Figure 3 for the subset of P&D drivers with the median EC value graphed by production year (group medians are more representative of the central tendency due to the non-normality of exposure data). This relationship suggests that seepage of diesel exhaust into the truck cab worsens with age (older production years) due to leaks from the cab’s rubber seals that allow exhaust from the engine compartment to enter the cab.(11)
FIGURE 3.
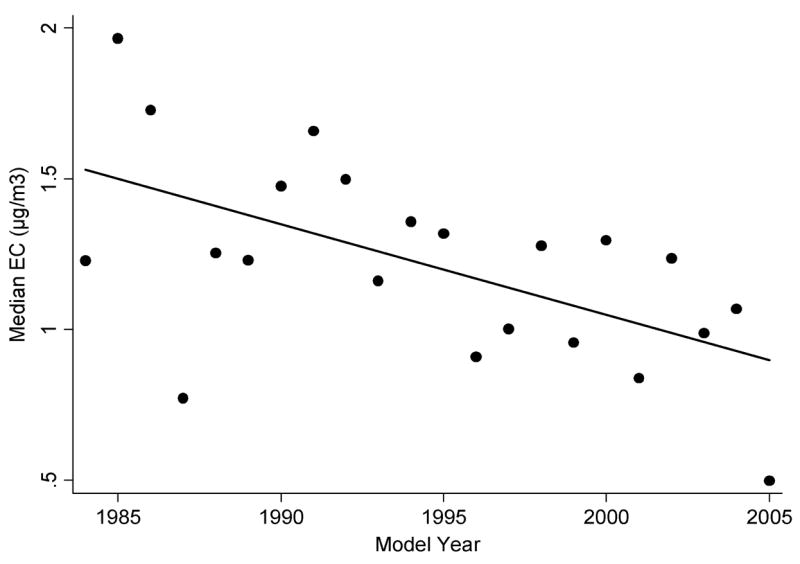
P&D driver median EC by truck model year
Limitations
Much of the data on smoking and window status are missing, which complicated the modeling effort. There is also no route-specific information for the majority of the samples, including locations traveled, number of stops, traffic conditions, etc. This information is necessary to match background conditions with the individual driver routes more closely. For example, a driver will not stay neatly within a given radius of a terminal but will likely exit this radius and drive in one general direction. This has been verified with a limited set of GPS data collected from drivers, suggesting that the use of average location characteristics around the home terminal to predict driver exposures is subject to a high degree of exposure misclassification. For this reason, future sampling efforts will include more GPS tracking units and real-time particle exposure monitors in the vehicle samples, and traffic information will be solicited from drivers immediately following their return to the terminal. This data will allow investigators to match speed, acceleration, elevation, and location with the various exposure peaks and spikes apparent in the real-time data to determine their causes more accurately.
CONCLUSION
This occupational study of combustion particle exposures of U.S. truck drivers is the largest and most comprehensive of its kind. The results provide evidence to suggest that driver exposures were significantly impacted by a number of individual factors, including smoking status, ambient particle concentrations, truck age, window status, and weather characteristics in a series of univariate analyses. These results highlight a number of interesting relationships important to understanding on-road truck driver exposures, although missing and nonmatched data make it necessary to further refine the dataset before making predictions of driver exposure. Further use of real-time and GPS tracking units in the trucks will fill these data gaps and permit better linkage with ambient exposures and traffic patterns on a given route, which will help build a more comprehensive model of driver exposures using multiple regression techniques.
TABLE II.
OC Summary Statistics (in μ/gm3)
| Smoking Status
|
|||||||||
|---|---|---|---|---|---|---|---|---|---|
| Location
|
P & D
|
LH
|
Window Status
|
||||||
| P&D Drivers (N = 576) | LH Drivers (N = 349) | Terminal Background (N = 348) | Non- smokern (N = 366) | Smoker (N = 111) | Non- smoker (N = 173) | Smoker (N = 78) | Open (N = 193) | Shut (N = 173) | |
| Arithmetic | |||||||||
| Mean | 18.5 | 21.3 | 5.3 | 13.6 | 33.5 | 17.5 | 32.3 | 13.9 | 13.2 |
| SD | 18.8 | 17.1 | 3.0 | 6.3 | 35.4 | 8.8 | 29.5 | 5.9 | 6.7 |
| Geometric | |||||||||
| Mean | 14.8 | 18.0 | 4.6 | 12.4 | 24.2 | 15.8 | 25.7 | 12.9 | 11.9 |
| SD | 1.8 | 1.7 | 1.7 | 1.5 | 2.1 | 1.6 | 1.9 | 1.5 | 1.6 |
Notes: Using Wilcoxon rank sum tests, no significant differences were detected between driver types. Smoker exposures significantly higher than nonsmokers for all concentrations. Open windows significantly higher than closed windows for all concentrations. The geometric mean (GM) is an estimator of the median, and the geometric standard deviation (GSD) is a unitless multiplicative factor, e.g., one standard deviation above the GM is GM × GSD.
Acknowledgments
We would like to acknowledge the contribution of the other members of the Trucking Industry Particle Study: Drs. Douglas W. Dockery and Frank E. Speizer, and to Kevin Lane and Jonathan Natkin for excellent field work and technical data support. We would also like to thank the International Brotherhood of Teamsters Safety and Health Dept. (LaMont Byrd) and the participating companies.
This work was supported by grants from the National Institutes of Health and the Health Effects Institute.
Footnotes
Publisher's Disclaimer: Full terms and conditions of use: http://www.informaworld.com/terms-and-conditions-of-access.pdf This article maybe used for research, teaching and private study purposes. Any substantial or systematic reproduction, re-distribution, re-selling, loan or sub-licensing, systematic supply or distribution in any form to anyone is expressly forbidden. The publisher does not give any warranty express or implied or make any representation that the contents will be complete or accurate or up to date. The accuracy of any instructions, formulae and drug doses should be independently verified with primary sources. The publisher shall not be liable for any loss, actions, claims, proceedings, demand or costs or damages whatsoever or howsoever caused arising directly or indirectly in connection with or arising out of the use of this material.
References
- 1.Environmental Protection Agency (EPA) Health Assessment Document for Diesel Engine Exhaust (EPA/600/8-90/057F) Washington, D.C.: National Center for Environmental Assessment; 2002. [Google Scholar]
- 2.Schenker MB. Diesel exhaust—An occupational carcinogen? J Occup Med. 1980;22:41–46. [PubMed] [Google Scholar]
- 3.Bhatia R, Lopipero P, Smith AH. Diesel exhaust exposure and lung cancer. Epidemiology. 1998;9(1):84–91. [PubMed] [Google Scholar]
- 4.Lipsett M, Campleman S. Occupational exposure to diesel exhaust and lung cancer: A meta-analysis. Am J Public Health. 1999;89:1009–1017. doi: 10.2105/ajph.89.7.1009. [DOI] [PMC free article] [PubMed] [Google Scholar]
- 5.Stayner L, Bailer AJ, Smith R, Gilbert S, Rice F, Kuempel E. Sources of uncertainty in dose-response modeling of epidemiological data for cancer risk assessment. Ann NY Acad Sci. 1999;895:212–222. doi: 10.1111/j.1749-6632.1999.tb08087.x. [DOI] [PubMed] [Google Scholar]
- 6.International Agency for Research on Cancer (IARC) Monographs on the Evaluation of Carcinogenic Risks to Humans. Vol. 46. Lyon, France; IARC: 1989. Diesel and gasoline engine exhausts and some nitroarenes. [PMC free article] [PubMed] [Google Scholar]
- 7.Health Effects Institute (HEI) Diesel Exhaust: A Critical Analysis of Emissions, Exposure and Health Effects. Cambridge, Mass.: Diesel Working Group, HEI; 1995. [Google Scholar]
- 8.World Health Organization (WHO) Environmental Health Criteria. Vol. 171. Geneva: WHO; 1996. Diesel fuel and exhaust emissions. [Google Scholar]
- 9.Health Effects Institute (HEI) Health Effects Institute. Cambridge, Mass.: Diesel Epidemiology Working Group, HEI; 2002. Research Directions to Improve Estimates of Human Exposure and Risk from Diesel Exhaust. [Google Scholar]
- 10.Davis ME, Smith TJ, Laden F, Hart JE, Ryan L, Garshick E. Modeling particulate exposure in the U.S. trucking industry. Environ Sci Technol. 2006;40(13):4226–4232. doi: 10.1021/es052477m. [DOI] [PMC free article] [PubMed] [Google Scholar]
- 11.Smith TJ, Davis ME, Reaser P, et al. Overview of particulate exposures in the U.S. trucking industry. J Environ Monitor. 2006;8:711–720. doi: 10.1039/b601809b. [DOI] [PMC free article] [PubMed] [Google Scholar]
- 12.DiNardi SR, editor. The Occupational Environment Its Evaluation and Control. Fairfax, Va.: American Industrial Hygiene Association; 1997. [Google Scholar]
- 13.Yanosky J, MacIntosh D. A comparison of four gravimetric fine particle sampling methods. J Air Waste Manage Assoc. 2001;51:878–884. doi: 10.1080/10473289.2001.10464320. [DOI] [PubMed] [Google Scholar]
- 14.National Institute for Occupational Safety and Health (NIOSH) Diesel Particulate Matter (as Elemental Carbon), Method 5040 by M. Eileen Birch. In: Schlecht PC, O’Connor PF, editors. NIOSH Manual of Analytical Methods (NMAM) Vol. 4. Aug, 1994. DHHS (NIOSH) Pub. No. 94–113. [Google Scholar]
- 15.Schauer JJ. Evaluation of elemental carbon as a marker for diesel particulate matter. J Expo Anal Environ Epidemiol. 2003;13(6):443–453. doi: 10.1038/sj.jea.7500298. [DOI] [PubMed] [Google Scholar]
- 16.Garshick E, Smith TJ, Laden F. Quantitative Assessment of Lung Cancer Risk from Diesel Exhaust Exposure in the U.S. Trucking Industry: A Feasibility Study. Cambridge, Mass.: Health Effects Institute; 2002. [Google Scholar]
- 17.National Institute for Occupational Safety and Health (NIOSH) Carcinogenic Effects of Exposure to Diesel Exhaust (Current Intelligence Bulletin 50) Cincinnati, Ohio: Division of Standards Development and Technology Transfer, NIOSH; 1988. [Google Scholar]
- 18.Olson DA, Norris GA. Sampling artifacts in measurement of elemental and organic carbon: Low-volume sampling in indoor and outdoor environments. Atmos Environ. 2005;39(30):5437–5445. [Google Scholar]
- 19.Turpin BJ, Huntzicker JJ, Hering SV. Investigation of organic aerosol sampling artifacts in the Los Angeles Basin. Atmos Environ. 1994;28(19):3061–3071. [Google Scholar]
- 20.Zaebst DD, Clapp DE, Blade LM, et al. Quantitative determination of trucking industry workers’ exposures to diesel exhaust particles. Am Ind Hyg Assoc J. 1991;52:529–541. doi: 10.1080/15298669191365162. [DOI] [PubMed] [Google Scholar]
- 21.Baumgardner D, Raga G, Peralta O, et al. Diagnosing black carbon trends in large urban areas using carbon monoxide measurements. J Geophysical Res. 2002;107(D21):8342–8351. [Google Scholar]
- 22.Chen LWA, Doddridge BG, Dickerson RR, et al. Seasonal variations in elemental carbon aerosol, carbon monoxide and sulfur dioxide: Implications for sources. Geophys Res Lett. 2001;28(9):1711–1714. [Google Scholar]
- 23.Gray HA, Cass GR, Huntzicker JJ, Heyerdahl EK, Rau JA. Elemental and organic carbon particle concentrations: A long-term perspective. Sci Total Environ. 1984;36:17–25. doi: 10.1021/es00148a006. [DOI] [PubMed] [Google Scholar]
- 24.Jennings SG, Spain TG, Doddridge BG, Maring H, Kelly BP, Hansen ADA. Concurrent measurements of black carbon aerosol and carbon monoxide at Mace Head. J Geophys Res. 1996;101(D14):19447–19454. [Google Scholar]
- 25.Lincoln DR, Rubin ES. Contribution of mobile sources to ambient particulate concentrations in a downtown urban area. J Air Pollut Control Assoc. 1980;30:777–781. [Google Scholar]
- 26.Behrentz E, Sabin L, Winer AM, et al. Relative importance of school bus-related microenvironments to children’s pollutant exposure. J Air Waste Manage Assoc. 2005;55:1418–1430. doi: 10.1080/10473289.2005.10464739. [DOI] [PubMed] [Google Scholar]
- 27.Fruin SA, Winer AM, Rodes CE. Black carbon concentrations in California vehicles and estimation of in-vehicle diesel exhaust particulate matter exposures. Atmos Environ. 2004;38(28):4123–4133. [Google Scholar]
- 28.Sabin LD, Kozawa K, Behrentz E, et al. Analysis of real-time variables affecting children’s exposure to diesel-related pollutants during school bus commutes in Los Angeles. Atmos Environ. 2005;39(29):5243–5254. [Google Scholar]
- 29.Hitchins J, Morawska L, Wolff R, Gilbert D. Concentrations of submicrometer particles from vehicle emissions near a major road. Atmos Environ. 2000;34(20):51–69. [Google Scholar]
- 30.Morawska L, Thomas S, Gilbert D, Greeaway C, Rijnders E. A study of the horizontal and vertical profile of submicrometer particles in relation to a busy road. Atmos Environ. 1999;33(8):1261–1274. [Google Scholar]
- 31.Wrobel A, Rokita E, Maenhaut W. Transport of traffic-related aerosols in urban areas. Sci Total Environ. 2000;257(2–3):199–211. doi: 10.1016/s0048-9697(00)00519-2. [DOI] [PubMed] [Google Scholar]
- 32.Zhu Y, Hinds WC, Kim S, Shen S, Sioutas C. Study of ultrafine particles near a major highway with heavy-duty diesel traffic. Atmos Environ. 2002;36(27):4323–4335. [Google Scholar]
- 33.Zhu Y, Hinds WC, Kim S, Sioutas C. Concentration and size distribution of ultrafine particles near a major highway. J Air Waste Manage Assoc. 2002;52:1032–1042. doi: 10.1080/10473289.2002.10470842. [DOI] [PubMed] [Google Scholar]