Abstract
Single large-conductance calcium-activated K+ (BK) channels encoded by the mSlo gene usually have synchronous gating, but a Drosophila dSlo (A2/C2/E2/G5/10) splice variant (dSlo1A) exhibits very flickery openings. To probe this difference in gating, we constructed a mutant I323T. This channel exhibits four subconductance levels similar to those of dSlo1A. Rectification of the single-channel current-voltage relation of I323T decreased as [Ca2+ ]in increased from 10 to 300 μM. Mutagenesis suggests that the hydrophobicity of the residue at the position is important for the wild-type gating; i.e., increasing hydrophobicity prolongs open duration. Molecular dynamics simulation suggests that four hydrophobic pore-lining residues at position 323 of mSlo act cooperatively in a “shutter-like” mechanism gating the permeation of K+ ions. Rate-equilibrium free energy relations analysis shows that the four I323 residues in an mSlo channel have a conformation 65% similar to the closed conformation during gating. Based on these observations, we suggest that the appearance of rectification and substates of BK-type channels arise from a reduction of the cooperativity among these four residues and a lower probability of being open.
INTRODUCTION
Large-conductance Ca2+- and voltage-activated potassium (BK) channels encoded by the Slo1 gene are widely distributed in many tissues. They are involved in diverse physiological functions such as smooth muscle contraction, neurotransmitter release, regulation of secretion in endocrine cells, and cochlear hair-cell tuning (1–14). Although the BK channels resemble the voltage-gated K+ channels in structure, the different orthologs such as those from mouse (mSlo) and Drosophila (dSlo) differ in many aspects of gating, including channel open time, conductance, and voltage dependence (15–18). The mechanism underlying the different phenotypes has not been fully understood. It has been known that two negatively charged glutamate residues at the entrance of the intracellular vestibule double the single-channel conductance of the Slo1 channels (19,20). Similarly, an acidic aspartate residue near the signature sequence GYG also increases the ionic conductance of the channels (21). The auxiliary β-subunits can induce rectification of currents in mSlo channels (22). Wei et al. (23) reported that an alternative splice variant of the dSlo family (dSlo1A) from Drosophila could have subconductance levels induced by the core. More recently, we found that the residue I323 in mSlo interacts with the inactivation domain of the auxiliary hβ2 subunits and that the mutant mSlo-I323A could cause a flickery opening as seen with dSlo1A (24).
To understand the rectification and substate mechanisms of the Slo channels, we studied another mSlo mutant, I323T. The mutant mSlo-I323T exhibited a similar flickery opening to dSlo1A and an outward rectification dependent on the intracellular Ca2+ concentration. However, the rectification appeared to differ from that induced by the charged rings or the extracellular segment of hβ-subunits (20,22). Based on the sequence alignment (Fig. 1 A), two dSlo mutants, dSlo1A-T337I and dSlo1B-I337T, confirmed that the I337 residue in dSlo1 was necessary to maintain the long single-channel opening of the BK-type channels. To explore the function of the mSlo-I323/dSlo-I337 residue, a series of mutations were constructed at position 323 of mSlo. The hydrophobicity at the position was responsible for subconductance and rectification of the channel. Furthermore, because I323 is the last pore-lining residue in S6 (25), it would be interesting to know whether it plays a role in gating.
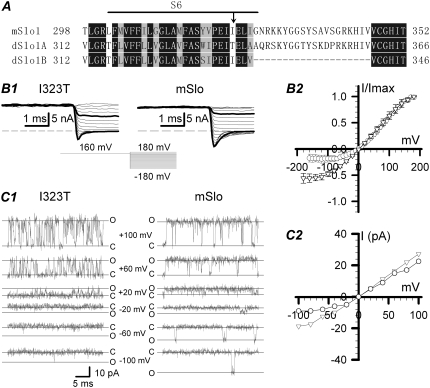
FIGURE 1.
The kinetic characteristics of both the instantaneous and single-channel currents in the mSlo and mutant I323T. (A) Sequence alignment within the pore region of mSlo, dSlo (A2, C2, E2, G5, 10) splice variant (dSlo1A) (1,23) and dSlo1B (NM_001014653). The horizontal line indicates the S6 segment predicted as the pore region. The next 20 amino acids after S6 form the linker in BK-type channels. Identical residues are boxed in dark gray, and similar amino acid residues in light gray. The arrowhead in the S6 domain indicates the mutated amino acids used in this study. (B1) Traces show instantaneous currents obtained from the inside-out patches from Xenopus laevis oocytes injected with cRNA encoding the mSlo (right, n = 5) or its mutant I323T (left, n = 7), separately. Currents were activated by a voltage step to +160 mV, followed by steps to potentials from −180 mV to +160 mV in 10-mV increments, in symmetrical 160 mM K+ solutions with 10 μM intracellular Ca2+. The voltage protocol is shown at the bottom middle. Traces in thick black lines represent currents at +100 and −100 mV, respectively. (B2) The normalized amplitudes of instantaneous currents (± SD) are plotted as a function of voltages for mSlo (▿) and I323T (○). (C1) The representative single-channel currents of mSlo and I323T were obtained at +100, +60, +20, 0, −20, −60, and −100 mV, respectively. All the single-channel recordings were digitized at 20 kHz and filtered at 10 kHz. Solid lines labeled with “c” or “o” represent the closed and open levels, respectively. (C2) The amplitudes of single-channel currents for mSlo (▿) and I323T (○) are plotted as functions of holding potentials.
Small energetic perturbations induced by single-site mutations generally give rise to linear rate-equilibrium free energy relations (REFERs), also called φ-values (26–28). REFER analysis provides structural information on reaction pathways between open and closed states. Moreover, in covalent reactions (29) and protein-folding reactions (30), substitutions at remote positions have large effects on φ-values. We carried out a similar analysis on the mSlo BK channels by perturbing the residue I323. Our data show that the structural characteristic of I323 is a hybrid with ∼35% open-like and 65% closed-like states. To determine whether the last four residues form the gate in mSlo channels, a molecular dynamics (MD) simulation was conducted. The equilibrated structure suggests that the final four residues act as a shutter in channel gating, and their concerted action depends on their hydrophobic nature.
We conclude that the four I323 residues form a narrow gateway near the cytoplasmic mouth, the hydrophobicity of I323 residues enhances the cooperativity of BK-type subunits for channel opening, and rectification and subconductance arise from disruption of the cooperativity of the final four pore-lining residues in S6 of BK-type channels.
MATERIALS AND METHODS
Site-directed mutagenesis
All mutations of mSlo1 were generated through the polymerase chain reaction (PCR), and all constructs were verified by sequencing. The point mutations of mSlo1 were generated by a QuikChange protocol (Stratagene, La Jolla, CA). For example, PCR of mSlo1 was performed with mSlo as a template and a pair of complementary mutagenesis primers. The PCR mixture was then cut with the enzyme DpnI to digest the template mSlo1. After DpnI digestion, the PCR mixture was used to transform competent bacterial cells to amplify the mutant plasmid of mSlo1.
Expression in Xenopus oocytes
After DNA was linearized with MluI, SP6 RNA polymerase (Roche, Nutley, NJ) was used to synthesize cRNA for oocyte injection. From 3 to 24 h after harvest, stage V–VI Xenopus oocytes were injected with 18–36 nl RNAs (10–20 ng/ml) using the Drummond Nanoject II (Drummond Scientific, Broomall, PA). After injection, oocytes were maintained in ND-96 solution at 18°C. Currents were recorded 2–7 days after cRNA injection. ND-96 solution (pH 7.5) containing (in mM) 96 NaCl, 2 KCl, 1.8 CaCl2, 1 MgCl2, and 10 H+-HEPES, was supplemented with 2.5 sodium pyruvate, 100 IU/ml penicillin and 100 μg/ml streptomycin (incubation only).
Electrophysiology
All currents were recorded in excised patches at room temperature (22–25°C). Pipette resistance was typically 2–4 MΩ. The pipette solution contained the following (in mM): 160 MeSO3K, 10 H+-HEPES, and 2 MgCl2, adjusted to pH 7.0 with MeSO3H. High resistances seals were formed in the bath solution of ND-96. Intracellular solutions with different free Ca2+ were made by mixing 160 mM MeSO3K and 10 mM H+-HEPES with Ca(MeS)2 and 5 mM N-hydroxyethylenediaminetriacetic acid (HEDTA) (for 10 μM) or 5 mM EGTA (for 0 μM). Free Ca2+ was defined by the EGTAETC program (E. McCleskey, Vollum Institute, Portland, OR), with the pH adjusted to 7.0. During recording, solutions with or without tetraethylammonium (TEA, 10 mM) were puffed locally onto the outside-out patches via a puffer pipette containing seven solution tubes. Its tip (∼300 μm diameter) was located ∼120 μm from the inside-out patch. Conductance tests suggest that the solution around a patch under study was controlled by the application of a solution using a flow rate of 100 μl/min or greater. Chemicals were obtained from Sigma-Aldrich (St. Louis, MO).
Data analysis
Data were analyzed with IGOR (Wavemetrics, Lake Oswego, OR), Clampfit (Axon Instruments, Foster City, CA), SigmaPlot (SPSS Science, Chicago, IL), and QUB software package (State University of New York, Buffalo, NY).
The single-channel recordings were sampled with EPC-9 patch-clamp amplifier and PULSE and PULSEFIT software (HEKA Elektronic, Lambrecht/Pfalz, Germany) at 20 kHz and filtered to 3–10 kHz. Macroscopic currents were recorded at 3 kHz.
The single-channel currents were acquired, analyzed, and simulated with QUB software from SUNY at Buffalo (http://www.qub.buffalo.edu). Idealization was done using the segmentation k-means algorithm after digital low-pass filtering to 10 kHz. Kinetic modeling of the idealized intervals was done using the maximum interval likelihood method.
Similar to the open probability versus voltage relation in a closed-open two-state model, the open probability (Po) versus hydrophobicity (H) is a Boltzmann equation:
 |
(1) |
where Po is the channel open probability, H50 is the hydrophobicity of half-maximal channel open probability, pmax is the maximal open probability, and κ is the relevant slope factor characterizing the hydrophobicity dependence of mutants.
REFERs
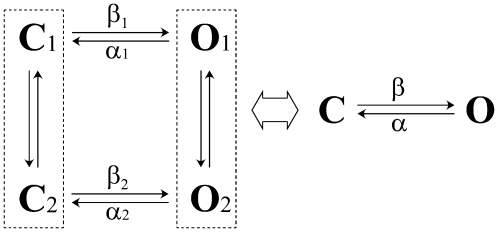
We determined the position of the transition state along the reaction coordinate using REFER analysis. The rate constant of the channel-opening reaction is plotted as a function of the gating equilibrium constant on a log-log plot. The slope of this plot, called φ, is related to the position of the transition state. High values of φ (i.e., close to 1) are consistent with an open-like transition state, whereas low values (i.e., close to 0) are consistent with a close-like transition state. The kinetic models used in REFER analysis are described in Scheme 1.
SCHEME 1.
 |
(2) |
Modeling and MD simulations
The homologous structure of the pore region of mSlo and I323T channels at the closed state was built using the structure of the KcsA channel (PDB code: 1BL8) as a template through the SWISSMODEL server (31), based on their high sequence identity in the S5-P-S6 region, and additional 8-ns MD simulations were performed on the model to get a sufficiently equilibrated structure.
In this study, calculations were performed using the Amber 8 program (32) on a 64-CPU Dawning TC4000L cluster (Beijing, China). To carry out more sufficient MD simulations, the generalized Born (GB) solvation model in macromolecular simulations (33) was used instead of explicit water, and the ff99 force field (Parm99) (34) was applied throughout the MD simulations. Before the unrestrained MD simulations were performed, we employed enough equilibration steps for 400 ps from a larger force constant, 5.0 (kcal/mol)/Å2, to restrain all heavy atoms and then gradually reduced it to 0.02 (kcal/mol)/Å2 for only heavy atoms in the backbone. Then ∼8-ns unrestrained GB-MD simulations were performed on the final channel conformations except residues located at the S5 and S6 segments restrained by a force constant of 0.02 (kcal/mol)/Å2, and the membrane environment was simplified in our work. The detailed MD simulation protocol has been reported in our previous work (35).
RESULTS
The residue I323 regulates the gating of mSlo BK-type channels
The residue I323 has been found to play a dual role in regulating the gating of mSlo BK channels and interacting with the inactivation domain of its auxiliary hβ2 subunits (24). For instance, the mutant I323A of mSlo induces an abnormal outward-rectifying current with a very brief opening. Similarly, Wei et al. (23) have reported that large-conductance Ca2+-activated potassium channels from Drosophila dSlo (A2, C2, E2, G5, 10) splice variant (dSlo1A) show a very flickery single-channel opening. After alternatively coexpressing the mSlo-tail with dSlo1A-core or the mSlo-core with dSlo1A-tail, they found that the core determined the open duration, the unitary conductance, and probably the voltage dependence, whereas the tail affected apparent Ca2+ sensitivity. In contrast, dSlo1B of the dSlo family has a long-lived single-channel opening like the wild-type mSlo channel.
To understand how the core of dSlo1A can affect the single-channel characteristics, we compared the sequences of mSlo dSlo1A and dSlo1B in the S6 pore region. Two distinct differences were found in that region (Fig. 1 A): unlike the hydrophobic residue I323 (mSlo) and I337 (dSlo1B), dSlo1A has a hydrophilic residue T337, and the dSlo1B lacks the 20-amino-acid linker after the S6 segment that results in the higher open probability (23,36). Thus, we deduced that the residue T337 might be critical for regulating the single-channel properties of dSlo1A channels. In other words, we predicted that the I323T (mSlo) mutant should exhibit short-lived single-channel openings as dSlo1A did.
Currents derived from both the wild-type mSlo and its mutant I323T (Fig. 1 B1) were activated by a voltage step to +160 mV, followed by steps to potentials from −180 mV to +160 mV in 10-mV increments, in symmetrical 160 mM K+ solutions with 10 μM intracellular Ca2+. The normalized instantaneous tail currents show that the I/V curves of I323T are less linear than those of mSlo (Fig. 1 B2). Traces in thick black lines were currents obtained at +100 and −100 mV. To measure rectification quantitatively, we define a rectification ratio RR = |I100/I−100|. Thus, the RR of I323T is 3.16 ± 0.33 (mean ± SD), and that of mSlo is 1.21 ± 0.08 (mean ± SD), suggesting that I323T has the stronger rectification than mSlo. I323T exhibited much larger instantaneous conductance at positive potentials than that at negative potentials. Therefore, the mutant I323T exhibits a rectified current significantly different from that of the wild-type mSlo channel. For both the mSlo and the I323T mutant, the single-channel currents were obtained at +100, +60, +20, 0, −20, −60, and −100 mV with 10 μM intracellular Ca2+ (Fig. 1 C1). The single-channel currents of mSlo-I323T showed a dSlo1A-like flickery characteristic (23), suggesting that the threonine substitution failed to maintain the channel opening as long as the wild-type isoleucine residue did. The single-channel I/V curves were plotted with the values of maximum single-channel currents measured by eye, ignoring rapid subopenings (Fig. 1 C2). The single-channel I/V curve of the mutant I323T displayed an outward rectification similar to the instantaneous I/V curve of the mutant I323T, which was clearly different from mSlo (Fig. 1, B2 and C2).
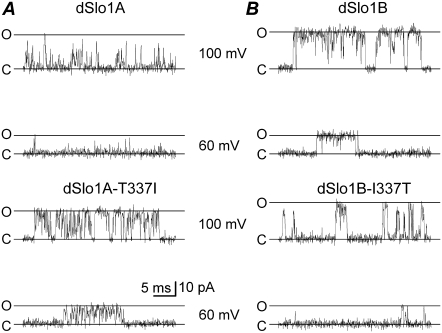
To determine whether the residue T337 of dSlo1A channel induced the flickery openings as Wei et al. reported (23), we made a dSlo1A mutant T337I (dSlo1A-T337I) to restore the long openings. Single-channel currents from the mutant channel exhibited burst-type activity and did not show as many flickery openings as the wild-type dSlo1A (Fig. 2 A). At +100 mV, the mean open dwell time of dSlo1A-T337I was about fourfold that of dSlo1A, whereas the mean open dwell time of the dSlo1B-I337T was ∼10% of that of dSlo1B (Fig. 2 B). Thus, the locus 323 in the mSlo, which corresponds to the locus 337 in both the dSlo1A and dSlo1B, are crucial in channel gating. The dSlo1B obviously showed much longer openings than dSlo1A-T337I, apparently because the open probability of dSlo1B was much higher. Now, we next examined why the mSlo-I323T caused brief openings, sublevels, and rectification.
FIGURE 2.
Single-channel currents among dSlo1A, dSlo1B, and their mutants. (A) The single-channel currents of dSlo1A and dSlo1A-T337I were obtained at both +100 mV and +60 mV, respectively, in the presence of 10 μM Ca2+. (B) The single-channel currents of dSlo1B and dSlo1B-I337T were obtained at both +100 mV and +60 mV, respectively, in the presence of 10 μM Ca2+. All the single-channel currents were filtered at 10 kHz. The solid lines labeled with “c” and “o” represent the closed and open levels, respectively. The mean open time constants of dSlo1A, dSlo1A-T337I, dSlo1B, and dSlo1B-I337T are, respectively, τopen = 0.09 ± 0.01 (n = 4), 0.32 ± 0.02 (n = 7), 4.36 ± 0.56 (n = 5), and 0.30 ± 0.07 (n = 4) at +100 mV.
High [Ca2+]in abolishes rectification of I323T
Brelidze et al. (20) reported that the charged (basic or acid) residues could alter the single-channel conductance. How the noncharged residue T323 in mutant mSlo-I323T altered the outward rectification of the channel was less obvious. Low-pass filtering can artificially reduce current sublevels and distort rectification. Therefore, we recorded single-channel data at 10 kHz to minimize filter-related distortions. Recording at higher bandwidth did not change the sublevel current amplitudes or rectification. However, we noticed that the number with the highest conductance level was reduced tremendously as the membrane potential went to the negative range (Fig. 1 C1).
The fact that the highest level of the low-opening channel was reduced or even missing at negative voltages suggested that we might restore it if we increased the channel-open probability by increasing intracellular calcium concentration.
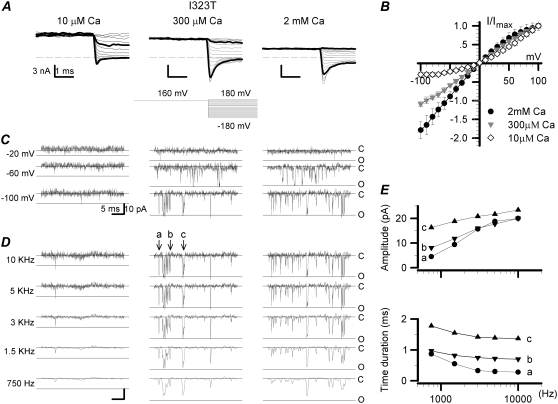
In a test of that hypothesis, relatively high intracellular Ca2+ solutions were used to negatively shift the activation curve of the mutant I323T or to increase the open probability of I323T at negative voltages. Compared with the activation curve in 10 μM Ca2+, we expected that it would shift negatively by 40 mV in 300 μM Ca2+ and 80 mV in 2 mM Ca2+ (37). With increasing intracellular Ca2+ concentration, the instantaneous currents at negative potentials became much larger (Fig. 3 A). From the normalized instantaneous I/V plots of the mutant I323T, the RRs were 3.16 ± 0.33, 0.92 ± 0.04, and 0.56 ± 0.12 (mean ± SD) with intracellular 10 μM, 300 μM, and 2 mM Ca2+, respectively (Fig. 3 B). A ratio <1 probably indicates a block by Ca2+ at high positive voltages. Single-channel open time of I323T increased with increasing [Ca2+]in and was most noticeable at membrane potentials more negative than −60 mV (Fig. 3 C). The highest-level openings at negative potentials occurred much more often in [Ca+2]in ≥ 300 μM Ca2+ than in 10 μM Ca2+. In other words, the maximum conductance of I323T at −100 mV was the same as one of the mSlo α alone (∼21.5 ± 1.0 pA at −100 mV). The outward rectification of I323T disappeared at high intracellular calcium concentrations.
FIGURE 3.
Characteristics of both the instantaneous and single-channel currents of the mutant I323T at higher intracellular Ca2+. (A) The instantaneous currents of I323T were recorded from an inside-out patch in symmetric 160 mM K+ solutions with intracellular 10 μM, 300 μM, and 2 mM Ca2+, respectively. The voltage protocol is plotted at the bottom middle. Traces in thick black lines represent currents at +100 and −100 mV, respectively. The dashed lines are zero currents. (B) The normalized instantaneous currents of I323T (± SD) are plotted against voltages in the presence of 10 μM, 300 μM, and 2 mM Ca2+, respectively. (C) Traces of the I323T single-channel currents were obtained at −20, −60, and −100 mV, in the presence of 10 μM, 300 μM, and 2 mM Ca2+, respectively. The single-channel currents were filtered at 10 kHz. Solid lines labeled with “c” and “o” represent the closed and open levels, respectively. (D) The representative single-channel currents of the mutant I323T were recorded at −100 mV in 10 μM, 300 μM, and 2 mM Ca2+ and filtered at 10 kHz, 5 kHz, 3 kHz, 1.5 kHz, and 750 Hz (Gaussian low-pass filter; −3 dB) as indicated. Arrowheads with letters “a,” “b,” and “c” indicate three full-open events with different open-time durations. (E) The amplitude (upper) and the open time duration (lower) of events in “a” (•), “b” (7), and “c” (6) are plotted with filtering frequencies. The open-time durations were measured from the roots of pulses, and the amplitudes from the peaks of pulses. At 10 kHz, 5 kHz, 3 kHz, 1.5 kHz, and 750 Hz, the values of amplitude (in pA)/open time duration (in ms) are, for “a,” 20.0/0.28, 18.8/0.30, 15.7/0.33, 9.4/0.55, and 4.5/0.87; for “b,” 20.0/0.70, 17.7/0.72, 16.0/0.75, 11.8/0.82, and 8.1/0.97; for “c,” 23.4/1.37, 21.7/1.39, 20.8/1.42, 18.8/1.55, and 16.3/1.78, respectively.
We further measured the amplitudes of brief openings under various filtering frequencies to examine the effects of filtering (Fig. 3 C). Three different full-open events recorded at −100 mV were used to assess the frequency-dependent effect (Fig. 3 D). There was no reduction in current amplitude as long as the filter setting was >1.5 kHz. In addition, recording at high bandwidth (10 kHz) did not increase the peak amplitude either (Fig. 3 E). Thus, the filtering setting is not a factor in the analysis provided the filtering frequency is >1.5 kHz.
The single-channel recording of I323T showed very short openings with many ambiguous sublevels even in 2 mM Ca2+. The flickery single-channel currents usually displayed many sublevels, as often seen in I323T. A few reasons could be responsible for the sublevels and rectification of I323T: the brief opening, low open probability, and disruption of cooperativity of the four I323T subunits. The highest level (or full-open level) would never be seen if the four subunits of a channel could not gate exactly synchronously. This would be further exacerbated by a low open probability. Compared with the mSlo channel, dSlo1A gave rise to an activation curve rightward-shifted by ∼150 mV in 10 μM Ca2+ (23). Accordingly, the low open probability of dSlo1A was the second reason for the flickery single-channel openings. We then examined whether the sublevels or subconductances really existed in I323T channels and determined what role the residue I323 plays in the gating of the mSlo BK channels.
Four subconductance levels exist in single-channel currents of I323T
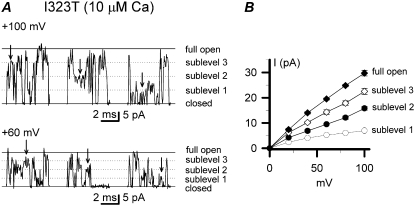
There would be only one open level to be seen if the four subunits of BK channels transit exactly synchronously between the closed (C) and open (O) states. If the cooperativity among subunits were disrupted, there would exist four open levels and one closed level, i.e., OOOO (full-open), OOOC (sublevel 3), OOCC/OCOC (sublevel 2), OCCC (sublevel 1), and CCCC (closed) (38). In our study, the closed, the full-open, and three intermediate sublevels (sublevels 1, 2, and 3) were assumed to be approximately quarter, half, and three-quarters of the full-open level. Although the I323T currents recorded at +100 and +60 mV with 10 μM intracellular Ca2+ were very flickery, we were still able to recognize the existence of the four subconductance levels as indicated by arrowheads in Fig. 4 A. Because most of the open time durations of the mutant I323T were <1 ms, the open time intervals of each sublevel were mostly shorter than 1 ms too. By and large, the I/V curve of each single-channel subconductance was linear (Fig. 4 B).
FIGURE 4.
Subconductance levels of the mutant I323T. (A) The representative single-channel subconductance levels as indicated by arrows are exhibited at +100 mV and +60 mV, respectively. Solid lines labeled with “c” and “o” represent the closed and open levels, respectively. Dotted lines represent subconductance levels as indicated. (B) Current-voltage curves are plotted for the full-open and sublevels (n = 4–7). All single-channel levels of currents were measured manually.
Disruption of cooperativity between I323T subunits results in subconductances
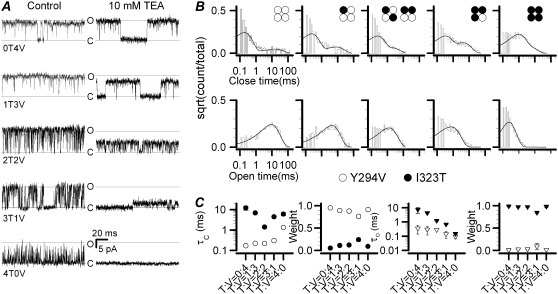
Chapman and VanDongen (39) constructed a tandem dimer linking two K-channel subunits with different activation thresholds. Activation of this dimer resulted in two subconductance levels in single-channel gating by strong depolarizations, suggesting that there was a disruption of cooperativity in it. In contrast with I323T, the TEA-insensitive Y294V (mSlo) mutant shows only one open level with a long open duration, indicating that its subunits have full cooperativity. Because the number of sublevels of I323T can represent a degree of disruption of cooperativity, we coexpressed it with the TEA-insensitive Y294V mutant. Accordingly, we expect that the presence of the Y294V-carrying subunit would give rise to more full openings. In other words, it gives a better cooperativity. The coexpression of the two subunits resulted in channels of five different compositions, namely, VVVV (0T4V), VVVT (1T3V), VVTT/VTVT (2T2V), VTTT (3T1V) and TTTT (4T0V), where V and T were for the Y294V and I232T subunits, respectively. To facilitate the determination of the stoichiometry of each channel, we incorporated the additional mutation I323T in the Y294V subunit, which would increase the TEA sensitivity. The stoichometry of the subunits was first determined for each patch based on their distinct unitary current amplitudes (n ≥ 15 patches) as Niu and Magleby reported (36). Fig. 5 A shows representative traces of single-channel currents of all possible phenotypes. When we gradually replaced V with T in the 0T4V channel, the open time of channels became shorter and shorter (Fig. 5 A) somewhat like the stepwise view of the Ca2+-binding process in BK channels (36).
FIGURE 5.
Determination of subunit stoichiometry from the heterogeneous channels coexpressed with the TEA-insensitive mutation Y294V and the mutant I323T. (A) All the single-channel currents of the channels composed of the TEA-insensitive Y294V and the I323T subunits are recorded in outside-out patches at +50 mV with 10 μM Ca2+ in the presence and absence of 10 mM TEA. All the recordings were filtered at 3 kHz. Each heterogeneous channel was distinguished by a different inhibited state of currents (right column). Solid lines labeled with “c” or “o” represent the closed and open levels, respectively. The control single-channel currents of coexpressed Y294V (or V) and I323T (or T) are shown in the left column, and the inhibited currents with 10 mM TEA in the right column. The tetramer channels composed of V and T subunits are indicated by 0T4V, 1T3V, 2T2V, 3T1V, and 4T0V, respectively. (B) The dwell-time distributions are shown for each heterogeneous channel. Both the open and closed time constants were best fitted to a biexponential function by the software QuB, respectively. Each combination is indicated with a construct symbol. (C) Time constants with their relative weights are plotted against the cumulative numbers of the I323T mutant, respectively. The symbols ○, •, ▿, and 7 are for the fast time constant, the slow time constant, the fast weight, and the slow weight, respectively. The slow open-time constants for VVVV (0T4V), VVVT (1T3V), VVTT/VTVT (2V2T), VTTT (3T1V), and TTTT (4T0V) are τopen = 7.38 ± 2.53, 4.32 ± 0.07, 1.23 ± 0.07, 0.68 ± 0.02, and 0.15 ± 0.01 ms, respectively. The fast closed-time constants for 0T4V, 1T3V, 2V2T, 3T1V, and 4T0V are τclosed = 0.17 ± 0.01, 0.22 ± 0.001, 0.25 ± 0.01, 0.30 ± 0.01, and 1.32 ± 0.17 ms, respectively.
For analysis of the duration histograms, we treated all the sublevels and the full conductance equally as a single open class. The resulting closed and open duration distributions were fitted to a model containing two closed and two open states (2C-2O, Scheme 1) using the QuB program. Both the two closed and the two open time constants were well separated. However, the distribution appeared to be dominated by the fast closures and the slow openings. The slow closures showed a time constant in the range of 2–12 ms and a population (or weight) of 0.05–0.25. The fast openings had a time constant ∼0.1–0.35 ms and an area <0.01–0.09. The distribution could be approximated by a fast closed and a slow open component. When the T subunit was progressively replaced by the V subunit, the fast closed time constant increased from 0.17 to 1.32 ms, whereas the slow open time constant decreased from 8 to <0.2 ms (Fig. 5 C). The insignificant occupancy of the fast opening and slow closure indicates that the gating could be reduced to a simple two-state model (C-O) to simplify the analysis.
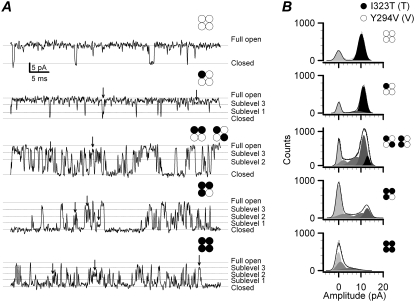
Although channels comprising only Y294V or I323T subunits showed either no apparent sublevels or only fast transient openings, the combination of the two subunits resulted in more long-lived sublevels as expected (Fig. 6, A and B). Table 1 lists all the detected conductance levels and their occupancy as determined from the amplitude histograms fitted with a sum of five Gaussians. Without the T subunit, the 0T4V channel had occupancy of 0.19 for closed and 0.81 for full opening, respectively. The inclusion of one T subunit (1T3V) suppressed the occurrence of the full conductance level and gave rise to predominantly sublevel 3. Further addition of the T subunits resulted in other lower sublevels. This trend of the dependence of the sublevel occupancy on the subunit composition is consistent with the notion that the I323T subunits have a reduced cooperativity so that they cannot open synchronously to the full conductance level as with the Y294V subunits alone.
FIGURE 6.
The subconductance levels of the heterogeneous channels coexpressed with the mutant I323T and the TEA-insensitive mutant Y294V. (A) Examples show the single-channel subconductance levels at +50 mV with 10 μM Ca2+ for each combination indicated by the construct symbol. As the number of I323T subunits in the heterogeneous channel increases, the subconductance events indicated by arrows occur more often, and the open-time durations obviously become much shorter too (n = 3–5). Solid lines labeled with “c” and “o” represent the closed and open levels, respectively. Dotted lines represent each subconductance level as indicated at the right. (B) Amplitude histograms of currents for each heterogeneous channel are shown at the left column. The amplitudes of the full-open currents from the top to the bottom panel are 10.5 ± 0.5, 11.5 ± 0.4, 14.8 ± 0.6, 12.8 ± 0.3, and 14.6 ± 0.6 pA, respectively. The construct symbols for each composition are shown at the right of each graph.
TABLE 1.
Statistics on probabilities at each level for all channels (n ≥ 3)
| I323T(T):Y294V(V) | Close (%) | Sublevel 1 (%) | Sublevel 2 (%) | Sublevel 3 (%) | Full open (%) |
|---|---|---|---|---|---|
| T:V = 0:4(0T4V) | 19.4 ± 4.5 | — | — | — | 80.6 ± 4.5 |
| T:V = 1:3(1T3V) | 17.4 ± 4.0 | 0.007 ± 0.001 | — | 9.6 ± 2.2 | 73.0 ± 2.4 |
| T:V = 2:2(2T2V) | 15.9 ± 1.4 | 13.7 ± 3.8 | 21.3 ± 2.4 | 44.7 ± 2.9 | 7.6 ± 2.7 |
| T:V = 3:1(3T1V) | 41.4 ± 6.6 | 17.3 ± 3.2 | 14.1 ± 3.7 | 23.0 ± 5.3 | 4.3 ± 0.01 |
| T:V = 4:0(4T0V) | 57.1 ± 5.9 | 23.6 ± 5.5 | 17.8 ± 4.1 | 2.7 ± 1.9 | 1.1 ± 0.01 |
Four I323 residues assemble a mostly closed-like structure
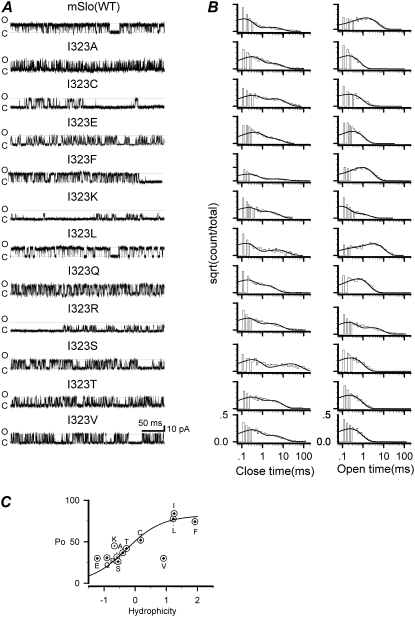
Because the residue I323 is located at the last pore-lining position in S6, it may play an important role in interacting with the inactivation domain of hβ2 subunits and regulating the gating of BK channels (24,25). To fully understand the function of the I323 (mSlo) residue, we introduced a series of mutations at this site to perturb channel gating. Single-channel currents from the mutant channels were recorded at +60 mV with 10 μM Ca2+ (Fig. 7 A). Fig. 7 B shows the duration histograms of the mutants along with the fitting results obtained with QuB. Brelidze et al. (20) reported that two acidic residues (E321 and E324) at the cytoplasmic entrance enhanced the ionic conductance of the mSlo channels by forming two negative-charge rings. Here we also found that the basic residue substitutions (I323K and I323R) not only reduced the single-channel conductance to about half but also significantly reduced the open durations (Table 2). It should be noted that although I323 is pore-lining, the residues E321 and E324 are not (25). Furthermore, the mutant I323E did not appear to alter channel conductance. One possible explanation is that there already are two outer rings of negative charges (E324).
FIGURE 7.
Representative single-channel currents of I323 mutations and their open and closed dwell-time histograms. (A) Representative single-channel currents as labeled were obtained from a series of 12 side-chain substitutions at the position 323 including the wild-type mSlo. All the currents were activated at +60 mV in the presence of 10 μM Ca2+. All the recordings were filtered at 10 kHz. Solid lines labeled with “c” and “o” represent the closed and open levels, respectively. (B) Both the open and closed dwell-time histograms for the I323 mutant series were fitted to biexponential functions as indicated. (C) The open probabilities of I323 mutants are plotted as functions of hydrophobicity of the candidate amino acids and then fitted to a Boltzmann function (Eq. 1).
TABLE 2.
The open time constants of I323 series mutants (n ≥ 3)
|
τopen(ms)
|
|||||
|---|---|---|---|---|---|
| Mutant | τfast* | wfast† | τslow | wslow | τO-Avg (ms) |
| mSlo(I) | 0.41 ± 0.36 | 0.22 ± 0.21 | 1.5 ± 0.55 | 0.78 ± 0.22 | 1.2 ± 0.10 |
| I323A | 0.06 ± 0.05 | 0.07 ± 0.10 | 0.22 ± 0.07 | 0.93 ± 0.10 | 0.20 ± 0.05 |
| I323C | 0.17 ± 0.25 | 0.33 ± 0.58 | 0.64 ± 0.15 | 0.67 ± 0.58 | 0.52 ± 0.05 |
| I323E | 0.05 ± 0.01 | −0.02 ± 0.0 | 0.29 ± 0.01 | 1.0 ± 0.02 | 0.30 ± 0.01 |
| I323F | 0.05 ± 0.01 | 0.01 ± 0.01 | 0.81 ± 0.11 | 0.99 ± 0.01 | 0.81 ± 0.08 |
| I323K | 0.08 ± 0.01 | 0.19 ± 0.04 | 0.38 ± 0.06 | 0.81 ± 0.10 | 0.32 ± 0.01 |
| I323L | 0.07 ± 0.04 | 0.16 ± 0.01 | 1.8 ± 0.03 | 0.84 ± 0.12 | 1.1 ± 0.09 |
| I323Q | 0.13 ± 0.01 | 0.10 ± 0.02 | 0.48 ± 0.06 | 0.90 ± 0.07 | 0.46 ± 0.06 |
| I323R | 0.20 ± 0.03 | 0.03 ± 0.01 | 0.32 ± 0.06 | 0.97 ± 0.09 | 0.31 ± 0.05 |
| I323S | 0.21 ± 0.01 | 0.03 ± 0.01 | 0.44 ± 0.03 | 0.97 ± 0.01 | 0.43 ± 0.03 |
| I323T | 0.18 ± 0.02 | 0.09 ± 0.06 | 0.51 ± 0.08 | 0.91 ± 0.06 | 0.27 ± 0.10 |
| I323V | 0.05 ± 0.06 | 0.06 ± 0.05 | 0.22 ± 0.03 | 0.94 ± 0.05 | 0.21 ± 0.03 |
τ, time constant.
w, weight.
After normalization, all hydrophilic mutations show four different open levels as does the I323T, whereas the hydrophobic mutations show better concerted gating. Consistent with the transient openings in I323T, other hydrophilic substitutions also tended to give rise to similar spiky opening events. This is the case for both charged and noncharged but polar ones, such as lysine, serine, and threonine. The hydrophobic mutations, on the other hand, generally resulted in longer openings. These include isoleucine, leucine, and phenylalanine. One exception is valine, which has a relatively small side chain. Because the residues at position 323 lie within the hydrophilic cavity of the pore, they likely form tight hydrophobic interactions. We calculated the open probability of each mutant assuming a two-state model C←→O (40) and plotted Po as a function of the hydrophobicity of the substituted residue. As seen in Fig. 7 C, there is a consistent trend that the open probability increases with the hydrophobicity of the residue (except valine), and the fitting by Eq. 1 gave H50 = −0.28. Therefore, higher hydrophobicity results in longer open durations (Table 2).
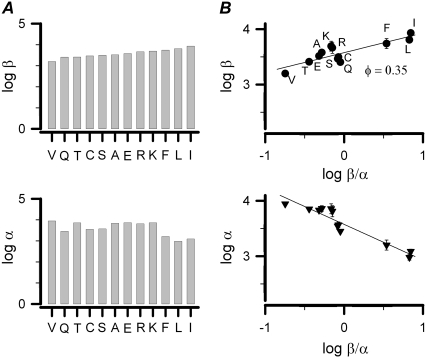
REFER analysis provides information regarding allosteric transitions by relating changes in free energy of a transition state to systematic perturbations in the protein caused by single-site mutations (41). The quantitative position of the residue I323 in the closed-to-open transition was explored using this method (26). In the REFER analysis, we first converted the 2C-2O model into a C-O model according to the Eq. 2 (see Scheme 1). Fig. 8 illustrates the logarithmic dependence of the opening (β) and closing (α) rate constants on the equilibrium constant (K = β/α). For simplicity, each mutation was abbreviated with a single letter corresponding to the substituted amino acid. For instance, I323T was designated as T. The slope of the log β versus log K plot gave a φ-value of ∼0.35 as shown in the upper panel of Fig. 8 B. From the lower panel of Fig. 8 B, we found that the increase in β/α was mainly caused by a decrease in α. For φ = 0.35, we suggest that the structure of the transition state at the residue I323 shows ∼65% similarity to the closed state. In other words, the transition barriers between the two energetic states change along the reaction coordinate after perturbation of this particular residue.
FIGURE 8.
REFER analysis on the site I323 of mSlo. (A) With the software QuB, single-channel recordings in Fig. 7 were analyzed to obtain the αs, βs, and weight of each state. The equivalent α and β of the simplified C-O model were calculated from the formula described in the legend of Scheme 1. Logarithms of the open (β) and closed (α) rate constants are plotted for the I323 mutants in an increasing order of equilibrium constant (K = β/α), respectively. Each mutant is represented with an abbreviated letter of its substituted residue. (B) Log β and log α are plotted with log K, respectively. The symbol (•) of each mutant is labeled with an abbreviated capital letter of its substituted residue. Here, the φ value equals log β/log K (n = 3–4).
Four I323 residues form the narrowest gateway of BK channels
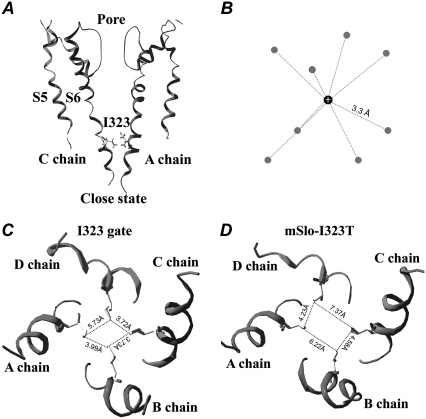
Does the I323 form a gateway near the cytoplasmic entrance of BK-type channels? We used MD simulation to probe why the hydrophobicity of I323 influences channel gating and to determine what role the I323 plays in mSlo channels. For better visualization, we plotted an equilibrated, closed conformation of the wild-type mSlo channel with two opposite subunits (Fig. 9 A). The side chains of the four I323 residues adjacent to the cytoplast extend as long as possible to form the narrowest hydrophobic gateway with a nearly regular square capable of holding the four subunits more tightly to enhance the cooperativity of channels (Fig. 9 C). Thus, a more hydrophobic gateway would not only effectively control the hydrated K+ efflux entering the pore (Fig. 9 B) but also act as “a shutter of a camera” to slow down the transitions between two energetic states. In contrast, the spatial distance among the four T323 residues of I323T became larger and more irregular because the T323 residue has a shorter side chain and less hydrophobicity (Fig. 9 D). Compared with the I323, the interactions among the T323 residues were weaker and less cooperative because of the loosened lateral connection. A longer irregular structure likely destroyed the cooperativity between subunits leading to the appearance of various subconductance.
FIGURE 9.
The gating mechanism of the I323 residue in mSlo channels. (A) A closed-state structure of mSlo channels is derived from the 8-ns MD simulations. (B) A cartoon of a hydrated K+ ion is referred from the determined potassium channel structure (44). The average distance between the K+ ion and the oxygen (O) atom of a water molecule is 3.3 Å. The gray ball represents the oxygen (O) atom of a water molecule, and the black ball represents the K+ ion. (C) A regular hydrophobic ring in the mSlo channel is formed by the four I323 residues through strongly hydrophobic interactions. The distances between the neighboring I323 residues are 3.72 Å, 3.73 Å, 3.99 Å, and 5.73 Å, respectively. (D) A closed-state structure of I323T is derived from the 8-ns MD simulations; its shape exhibits a larger and more irregular rectangle than that of mSlo. The distances between the neighboring T323 residues are 4.23 Å, 7.37 Å, 6.22 Å, and 4.58 Å, respectively.
DISCUSSION
The BK channel encoding mSlo α-subunits alone shows no rectification in currents, but its mutant I323T exhibits an apparently “outward-rectified” current. Unlike the instantaneous outward-rectified tail current of the α + hβ2 or α + hβ3 channels, the rectification of the mutation I323T does not come from the extracellular segments of the β-subunits (22). Additionally, there has been a long controversy about the single-channel subconductance levels. In most cases, the subconductance levels are extremely short-lived and could be explained as an artifact produced by limited bandwidth; but in a few cases, the longer-lived subconductance levels that exceed the filter risetime only provide the confirmed evidence of subconductance. The previous studies have demonstrated that the subconductance levels are produced by partial activation of the channel openings, and there would be several sublevels that have not been observed because their lifetimes would be too brief to be detected (39,42). In this study, our results demonstrated that the “rectification” arose from missing the full-open level because of a disruption of cooperativity of the four subunits, especially when the channel-open probability is low.
A mathematical description can be used to explain the subconductance levels appearing in our experiments. Assuming the function f(t) stands for a probability density function (pdf) of one subunit staying at the open state at a time t, the integral of f(t) confers its open probability F(t). If the four subunits always make a transition exactly synchronously, the pdf = f(t) can stand for the full-open pdf of the whole channel. In contrast, although the four subunits transit completely independently, we have pdf = f(t)4 to stand for the full-open pdf of the whole channel. If the function f(t) distributes mostly within <1 ms with a low open probability, the full-open probability of channels would become so low that it could directly result in a loss of the full-level opening. That is why the rectification mechanism of I323T channel differs from that of the positive charged rings (20) and α + hβ3 channels (22).
Because there exist at least two open and two closed states in BK channels (43), we had to convert the model 2C-2O into the model C-O for REFER analysis. Comparing the 2C-2O with the other linear models of BK channels, i.e., C-O-O-C and O-C-C-O, we found no significant differences in results. The method described in the legend of Scheme 1 is also good for the model with more states than 2C-2O.
In analyzing the dwell-time distributions of open and closed states, we also ignored the sublevels of single-channel currents. The first reason is that the proportion of sublevels is tremendously decreased at the higher open probability or more positive voltages such as +60 mV. The second reason is that the open-time constants of sublevels are mainly <1 ms, so their population is too small to alter the open-time distribution (also see Fig. 5 C). However, sublevels could cause the data points to disperse along the reaction line in REFER analysis.
Although replacing the residue I323 with a hydrophobic Val still showed the short open duration because of its short side chain, the substitution of Leu or Phe for the I323 residue resulted in long open durations because all of them have high hydrophobicity and long side chains similar to Ile. This significant difference in channel open time reveals that the more hydrophobic amino acids at the site I323 (Fig. 9 C) are absolutely necessary to maintain the cooperativity of the four channel subunits and that the hydrophilic residues or the short side-chain hydrophobic residues can destroy the synergetic movement of the four subunits through a loosened juncture, which finally leads to rectification and subconductance.
The BK channel, compared with the Kcsa channel, likely has a different open conformation because of the differential gating mechanism and functional residues. However, Kcsa provides the only available closed-state structure for studying the role of the residue I323 (mSlo) in gating. Additionally, the helical structure of the S6 domains embedded in the cellular membrane has been widely recognized, although its sequence is not highly homologous in different channels. Therefore, the crystal structure of Kcsa was used to simulate the closed-state structure of mSlo. Of course, the different residues in S6 can affect the closed conformation of mSlo, although the influence can be minimized through an 8-ns MD simulation for permitting residues to attain equilibrated and stable positions. The asymmetrical profiles given in the simulation reflect the degree of structural relaxation between different pairs of I323 or T323 in nature.
The residue G99 in the Kcsa channel plays the role of hinge (25), which is replaced by a PVP motif in the Kv1.2 channel (PDB code: 2A79). However, the PVP motif does not appear in the mSlo. Accordingly, the cavity of BK formed from the twin-glycine hinge G311G310 to I323 is much larger than that of Shaker formed from the hinge G466 to the motif PVP (44). Two excellent experimental results demonstrate that the BK channel has an enlarged cavity and inner pore, which may imply that it has two possible structures, i.e., trapping and free access (45,46). In this study, our results favor the interpretation that I323 forms a narrow gateway near the cytoplasmic entrance of BK channels. Clearly, an actual crystal structure of the intact BK channels will lead to more information regarding the movements of the subunits.
Acknowledgments
We are grateful to Dr. A. D. Wei for sending the dSlo1A clone at the final stage of this study and for suggestions about the manuscript. We also thank Dr. C. Bowman for carefully revising this article, Dr. C. L. Lingle for a gift of dSlo1B clone, and Dr. A. Auerbach for helpful discussion on REFER analysis. This work was supported by grants from the National Science Foundation of China (30470449, 30470646, 30770522, 30630020, and 30670502).
Zhaohua Guo and Caixia Lv contributed equally to this work.
Editor: Richard W. Aldrich.
References
- 1.Adelman, J. P., K. Z. Shen, M. P. Kavanaugh, R. A. Warren, Y. N. Wu, A. Lagrutta, C. T. Bond, and R. A. North. 1992. Calcium-activated potassium channels expressed from cloned complementary DNAs. Neuron. 9:209–216. [DOI] [PubMed] [Google Scholar]
- 2.Robitaille, R., M. L. Garcia, G. J. Kaczorowski, and M. P. Charlton. 1993. Functional colocalization of calcium and calcium-gated potassium channels in control of transmitter release. Neuron. 11:645–655. [DOI] [PubMed] [Google Scholar]
- 3.Yazejian, B., D. A. DiGregorio, J. L. Vergara, R. E. Poage, S. D. Meriney, and A. D. Grinnell. 1997. Direct measurements of presynaptic calcium and calcium-activated potassium currents regulating neurotransmitter release at cultured Xenopus nerve-muscle synapses. J. Neurosci. 17:2990–3001. [DOI] [PMC free article] [PubMed] [Google Scholar]
- 4.Aiyar, J., J. P. Rizzi, G. A. Gutman, and K. G. Chandy. 1996. The signature sequence of voltage-gated potassium channels projects into the external vestibule. J. Biol. Chem. 271:31013–31016. [DOI] [PubMed] [Google Scholar]
- 5.Almers, W., and C. M. Armstrong. 1980. Survival of K+ permeability and gating currents in squid axons perfused with K+-free media. J. Gen. Physiol. 75:61–78. [DOI] [PMC free article] [PubMed] [Google Scholar]
- 6.Bell, J. E., and C. Miller. 1984. Effects of phospholipid surface charge on ion conduction in the K+ channel of sarcoplasmic reticulum. Biophys. J. 45:279–287. [DOI] [PMC free article] [PubMed] [Google Scholar]
- 7.Cui, J., D. H. Cox, and R. W. Aldrich. 1997. Intrinsic voltage dependence and Ca2+ regulation of mslo large conductance Ca-activated K+ channels. J. Gen. Physiol. 109:647–673. [DOI] [PMC free article] [PubMed] [Google Scholar]
- 8.Atkinson, N. S., G. A. Robertson, and B. Ganetzky. 1991. A component of calcium-activated potassium channels encoded by the Drosophila slo locus. Science. 253:551–555. [DOI] [PubMed] [Google Scholar]
- 9.Nelson, M. T., H. Cheng, M. Rubart, L. F. Santana, A. D. Bonev, H. J. Knot, and W. J. Lederer. 1995. Relaxation of arterial smooth muscle by calcium sparks. Science. 270:633–637. [DOI] [PubMed] [Google Scholar]
- 10.Hudspeth, A. J., and R. S. Lewis. 1988. Kinetic analysis of voltage- and ion-dependent conductances in saccular hair cells of the bull-frog, Rana catesbeiana. J. Physiol. 400:237–274. [DOI] [PMC free article] [PubMed] [Google Scholar]
- 11.Hudspeth, A. J., and R. S. Lewis. 1988. A model for electrical resonance and frequency tuning in saccular hair cells of the bull-frog, Rana catesbeiana. J. Physiol. 400:275–297. [DOI] [PMC free article] [PubMed] [Google Scholar]
- 12.Wu, Y. C., J. J. Art, M. B. Goodman, and R. Fettiplace. 1995. A kinetic description of the calcium-activated potassium channel and its application to electrical tuning of hair cells. Prog. Biophys. Mol. Biol. 63:131–158. [DOI] [PubMed] [Google Scholar]
- 13.Duncan, R. K., and P. A. Fuchs. 2003. Variation in large-conductance, calcium-activated potassium channels from hair cells along the chicken basilar papilla. J. Physiol. 547:357–371. [DOI] [PMC free article] [PubMed] [Google Scholar]
- 14.Fettiplace, R., and P. A. Fuchs. 1999. Mechanisms of hair cell tuning. Annu. Rev. Physiol. 61:809–834. [DOI] [PubMed] [Google Scholar]
- 15.Krishnamoorthy, G., J. Shi, D. Sept, and J. Cui. 2005. The NH2 terminus of RCK1 domain regulates Ca2+-dependent BK(Ca) channel gating. J. Gen. Physiol. 126:227–241. [DOI] [PMC free article] [PubMed] [Google Scholar]
- 16.Moss, B. L., S. D. Silberberg, C. M. Nimigean, and K. L. Magleby. 1999. Ca2+-dependent gating mechanisms for dSlo, a large-conductance Ca2+-activated K+ (BK) channel. Biophys. J. 76:3099–3117. [DOI] [PMC free article] [PubMed] [Google Scholar]
- 17.Silberberg, S. D., A. Lagrutta, J. P. Adelman, and K. L. Magleby. 1996. Wanderlust kinetics and variable Ca2+-sensitivity of Drosophila, a large conductance Ca2+-activated K+ channel, expressed in oocytes. Biophys. J. 70:2640–2651. [DOI] [PMC free article] [PubMed] [Google Scholar]
- 18.Lagrutta, A. A., K. Z. Shen, A. Rivard, R. A. North, and J. P. Adelman. 1998. Aromatic residues affecting permeation and gating in dSlo BK channels. Pflugers Arch. 435:731–739. [DOI] [PubMed] [Google Scholar]
- 19.Nimigean, C. M., J. S. Chappie, and C. Miller. 2003. Electrostatic tuning of ion conductance in potassium channels. Biochemistry. 42:9263–9268. [DOI] [PubMed] [Google Scholar]
- 20.Brelidze, T. I., X. Niu, and K. L. Magleby. 2003. A ring of eight conserved negatively charged amino acids doubles the conductance of BK channels and prevents inward rectification. Proc. Natl. Acad. Sci. USA. 100:9017–9022. [DOI] [PMC free article] [PubMed] [Google Scholar]
- 21.Haug, T., D. Sigg, S. Ciani, L. Toro, E. Stefani, and R. Olcese. 2004. Regulation of K+ flow by a ring of negative charges in the outer pore of BKCa channels. Part I: aspartate 292 modulates K+ conduction by external surface charge effect. J. Gen. Physiol. 124:173–184. [DOI] [PMC free article] [PubMed] [Google Scholar]
- 22.Zeng, X. H., X. M. Xia, and C. J. Lingle. 2003. Redox-sensitive extracellular gates formed by auxiliary β subunits of calcium-activated potassium channels. Nat. Struct. Biol. 10:448–454. [DOI] [PubMed] [Google Scholar]
- 23.Wei, A., C. Solaro, C. Lingle, and L. Salkoff. 1994. Calcium sensitivity of BK-type KCa channels determined by a separable domain. Neuron. 13:671–681. [DOI] [PubMed] [Google Scholar]
- 24.Li, H., J. Yao, X. Tong, Z. Guo, Y. Wu, L. Sun, N. Pan, H. Wu, T. Xu, and J. Ding. 2007. Interaction sites between the Slo1 pore and the NH2 terminus of the β2 subunit, probed with a three-residue sensor. J. Biol. Chem. 282:17720–17728. [DOI] [PubMed] [Google Scholar]
- 25.Doyle, D. A., J. Morais Cabral, R. A. Pfuetzner, A. Kuo, J. M. Gulbis, S. L. Cohen, B. T. Chait, and R. MacKinnon. 1998. The structure of the potassium channel: molecular basis of K+ conduction and selectivity. Science. 280:69–77. [DOI] [PubMed] [Google Scholar]
- 26.Grosman, C., M. Zhou, and A. Auerbach. 2000. Mapping the conformational wave of acetylcholine receptor channel gating. Nature. 403:773–776. [DOI] [PubMed] [Google Scholar]
- 27.Mitra, A., T. D. Bailey, and A. L. Auerbach. 2004. Structural dynamics of the M4 transmembrane segment during acetylcholine receptor gating. Structure. 12:1909–1918. [DOI] [PubMed] [Google Scholar]
- 28.Chakrapani, S., T. D. Bailey, and A. Auerbach. 2003. The role of loop 5 in acetylcholine receptor channel gating. J. Gen. Physiol. 122:521–539. [DOI] [PMC free article] [PubMed] [Google Scholar]
- 29.Jencks, W. P. 1985. A primer for the Bema Hapothle. An empirical approach to the characterization of changing transition state structures. Chem. Rev. 85:511–527. [Google Scholar]
- 30.Mitra, A., R. Tascione, A. Auerbach, and S. Licht. 2005. Plasticity of acetylcholine receptor gating motions via rate-energy relationships. Biophys. J. 89:3071–3078. [DOI] [PMC free article] [PubMed] [Google Scholar]
- 31.Schwede, T., J. Kopp, N. Guex, and M. C. Peitsch. 2003. SWISS-MODEL: an automated protein homology-modeling server. Nucleic Acids Res. 31:3381–3385. [DOI] [PMC free article] [PubMed] [Google Scholar]
- 32.Case, D. A. T. A. D., T. E. Cheatham III, C. L. Simmerling, J. Wang, R. E. Duke, R. Luo, K. M. Merz, B. Wang, D. A. Pearlman, M. Crowley, S. Brozell, V. Tsui, H. Gohlke, J. Mongan, V. Hornak, G. Cui, P. Beroza, C. Schafmeister, J. W. Caldwell, W. S. Ross, and P. A. Kollman. 2004. Amber 8. San Francisco: University of California Press.
- 33.Tsui, V., and D. A. Case. 2000. Molecular dynamics simulations of nucleic acids with a generalized born solvation model. J. Am. Chem. Soc. 122:2489–2498. [Google Scholar]
- 34.Wang, J., P. Cieplak, and P. A. Kollman. 2000. J. Comput. Chem. 21:1049–1074. [Google Scholar]
- 35.Yi, H., Z. Cao, S. Yin, C. Dai, Y. Wu, and W. Li. 2007. Interaction simulation of hERG K+ channel with its specific BeKm-1 peptide: insights into the selectivity of molecular recognition. J. Proteome Res. 6:611–620. [DOI] [PubMed] [Google Scholar]
- 36.Niu, X., and K. L. Magleby. 2002. Stepwise contribution of each subunit to the cooperative activation of BK channels by Ca2+. Proc. Natl. Acad. Sci. USA. 99:11441–11446. [DOI] [PMC free article] [PubMed] [Google Scholar]
- 37.Xia, X. M., X. Zeng, and C. J. Lingle. 2002. Multiple regulatory sites in large-conductance calcium-activated potassium channels. Nature. 418:880–884. [DOI] [PubMed] [Google Scholar]
- 38.Yang, B., V. K. Gribkoff, J. Pan, V. Damagnez, S. I. Dworetzky, C. G. Boissard, A. Bhattacharjee, Y. Yan, F. J. Sigworth, and L. K. Kaczmarek. 2006. Pharmacological activation and inhibition of Slack (Slo2.2) channels. Neuropharmacology. 51:896–906. [DOI] [PubMed] [Google Scholar]
- 39.Chapman, M. L., and A. M. VanDongen. 2005. K channel subconductance levels result from heteromeric pore conformations. J. Gen. Physiol. 126:87–103. [DOI] [PMC free article] [PubMed] [Google Scholar]
- 40.Ellington, A., and J. M. Cherry. 1994. Characteristics of amino acids. In Current Protocols in Molecular Biology, Suppl. 33, A.31C.32. A. Ellington and J. M. Cherry, editors. [DOI] [PubMed]
- 41.Leffler, J. E., and E. Grunwald. 1963. Rates and Equilibria of Organic Reactions. Wiley, New York.
- 42.Chapman, M. L., H. M. VanDongen, and A. M. VanDongen. 1997. Activation-dependent subconductance levels in the drk1 K channel suggest a subunit basis for ion permeation and gating. Biophys. J. 72:708–719. [DOI] [PMC free article] [PubMed] [Google Scholar]
- 43.Rothberg, B. S., and K. L. Magleby. 2000. Voltage and Ca2+ activation of single large-conductance Ca2+-activated K+ channels described by a two-tiered allosteric gating mechanism. J. Gen. Physiol. 116:75–99. [DOI] [PMC free article] [PubMed] [Google Scholar]
- 44.Magidovich, E., and O. Yifrach. 2004. Conserved gating hinge in ligand- and voltage-dependent K+ channels. Biochemistry. 43:13242–13247. [DOI] [PubMed] [Google Scholar]
- 45.Li, W., and R. W. Aldrich. 2004. Unique inner pore properties of BK channels revealed by quaternary ammonium block. J. Gen. Physiol. 124:43–57. [DOI] [PMC free article] [PubMed] [Google Scholar]
- 46.Wilkens, C. M., and R. W. Aldrich. 2006. State-independent block of BK channels by an intracellular quaternary ammonium. J. Gen. Physiol. 128:347–364. [DOI] [PMC free article] [PubMed] [Google Scholar]


