

Abstract
We have developed a top-down, rule-based mathematical model to explore the basic principles that coordinate mechanochemical events during animal cell migration, particularly the local-stimulation-global-inhibition model suggested originally for chemotaxis. Cells were modeled as a shape machine that protrudes or retracts in response to a combination of local protrusion and global retraction signals. Using an optimization algorithm to identify parameters that generate specific shapes and migration patterns, we show that the mechanism of local stimulation global inhibition can readily account for the behavior of Dictyostelium under a large collection of conditions. Within this collection, some parameters showed strong correlation, indicating that a normal phenotype may be maintained by complementation among functional modules. In addition, comparison of parameters for control and nocodazole-treated Dictyostelium identified the most prominent effect of microtubules as regulating the rates of retraction and protrusion signal decay, and the extent of global inhibition. Other changes in parameters can lead to profound transformations from amoeboid cells into cells mimicking keratocytes, neurons, or fibroblasts. Thus, a simple circuit of local stimulation-global inhibition can account for a wide range of cell behaviors. A similar top-down approach may be applied to other complex problems and combined with molecular manipulations to define specific protein functions.
INTRODUCTION
Migration of animal cells is a complex function that plays a critical role in both physiological and pathological processes, including embryonic development, wound healing, and cancer metastasis. In addition, motile activities in different regions of a cell collectively determine cell shape, which in turn affects cell growth and viability (1). There is strong evidence that cell migration involves multiple events, including protrusion, contraction, adhesion, and de-adhesion (2), which take place simultaneously in different regions of the cell. Although recent advances have identified a number of molecular components involved in each event, such as Arp2/3 in protrusion, myosin II in contraction, and integrins in adhesion (2), equally important but much less understood is how these events are coordinated at the “circuit” level to drive cell migration.
Mathematical modeling represents a powerful tool for exploring complex problems. A model that explains cell migration must be able to account for both the migration pattern and cell shape. In the absence of guidance cues, cell migration is typically described as a persistent random walk (3). However, different cell types show a wide range of shapes, sizes, and migration speeds and patterns. For example, amoeboid cells are characterized by a highly unstable and irregular shape and short persistence, whereas keratocytes maintain a constant crescent shape and a strong persistence (4). Based on the common dependence on the actin cytoskeleton and signaling molecules such as small GTPases, it is widely assumed that these diverse manifestations of cell migration involve a similar mechanism “tuned” in different ways, although little is known about how the mechanism operates with such a high degree of versatility.
To date, most quantitative models describing cell shape and cell motility are bottom-up and inherently mechanical in nature. These models focus on specific events such as protrusion, adhesion, or retraction (5). Starting with a set of assumptions about the molecules involved, they construct equations describing temporal evolution of the variables as a consequence of molecular interactions, typically as ordinary or partial differential equations (6–8). Constraints for solving the equations may be imposed based on accepted mechanics of the cell and models of structural assembly, for example, mechanical forces required for cell protrusion and factors limiting actin polymerization (9). The equations may then be solved via finite-difference schemes (6) or energy-based methods (10). These models generally depend on a large number of experimental parameters from the literature, including protein concentrations, kinetic constants, and rheological moduli of the cytoplasm and cortex. Since these parameters vary among different cells, the models tend to reproduce the behavior of specific cell types. In addition, as the complexity increases, the targeted phenomenon, e.g., the persistence of migration, may become increasingly difficult to connect with molecular interactions. Bottom-up approaches have proved very useful for understanding processes of limited complexity, by demonstrating that the elements they incorporated are sufficient to describe specific steps quantitatively.
The purpose of this work is to understand how signaling events controlling cell protrusion and retraction are coordinated to generate the shapes and migration patterns of different cell types. Due to the complexity of the problem, we decided to take a top-down approach, implemented as a “rule-based” model. In this approach, the underlying mechanochemical events are taken into account implicitly in the mathematical expression of the rules and constraints, with each parameter representing the “lumping” of many molecular interactions. This approach is used widely in engineering and has proven very useful for understanding the propagation of action potential in nerve cells, without any prior knowledge of the molecular makeup of voltage-gated ion channels. Far from replacing a molecular description of the process, these coarse-grained models serve as a scaffold for understanding and integrating protein functions. The coarse-grained picture could subsequently be refined by incorporating additional details, until a connection with molecular level descriptions is established.
The main rules of our model are based on empirical facts about migrating live cells. First, the presence of a dominant, persistent leading edge plus numerous transient lateral protrusions, as typically seen in fibroblasts undergoing persistent random walk (11), suggests a localized, positive feedback that expands and maintains protrusions at the front, and a long-range, negative feedback that suppresses protrusive activities elsewhere. This combination of feedback circuits is also supported by the theoretical analysis of chemotaxis (12–15) and by experimental observations of the distribution of signaling molecules during chemotaxis (16). Second, to drive persistent random walks, the circuit must contain both deterministic and stochastic features. Deterministic features may dictate the propagation and dissipation of signals, whereas stochastic aspects may generate random pulses of new signals to overcome the persistent direction of migration and to promote turns.
The purpose of this study is threefold. First, we ask whether a simple circuit, as outlined above, combining local/global feedbacks and deterministic/stochastic signal regulations, is sufficient to generate the dynamic shapes and persistent random walks typical of amoeboid cells migrating in the absence of chemoattractants. Second, we test whether the model can be combined with experimental manipulations to determine the function of specific molecules or structures in cell migration. Third, we explore how this kind of top-down model can provide insights into potential synergistic or antagonistic interactions within the circuit, as well as the physiology underlying the wide range of shapes and migration patterns seen in different cell types.
DESCRIPTION OF THE MODEL
A “rule-based” model explicitly omits any description in terms of forces and specific molecules. Instead, mechanochemical events underlying cell migration are incorporated in an implicit way, by embedding them in the rules describing the evolution of cell shapes and regulatory signals. Due to the heavy computational load for multidimensional optimization, described later, we sought as simple a formulation as possible, which incorporates the general principles of local/global feedbacks and stochastic/deterministic features, as outlined in the Introduction, for the generation of measurable shapes and migration characteristics. Thus, the parameters selected, and the associated assumptions and approximations, reflected a compromise between the requirements for defining cellular mechanisms and practical limitations (Table 1). The rules and their rationale are explained as follows.
TABLE 1.
Variables used in the model
| Variable | Symbol | Definition | Biological/molecular interpretation |
|---|---|---|---|
| Protrusion signals | |||
| Diffusion Rate (μm2/s) | Kdiffuse | Signal change driven by concentration gradients | Transport of factors that promote actin polymerization and protrusion, approximated as a 1D diffusion process along the border |
| Decay rate (1/s) | Kdecay | Fraction of signal decrease per unit time | Rate of deactivation of signals for actin polymerization, e.g., through dephosphorylation, proteolysis, ligand dissociation, or depletion |
| Random burst rate (1/s × 1/μm) | Pbaseline | Expected number of pulses per unit time per unit length due to baseline activities | Rate of spontaneous generation of signals that promote actin polymerization and protrusion |
| Burst size | Nburst | Average magnitude of each protrusive pulse | Magnitude of spontaneous signals that promote actin polymerization and protrusion |
| Retraction signals | |||
| Inhibitory signal concentration constant (1/μm3) | C− | Concentration of retraction signals generated per unit spread area per unit integrated protrusion signals | Responses of signals that promote global cell retraction, such as Rho GTPases and phosphatases like PTP-Pest, in relation to protrusive activities and spreading area |
| Shape change | |||
| Protrusion rate (μm/s) | R+ | Average rate of increase in radius during protrusion | Rate of pseudopodium extension |
| Retraction rate (1/s) | R− | Rate of fractional decrease in radius during retraction | Rate of retraction in relation to distance from the cell center |
| Feedback curve | |||
| Slope (1/s) | γ | Slope of the positive feedback curve; rate of new signals stimulated by existing net signals | Gain of the positive signal feedback loop that generates signals for actin polymerization and protrusion in proportion to existing activities |
| Takeoff point (1/μm) | λ | X-intercept of the positive feedback curve | Minimal protrusive signals required to activate the feedback loop that promotes actin polymerization and protrusion |
| Focal adhesions | |||
| Formation probability |  |
Probability of formation of a FA per unit time | Probability/rate of the formation of new focal adhesions in an extending area |
| Half-life |  |
Average halftime for a FA | Longevity of focal adhesions after formation |
Regulation of cell shape and migration by protrusion and retraction signals
A cell is modeled by its perimeter points and its center, defined as its geometrical centroid at a given time point. It is capable of moving its perimeter points away from the center by localized protrusions, or toward the center by retraction, and the centroid position is modified accordingly. Note that since this model deals with cell shape and migration in two dimensions, it is unnecessary to consider the conservation of total volume or surface area, which is implied by assuming that the cell is able to change its height and shape in the third dimension to meet these constraints. In addition, the movement of the centroid as a result of perimeter extension and retraction implies adhesive interactions with the substrate, and the performance of work.
Points along the cell perimeter at a given time point, τ, are represented as vectors r with the cell centroid as the origin, each associated with a local protrusion signal, S+(r, τ), with a dimension of 1/length for its concentration. Protrusion signals represent collective signaling activities that stimulate actin polymerization near the plasma membrane. Retraction signals, S−(τ), on the other hand, are related to both long-range signals that stimulate myosin-dependent contractility, e.g., Rho (17), and rheological properties of the cytoplasm affected by stresses and strains over large areas of the cell. They allow a dominant leading edge to suppress protrusions and stimulate retractions elsewhere, and may be represented by a global variable.
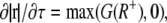
The balance between protrusion and retraction signals determines the evolution of the points at the cell perimeter. Retraction takes place at any point of the perimeter r when S+(r, τ) ≤ S−(τ). The rate of retraction is represented as
 |
(1) |
where rmin is a constant minimal radius and R− is a retraction rate constant with a dimension of 1/time. The linear dependence on |r| implies elastic behavior of the cytoplasm (18). The existence of an rmin takes into account a noncontractile or noncompressible central region including the nucleus, where actomyosin contractility is absent. The absence of S−(τ) from Eq. 1 implies that the retraction process is rate-limited not by the signal S−(τ) but by rheological properties of the cell.
Protrusion takes place when S+(r, τ) > S−(τ), at a rate represented as
 |
(2) |
where G(R+) is a Gaussian distribution function of average value R+ and variance R+, and R+ is the average protrusion rate of the cell boundary with a dimension of length/time. This equation confers stochasticity to an otherwise constant protrusion process, rate-limited by the kinetics of actin polymerization.
Adhesive cell types such as fibroblasts form membrane structures known as focal adhesions, which provide anchorage to the substrate and resist retractions (19). Focal adhesions in fibroblasts were modeled as point constraints of cell retraction. Retraction was inhibited when a perimeter point hit a focal adhesion, or fell within the convex hull as defined by neighboring focal adhesions. Focal adhesions are known to form near the leading edge during protrusion, and to remain stationary in most cases as cells move forward (20). In our model, they are assumed to form stochastically at protrusive perimeter points with a probability P+fa, and to disassemble stochastically with a probability P−fa.
Regulation of protrusion signals
The evolution of local protrusion signals at a given time point τ is calculated as
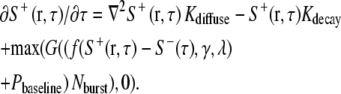 |
(3) |
Equation 3 consists of a deterministic part (first two terms), which describes the propagation and decay of protrusion signals, and a stochastic component (last term). Signal propagation is simplified as one-dimensional diffusion along the perimeter, in part to speed up the computation. In reality the process may involve active stimulation and/or transport of signaling molecules over a wider area, possibly involving multiple pathways, such as small GTPases (21), phosphoinositides (22,23), and phosphotyrosine (24) that directly or indirectly affect actin polymerization. The second deterministic term takes into account the decay of protrusion signals, which may involve GTP hydrolysis, dephosphorylation, phosphoinotide metabolism, and/or proteolysis.
The second part of Eq. 3 represents a stochastic positive feedback loop that accounts for both the “local stimulation” and the generation of random signals. New signals are released as bursts with an average magnitude of Nburst, multiplied by the rate of bursts whose average is expressed as f(S+(r, τ) − S−(τ), γ, λ) + Pbaseline. The positive feedback is represented by a piecewise linear function f(x, γ, λ), defined as
 |
(4) |
where λ represents the takeoff point for the feedback with a dimension of 1/length and γ is the slope or gain of the response with a dimension of 1/time. The feedback loop is responsible for generating more protrusion signals in protruding regions, where S+(r, τ) > S−(τ) + λ. It accounts for the fact that the signaling cascades for protrusion not only transduce, but also amplify the stimulus, as has been established for the signaling lipid PIP3 (23). In addition, for adhesive cells, anterior focal adhesions may respond to substrate interactions by generating new protrusion signals, as part of their signaling functions (21). The sustained autonomous locomotion of cell fragments is further evidence of a strong positive feedback loop intrinsic to the cellular motile machinery (25). Pbaseline, with a dimension of 1/(length × time), accounts for the rate of random bursts due to internal baseline activities, and is responsible for generating signals for random protrusions and turns. Stochasticity of new signals is controlled by the Gaussian distribution function G(α) with mean and variance equal to α.
Regulation of retraction signals
The retraction signal is specified by a simple global inhibition rule of the form
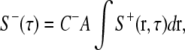 |
(5) |
where C− is an inhibition constant with a dimension of 1/length3, A is the total area of the cell, and the integration of protrusion signals is carried out over the cell perimeter. This equation encompasses several factors that contribute to the tendency of cells to retract. The inclusion of area, A, keeps an already well spread cell from spreading further, and may reflect a feedback loop that stimulates myosin-driven contractility or elasticity-based retraction as a function of cell spreading. Without this dependence, the cell area becomes very unstable. A similar rule relating the effects of myosin-driven contractility to the cell area was used by Nishimura and Sasai (26). The protrusion signals, integrated around the cell border, ∫S+(r, τ)dr, couple retraction with total protrusive activities. It may involve signaling elements like the small GTPase Rho that responds to protrusive activities over a long range (17), or the phosphatase PTP-PEST (27).
Equations 1–5 involve a mere nine parameters for cells without focal adhesions, R−, R+, Kdiffuse, Kdecay, Nburst, Pbaseline, λ, γ, C−, and two additional parameters, P+fa and  for focal adhesions (Table 1). In addition, a parameter to be described later defines the timescale for calibrating the migration speed of the model against experimental results.
NUMERICAL IMPLEMENTATION OF THE MODEL
Computation of cell shape and migration (see supplemental source code)
The cell was defined by its perimeter points relative to the center (xc, yc), with r expressed in polar coordinates (θj, rj), j = 1,…,360, such that there was one perimeter point per degree. At any time point, i, the extension or retraction of a perimeter point, j, was controlled by the balance between a local protrusion signal,  and a global retraction signal,
  as described above. Protrusion and retraction took place as an increase or decrease in rj. This resulted in change of the cell shape and movement of the cell center (xc, yc) (Fig. 1). Although radial extension/retraction prevented certain complex shapes such as a dumbbell or a broad growth cone at the tip of an axon, it did not significantly limit the modeling of normal amoeboid movement, since most shapes extracted from experimental recordings of Dictyostelium were expressed readily in this polar coordinate system. The equations for retraction and extension per iteration were similar to corresponding Eqs. 1 and 2, respectively.
 |
(1′) |
 |
(2′) |
where rmin was set as a constant of 10 pixels or 2.86 microns for Dictyostelium.
FIGURE 1.

Shape machine for modeling cell migration. (A) Shape change is driven by the decrease (gray arrowheads pointing inward) or increase (double black arrowheads pointing outward) of the radius at each point along the perimeter. (B) The center of the cell is shifted as a result of the shape change (black arrow). (C) The angle and radius at each perimeter point are then recalculated relative to the new cell center.
Focal adhesions were allowed to form at protrusive perimeter points rj,i (i.e.,  ), as determined by a stochastic Boolean function ϕ(
 ), which was true with probability
  and false with probability 1 −
  Focal adhesions were disassembled with a similar stochastic Boolean function,
  The halftime
  is related to
  as
as  = −ln 2/ln (1 −
  ).
).
Computation of protrusion and retraction signals
In the preceding sections, we introduced partial differential equations (Eqs. 1–5) for calculating the signals S+ and S−. For computational implementation, however, it was more convenient and efficient to use an approximated integrated form of Eq. 3, implemented as a coupled map lattice (28) in the generalized form of 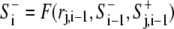 and S+j,i = F′(rj,i−1,
  S+j,i−1). This avoided the complexity of solving one-dimensional differential equations along a deformable boundary. At any iteration, i, the protrusion signal at a cell perimeter point, j, was computed according to
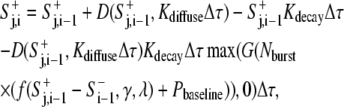 |
(3′) |
where Δτ is the time interval between i and i − 1 in the unit of iteration cycle, which equals 1 for the computation. It is shown for the sake of balancing the units. The second, third, and last terms on the righthand side account for the contributions of diffusion, decay, and generation of new signals, respectively, as shown in Eq. 3. The fourth term applies a correction due to the fact that diffusing signals also decay simultaneously. Except for the diffusion function D(), the definitions of functions and parameters remained the same as in Eq. 3.
We used a finite difference form for the diffusion term. When the rate was small, such that the distances between adjacent perimeter points dj−1,j,i and dj,j+1,i were both larger than the characteristic distance √(2Kdiffuse), the amount of signal diffusion was given by
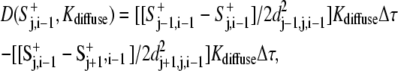 |
(6) |
where dj+1,j,i−1 was computed according to the radii rj+1,i−1 and rj,i−1 and an angular span of 1°:
 |
(7) |
The two terms on the righthand side of Eq. 6 represented contributions to the protrusion signal at site j by the diffusion from adjacent sites j − 1 and j + 1, respectively. When the distance between adjacent perimeter points was smaller than the characteristic distance √[2Kdiffuse], the effect of diffusion extended significantly beyond the adjacent sites and 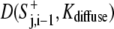 was calculated based on the average signal on each side of the point j, S+av j, i−1
 |
(8) |
where S+av j, i−1 is the average signal over a characteristic distance of √(2Kdiffuse). S+j,i from Eq. 3′ was set to 0 when it fell below a threshold of 10−4, otherwise cell behavior may be dominated by minuscule signals. The results were not affected significantly with this threshold set between 10−4 and 10−10.
At every time point, the retraction signal was given through a global inhibition rule of the form similar to Eq. 5
 |
(5′) |
where the sum was taken over the cell perimeter.
The above equations were implemented in a C++ program on a personal computer. At t = 0, the model cell was assumed to have a circular shape with a radius of 10 pixels, the minimal radius rmin. Protrusion signals were assumed to be at a pseudo-steady state,  and to have a constant value around the cell perimeter (i.e., no diffusion). Therefore, after setting D = 0, S+j,i+1 =
  simplifying G(x) to x in Eq. 3′, and setting A = 100π in Eq. 5′, we obtained
 |
(9) |
when the resulting  ≥ λ/(1 − π36000C−); otherwise,
 |
(10) |
 was then calculated as
Calculation of metrics and calibration of the model
The shape and migration of model and experimental cells were characterized with a set of metrics, including maximal radius, area, area fluctuations, speed, roundness, and persistence (29). Metrics for simulations were computed every n iterations (referred to as the sampling interval) during the steady state, which spanned between the 2000th and 25,000th iterations after initiation of the simulation. These quantities were averaged over the period of experimental observations or computational simulations. Area was calculated as  Area fluctuation was the standard deviation of the area over the period of observation or simulation, and shared the same unit as area. Speed was defined as the displacement of centroid per sampling interval. Roundness was defined as A/πR2, where A represents the area and R = max(rj), j = 1,…,360. Persistence of centroid movement was defined, for a given persistence reference length L, as L/(speed × T), where speed was the average speed of the cell, and T was the average time needed for the cell to migrate for a net displacement of L. Therefore, persistence measured the actual displacement against (speed × T), which was the net displacement if the migration were entirely persistent (persistence = 1; Supplementary Material, Fig. S1 A). Persistence was a function of L (Fig. S1 B) and had a theoretical range between 0 and 1. In practice, the value L was chosen such that the resulting persistence was between 0.5 and 0.8.
To match the temporal scale of the model with that of experimental observations, the sampling interval of the model, n, was treated as a variable such that time-dependent metrics (i.e., speed, persistence, and area fluctuation) matches those measured experimentally. Thus, n iterations of computation became equivalent to one interval of image acquisition, which was 1 s. Length scale was determined by imaging a calibrated micron scale, which yielded 3.5 pixels per micron.
Constrained particle swarm optimization
Numerical optimization was used for unbiased search for conditions where the behavior of the model matched that of Dictyostelium as judged by the set of metrics defined above. Numerical optimization involved the definition of a fitness function that measured the difference between the model and experimental cells. The fitness function was defined as √Σi[[mi − mi0]/σi0]2/√n, where i was indexed over the six metrics defined above, mi was the model metrics, mi0 was the average experimental metrics, and σi0 was the standard deviation of the experimental metrics. mi0 and σi0 were obtained from eight cells recorded for 20 min under each condition (Table 2).
TABLE 2.
Experimental metrics of control and nocodazole-treated Dictyostelium
| Maximum radius(μm) | Area (μm2) | Area fluctuation* (μm2) | Speed (μm/s) | Roundness | Persistence† | |
|---|---|---|---|---|---|---|
| Control | 25 (2/2) | 1080 (137/22) | 22 (11) | 0.31 (0.21/0.04) | 0.55 (0.08/0.06) | 0.77 (0.09/0.06) |
| Nocodazole | 29 (4/3) | 1230 (277/42) | 42 (15) | 0.32 (0.12/0.04) | 0.45 (0.09/0.06) | 0.51 (0.13/0.13) |
Definitions of the six metrics are given in the section Calculation of metrics and calibration of the model. The measurements are performed on eight cells for each condition, and the recording period for each cell is 20 min at intervals of 0.8–1.5 s. These measurements yield average values over the recording period for each cell  and the corresponding standard deviations
  where V represents the metrics. The averages and standard deviations of
  are the value outside the parentheses and the first term in the parentheses, respectively. The averages of
  are shown as the second term in the parentheses.
Area fluctuation for each cell is defined as the standard deviation of the area over the period of the observation, i.e.,  for the area. Therefore, it has the same unit as Area, and the same value as the second term in parentheses for Area. In addition, there is only one standard deviation for Area fluctuation, which is the standard deviation of
  for area.
Reference persistence lengths used, L, were 48.58 μm for the control and 38.87 μm for nocodazole-treated cells (see Calculation of metrics and calibration of the model, and Fig. S1).
A slightly modified version of the particle swarm optimization algorithm was used to search for conditions that minimized the fitness function (30). The algorithm was particularly efficient for exploring large multidimensional spaces for global minimum (our model has 10 variables to optimize), and was insensitive to the starting condition. The approach was also relatively robust against the noisy fitness function due to the stochastic nature of the model. Briefly, the multidimensional parametric space was surveyed by a number of interacting “particles” that traveled through the space. The initial particle positions followed a random logarithmic distribution to improve sampling of the space. Particle velocities were bound to one-fourth of their maximal values, and the best historic position of each particle was routinely reevaluated to avoid false solutions due to the inherent noise of the model. In addition, each input parameter was constrained to be both positive and smaller than a defined maximal value. Particles reversed the direction of travel when any parameter hit its boundaries.
The computation was parallelized using the message-passing interface (MPI) on a Linux cluster, which was particularly suitable for efficient computation of multiple independent searching particles. The cluster had 174 nodes of dual AMD Opteron processors. Each session of computation typically used 20–25 nodes and required <100 rounds of evaluations for convergence. We collected solutions where the fitness was <0.07 and all the metrics were within 15% of experimental measurements. Correlation of input parameters among the solutions was detected by scatter plots and linear regression using Microsoft Excel. Statistical significance of the correlation of each pair was determined by the t-test, with t calculated as r √(N − 2)/√(1 − r2), where r was the Pearson correlation coefficient and N was the sample size. Full factorial ANOVA analysis of the impact of input parameters on metrics was performed with SAS (version 9) using a general linear model procedure.
EXPERIMENTAL METHODS
Culture and imaging of Dictyostelium
Dictyostelium discoideum AX3 cells, a kind gift from D. A. Larochelle (Clark University, Worcester, MA), were cultured in HL5 media on polystyrene plates and harvested during the log phase for imaging. Cells were plated underneath a 1% agarose gel in HL5 media, on plastic dishes in which the bottoms were replaced with glass coverslips. After 30 min of spreading between the glass and the agarose, cells were imaged with a Zeiss IM35 inverted microscope using a 40× phase-contrast objective (Thornwood, NY). Cells with a visually typical spreading area as seen in the population were selected for recording. Time-lapse images were acquired with a video-rate charge-coupled device camera (12V1E-EX, Mintron, Santa Clara, CA) at 0.8- to 1.5-s intervals for a period of 20 min using custom software. For microtubule depolymerization, cells were treated with 20 μM nocodazole (Sigma, St. Louis, MO) for 1 h before imaging. The same concentration of nocodazole was present in the 1% agarose gel overlay during image acquisition.
Boundary extraction from cell images
Extraction of boundaries of experimental cells was automated via image segmentation. Briefly, a Perl script invoking filters from the Insight Toolkit Library (version 2.6.0; National Library of Medicine) and functions from ImageMagick (version 6.2.2) were used to convert cell images into binary bitmaps. The main components of the script were a region-growing, confidence-connected filter and a level-set shape-detection filter. Linear coordinates of cell boundaries were then extracted from bitmaps using customized software in C, and converted to polar coordinates, as for model cells. The shape and migration characteristics were then analyzed using the same metrics as applied to the model.
RESULTS
Modeling the shape and migration of Dictyostelium
We have built a top-down model that generates 2D cell shapes and movements under the control of a minimal implementation of the local-stimulation-global-inhibition mechanism. The behavior of model and experimental cells was compared using a set of metrics (Table 2), three of which measured cell shape (area, maximal radius, and roundness) and three of which measured dynamic behavior (area fluctuation, speed, and persistence). Experimental metrics were obtained by automatic extraction of the cell contour from time-lapse images of Dictyostelium migrating under an agarose overlay (31), which forced the cell to take a 2D shape in agreement with the 2D nature of the model, and eliminated complications due to 3D extensions and tumbling of the cell body (32). Details on the definition of the metrics and the procedure used for extracting cell contours are presented in the sections on Calculation of metrics and calibration of the model and Boundary extraction from cell images.
To match the model with experimental observations (Table 2), we searched for set(s) of input parameters that minimized their differences, based on a fitness function that measured aggregated differences in metrics. The search was conducted in a nonbiased way using the recently developed method of particle swarm optimization (PSO) (30), a social-biology-like strategy with multiple interacting “agents” that traveled through the multidimensional parameter space (see Constrained particle swarm optimization). This approach outperformed the alternatives tested (e.g., simplex method (33)) due to its robustness against stochastic noise, its efficiency for exploring high-dimensional space, its lack of sensitivity to initial conditions, and its suitability for parallelization.
Analysis of conditions that regenerate the Dictyostelium behavior
We were surprised to find hundreds of distinct conditions that met the metrics criteria, as confirmed by visual inspection of the resulting shapes and migration patterns that mimic live Dictyostelium (see Fig. 4 A and Supplementary Material, Movie S1). Some of the parameters, such as burst rate, Pbaseline, burst size, Nburst, and the slope of positive feedback, γ, spanned a wide range of values, whereas other parameters, such as the inhibition constant, C−, and the rate of retraction, R−, were confined within a narrow range (Table 3 and Fig. 2 A). Attempts at classifying the solution space via cluster analysis did not reveal any apparent structure of the data, suggesting that the solution space is a continuous subspace of the parameter space.
FIGURE 4.

Shape and migration pattern of experimental and model Dictyostelium, for control cells (A) and nocodazole-treated cells (B). The path is shown as overlapping cell contours from four representative experimental (a–d) or model (e–h) cells. Interval between successive cell contours is 40 s. Model cells are generated with parameters from one of the PSO solutions near the centroid of the set of answers. Asterisks indicate the starting point of the path. Scale bar, 50 μm.
TABLE 3.
Conditions for generating normal Dictyostelium behavior
| Average | Standard deviation | Minimum | Maximum | |
|---|---|---|---|---|
| Diffusion rate, Kdiffuse (μm2/s) | 1.19 × 101 | 5.49 | 5.06 | 3.08 × 101 |
| Decay rate, Kdecay (1/s) | 2.42 × 10⁻² | 7.73 × 10⁻³ | 1.03 × 10⁻² | 5.85 × 10⁻² |
| Random burst rate, Pbaseline (1/s × 1/μm) | 1.81 × 10⁻¹ | 1.42 × 10⁻¹ | 3.15 × 10⁻² | 6.45 × 10⁻¹ |
| Burst size, Nburst | 1.30 × 101 | 6.39 | 1.32 | 2.41 × 101 |
| Protrusion inhibitor, C− (1/μm3) | 3.26 × 10⁻⁶ | 6.08 × 10⁻⁸ | 3.07 × 10⁻⁶ | 3.47 × 10⁻⁶ |
| Protrusion rate, R+ (μm/s) | 1.03 × 10⁻¹ | 2.45 × 10⁻² | 5.24 × 10⁻² | 1.59 × 10⁻¹ |
| Retraction rate, R− (1/s) | 2.81 × 10⁻² | 3.04 × 10⁻³ | 2.01 × 10⁻² | 3.64 × 10⁻² |
| Feedback slope, γ (1/s) | 2.91 × 101 | 1.50 × 101 | 4.04 | 7.27 × 101 |
| Feedback takeoff point, λ (1/μm) | 3.22 | 8.47 × 10⁻¹ | 1.55 | 5.04 |
PSO was used to generate ∼300 conditions that reproduce the shape and migration pattern of Dictyostelium, as determined by six metrics (Table 2) and a fitness function that measured the aggregated difference between the model and experimental cells (see Constrained particle swarm optimization).
FIGURE 2.

Conditions that reproduce cell shape and movement of control Dictyostelium cells. (A) Box plot representation of the distribution of values for each parameter. Units (described in Table 3) have been omitted for clarity. Boxes represent first quartile, median (middle bar), and third quartile; vertical lines indicate maximum and minimum values. (B) Heat map indicating parameters that significantly influence each of the cell metrics according to the full factorial ANOVA analysis. Gray levels indicate p values with white representing the most significant (lowest p values) and black the least significant (high p values). The values are clustered as follows: p > 10−2 > 10−3 > 10−4 > 10−6 > 10−8 > 10−12 > 10−16 > 10−24 > 10−32 > 10−48 > 10−64 > 10−96 > 10−128.
We performed pairwise scatter plots to identify possible relationships among the solutions. The strongest correlation was found between the decay rate of protrusion signals, Kdecay, and the net production of random protrusion signals, Nburst × Pbaseline (R2 > 0.95; Table 4 and Fig. 3). Their mutual compensation explains the wide range of these parameters (Table 3). To explore further the impact of each parameter on each of the behavior metrics, we performed statistical analysis using a full factorial design. We chose the reference point as the solution lying closest to the center of mass of the solution set. Then we built a set of 29 = 512 conditions around the reference point, corresponding to a hypercube in the nine-dimensional parameter space. Each condition differed from the reference point by increasing or decreasing one or more of the parameters by one standard deviation (Table 3). The metrics under each condition were then determined and analyzed by ANOVA, for the impact of each of the nine parameters and all of the two-parameter interactive factors (a total of 45 factors) on each of the metrics. The analysis, shown as a heat map (Fig. 2 B), indicated that eight out of the nine parameters were essential for fitting the model (p < 0.0001). In addition, seven interactive factors also had a significant effect on cell behavior. The decay rate of protrusion signals, Kdecay, and the net production of random protrusion signals, Nburst × Pbaseline, were found to be universally important, affecting all metrics. Their similar impacts were consistent with the mutual compensation seen in the scatter plot analysis.
TABLE 4.
Correlation between pairs of parameters that generate normal Dictyostelium behavior
| Diffusion rate, Kdiffuse | Decay rate, Kdecay | Random burst rate, Pbaseline | Burst size, Nburst | Protrusion inhibitor, C− | Protrusion rate, R+ | Retraction rate, R− | Feedback slope, γ | |
|---|---|---|---|---|---|---|---|---|
| Decay rate, Kdecay | 0.1635 | |||||||
| Random burst rate, Pbaseline | NS | NS | ||||||
| Burst size, Nburst | NS | NS | 0.6463 | |||||
| Protrusion inhibitor, C− | 0.1345 | 0.3612 | NS | NS | ||||
| Protrusion rate, R+ | 0.1457 | NS | 0.2563 | 0.2186 | NS | |||
| Retraction rate, R− | 0.2878 | NS | 0.1680 | NS | NS | 0.2951 | ||
| Feedback slope, γ | NS | NS | NS | 0.1049 | NS | NS | NS | |
| Feedback takeoff point, λ | NS | 0.6087 | NS | 0.3252 | 0.3352 | 0.1762 | NS | 0.1001 |
| Burst rate × burst size, Pbaseline × Nburst | NS | 0.9541 | NS | 0.1465 | 0.3660 | NS | NS | 0.7810 |
Values indicate R2 of linear regression of the scatter plot between two parameters, determined from ∼300 sets of conditions. NS, insignificant correlation, with a two-tailed null-hypothesis probability p > 0.02, or R2 < 0.1. Bold numbers indicate strongest correlations (see Fig. 4 for scatter plots).
FIGURE 3.

Correlation between parameters that generate normal Dictyostelium behavior. Several pairs of parameters from a collection of 328 solutions that generate equivalent Dictyostelium behavior are plotted as scatter plots and fit with linear regression. R2 values for other pairs are shown in Table 4.
Other parameters showed differential impact on specific metrics. For example, the inhibition constant, C−, has a strong effect only on the spread area, as it can be intuitively rationalized from Eq. 5. In addition, the diffusion coefficient, Kdiffuse, controls the propagation of signals around the cell perimeter, and its effects on cell roundness make intuitive sense. Also readily explained were the dependence of roundness on the rates of protrusion, R+, and retraction, R−, and the effects of R+ on speed and maximal radius. It is important to emphasize that the outcome of such analysis is likely to vary among different cell types.
Dissecting the functional role of microtubules in cell shape control and migration
By comparing the conditions that generate the behavior of normal cells and cells manipulated pharmacologically or genetically, the model presented here may serve as a powerful tool for determining potential targets of specific proteins in the control circuit. We have applied this approach to Dictyostelium treated with nocodazole to depolymerize microtubules. At the concentrations of nocodazole used (20 μM), only a small number of short microtubules remained in the region immediately surrounding the microtubule organizing center (34), effectively depleting the microtubules that interact with the cell cortex.
Experimental metrics for nocodazole-treated cells were obtained as for control cells. The most prominent differences were a decrease in the persistence of cell migration and an increase in the fluctuation of spread area (Fig. 4 B and Table 2), consistent with the loss of polarity and shape stability for other cell types treated with nocodazole (17). There was also a significant increase in spread area and a decrease in roundness (p < 0.001). Modeling these characteristics using PSO led to a set of conditions distinct from those for control cells. Relative to the standard deviation, the most significant differences were an 81% increase in the rate of retraction, R−, a 46% increase in Kdecay, and a 13% decrease in the inhibition constant, C− (Fig. 5 A). Other parameters that showed statistically significant differences (p < 0.005) were Kdiffuse and γ (Fig. 5 A).
FIGURE 5.

(A) Parameters that generate the behavior of nocodazole-treated Dictyostelium cells relative to those for control cells. Black bars indicate the percentage change of each of the parameters upon nocodazole treatment (left). Asterisks indicate statistically insignificant differences (p > 0.005). White bars indicate retraction and protrusion rates predicted by the model using PSO, whereas black bars indicate experimentally measured retraction and protrusion rates (center and right). Error bars are standard deviations over the optimization solution space. (B) Box plot representation of the distribution of parameters for generating the behavior of control (black; same as in Fig. 2 A) or nocodazole-treated Dictyostelium (gray).
The rates of retraction and protrusion were both parameters for the model and experimentally measurable quantities, and may serve as a means for validating the computation. Analysis of the experimental movies indicated an increase in retraction rate for nocodazole-treated cells compared to control cells, in agreement with the model (Fig. 5 A). Qualitatively, the increase in retraction rate was visible as a more rapid collapse of the tail in nocodazole-treated cells compared to control cells (see Movies S1 and S2 for experimental results and Movies S3 and S4 for matching simulations). In addition, consistent with the model, measurements of experimental protrusion rates showed no significant effect of nocodazole treatment (Fig. 5 A). However, the measured protrusion rates were several times larger than modeled values. Visual inspection of the movies indicated that protrusions in experimental cells were more transient and localized than those in model cells, which likely accounted for the higher values.
Mathematical transformation from Dictyostelium to other cell types
By systematically changing each parameter, we were able to test the effects of specific “mathematical mutations” on cell shape and migration (Table 5 and Fig. 6). Addition of focal adhesions, which were modeled as anchorage points resisting retractions, turned model Dictyostelium into wedge-shaped cells with retraction fibers (Fig. 6 B and Movie S5), characteristic of fibroblasts. In addition, the movement showed surges after tail detachment, as reported with migrating fibroblasts (1). Alternatively, an increase in positive feedback, by decreasing the takeoff point λ, was sufficient to cause model Dictyostelium to transform into a stable half-moon shape and to move with a constant speed and high persistence, characteristic of keratocytes (Fig. 6 C and Movie S6). Finally, simultaneous decreases in Kdiffuse, Kdecay, Pbaseline, R−, and λ lead to a stationary cell body and a thin, highly localized protrusion characteristic of neurons (Fig. 6 D and Movie S7). It is interesting that none of the phenotypic changes for these transformations required a change in the slope of the positive feedback loop, γ, consistent with its low impact indicated by the factorial analysis.
TABLE 5.
Changes necessary to transform Dictyostelium into other cell types
| Fibroblasts | Neurons | Keratocytes | |
|---|---|---|---|
| Diffusion rate, Kdiffuse | 1 | 0.01 | 1 |
| Decay rate, Kdecay | 1 | 0.01 | 1 |
| Random burst rate, Pbaseline | 1 | 0.0001 | 1 |
| Burst size, Nburst | 1 | 1 | 1 |
| Protrusion inhibitor, C− | 1 | 1 | 1 |
| Protrusion rate, R+ | 1 | 0.1 | 1 |
| Retraction rate, R− | 1 | 0.01 | 1 |
| Feedback slope, γ | 1 | 1 | 1 |
| Feedback takeoff point, λ | 1 | 0 | 0.3 |
FA formation probability, 
|
0.003 | NA | NA |
FA half-life, 
|
30 | NA | NA |
Change in parameters is expressed as the ratio between the new value and the Dictyostelium value, except for FA, which is expressed in absolute values.
FIGURE 6.

Steady-state shape and migration pattern of generic cell types derived from model Dictyostelium cells. The cell shape (black) and migration path (gray) are shown for model Dictyostelium (A), fibroblasts (B), keratocytes (C), and neurons (D). The circle is drawn around the cell centroid at the starting point of migration. The corresponding movies are shown in Movies S3, S5, S6, and S7.
DISCUSSION
By its nature, quantitative modeling does not provide direct evidence for a hypothetical mechanism, but serves as a powerful tool to test whether it is sufficient to explain experimental observations and to generate new hypotheses. The approach is particularly useful for testing the outcome of complex interactions between structural and regulatory mechanisms, which can be difficult or misleading to predict based on intuition. Conversely, it can be equally challenging to interpret complex phenotypes, such as changes in cell shape or migration pattern. Mathematical modeling provides a unique approach for understanding these phenotypes in terms of specific mechanisms.
Modern cell biology has focused largely on understanding specific molecules and molecular assemblies. The basic premise of this reductionist approach is that by characterizing all the molecules and potential molecular interactions in a cell, one should be able to put the pieces together and understand how cells function. However, although this approach may be highly effective against problems of a limited scale, it can be challenging when addressing complex functions that involve multiple hierarchical interactions at a cellular or multicellular level, as the task is likely to encompass a wide range of scales from single molecules to interactive functions created by large ensembles of molecules across the entire cell.
In this study, we have focused on the function of the local-stimulation-global-inhibition mechanism in regulating cell shape and migration. Due to the complexity of these processes and incomplete knowledge about the inventory of proteins and their properties, we decided to use a top-down approach that dissects a cell into a limited number of interacting modules, each of which may represent the collective functional output of an ensemble of molecules. As a starting point, our model involved only 10 variables and four functional modules representing protrusion, retraction, a local positive feedback loop promoting protrusions, and a global negative feedback loop inhibiting protrusions and promoting retractions. The general involvement of local stimulation global inhibition has received strong support in the field of chemotaxis (15). In addition, previous experiments have implicated the PI3 kinase and the small GTPase Rac in positive feedback at the leading edge (17,36–37), and the phosphatase PTEN and the small GTPase Rho in maintaining a retracting tail (16,17,38).
Our results indicate that a minimal implementation of this local-stimulation-global-inhibition mechanism is sufficient to explain the complex behavior of Dictyostelium cells, including their amoeboid shapes and persistent random walks in the absence of chemotactic signals. In addition, adding a minuscule bias to the random protrusion signals, Pbaseline, was sufficient to induce directed migration reminiscent of chemotaxis (Y.-L. Wang, unpublished observations). To our surprise, blind search with the PSO algorithm generated a large number of conditions with equivalent behavior. Although the inclusion of additional metrics, such as the temporal periodicity of area or the fluctuation of speed, may reduce the degree of degeneracy, the strong correlation between some of the parameters indicates a mutually compensatory relationship analogous to genetic complementation. Indeed, some of these relationships make intuitive sense. For example, an increase in stochastic signal production (Pbaseline × Nburst, or frequency of random pulses multiplied by the magnitude of the pulse) may be compensated by a higher rate of signal degradation, Kdecay. Such complementation is likely to be critical for adaptation, and may occur with or without physical interactions between the functional modules.
One of the most useful aspects of the approach described here is its ability to model complex phenotypes as a result of pharmacological or genetic manipulations, which allows descriptive observations to be understood in terms of perturbations to specific functional modules. The analysis of Dictyostelium treated with nocodazole to depolymerize microtubules provides an informative example. Depolymerization of microtubules is known to have visible effects on the shape and migration pattern of a number of cell types, which have been attributed to changes in polarity (39), contractility (40), adhesion (41), or pseudopod formation (42). However, the exact roles of microtubules in the motile machinery remain unclear. Our analysis revealed three major effects of microtubule depolymerization: a 1.8-fold increase in the rate of retraction, R−; a 1.5-fold increase in the decay rate of protrusion signals, Kdecay; and a 13% decrease in the global inhibition constant, C−. The change in C− readily explained the increase in cell area in nocodazole, according to the factorial analysis (Fig. 2 B). In addition, the increase in retraction rate, confirmed by experimental measurements, appeared consistent with the increase in the contractility of mammalian cells upon microtubule disassembly (40). Depolymerization of microtubules in amoeba also caused a shorter lifetime of pseudopods (42), which may be due to the increase in signal decay rate. Shorter lifetime of pseudopods may in turn explain the decrease in polarity (17), higher fluctuation in cell area, and lower persistence of cell migration.
Further insights were gained by mathematically “mutating” various parameters and observing the effects on cell shape and migration. We showed that such changes can lead to drastically different shapes and migration behaviors, mimicking various cell types. In retrospect, the effects seem logical. For example, a keratocytelike behavior may be explained by a strong positive feedback that broadens the lamellipodia. Conversely, a neuronlike behavior requires a very low rate of retraction to maintain a stationary cell body, a low rate of diffusion to confine the protrusion to the growth cone, a low rate of decay to maintain a persistent growth cone, and a low burst rate of random signals to suppress the formation of new protrusions. Our results further indicate that destabilization of focal adhesions was sufficient to cause the transformation of wedge-shaped fibroblasts to amoeboid cells, as observed with transformed cells (43). The conditions for generating these different cell behaviors shed important light on the mechanism responsible for diverse cell shapes and migration patterns.
The model presented here represents the first step of a “top-down” refining process, during which each module is progressively replaced with multiple submodules, and each parameter is replaced with a function of multiple parameters to approach the complexity of live cells. The model will generate an increasing number of testable predictions as the complexity increases, and the interactive cycles of mathematical modeling and experimentation should lead toward a fundamental understanding of cell migration. A similar approach, where abstract functional modules, rather than molecules, serve as the basic unit of analysis, may be applicable to a wide range of problems in cell biology.
SUPPLEMENTARY MATERIAL
To view all of the supplemental files associated with this article, visit www.biophysj.org.
Acknowledgments
We would like to thank Drs. Denis Larochelle, Beth Luna, and Natalie Andrew for advice on Dictyostelium culture, and Rex Chisholm for providing preliminary images.
This project was supported by a National Institutes of Health grant (GM-32476) to Y.-L.W. and R.L. J.S. was supported by National Institutes of Health training grant T32 HD07312.
Editor: Alexander Mogilner.
References
- 1.Chen, C. S., M. Mrksich, S. Huang, G. M. Whitesides, and D. E. Ingber. 1997. Geometric control of cell life and death. Science. 276:1425–1428. [DOI] [PubMed] [Google Scholar]
- 2.Alberts, B., A. Johnson, J. Lewis, M. Raff, K. Roberts, and P. Walter. 2002. Molecular Biology of the Cell. Garland Science, New York.
- 3.Dunn, G. A. 1983. Characterising a kinesis response: time averaged measures of cell speed and directional persistence. Agents Actions Suppl. 12:14–33. [DOI] [PubMed] [Google Scholar]
- 4.Cooper, M. S., and M. Schliwa. 1986. Motility of cultured fish epidermal cells in the presence and absence of direct current electric fields. J. Cell Biol. 102:1384–1399. [DOI] [PMC free article] [PubMed] [Google Scholar]
- 5.Rubinstein, B., K. Jacobson, and A. Mogilner. 2005. Multiscale two-dimensional modeling of a motile simple-shaped cell. SIAM MMS. 3:413–439. [DOI] [PMC free article] [PubMed] [Google Scholar]
- 6.Bottino, D., A. Mogilner, T. Roberts, M. Stewart, and G. Oster. 2002. How nematode sperm crawl. J. Cell Sci. 115:367–384. [DOI] [PubMed] [Google Scholar]
- 7.Satyanarayana, S. V. M., and A. Baumgaertner. 2004. Shape and motility of a model cell: a computational study. J. Chem. Phys. 121:4255–4265. [DOI] [PubMed] [Google Scholar]
- 8.Maree, A. F. M., A. Jilkine, A. Dawes, V. A. Grieneisen, and L. Edelstein-Keshet. 2006. Polarization and movement of keratocytes: a multiscale modelling approach. Bull. Math. Biol. 68:1169–1211. [DOI] [PubMed] [Google Scholar]
- 9.Mogilner, A., and L. Edelstein-Keshet. 2002. Regulation of actin dynamics in rapidly moving cells: a quantitative analysis. Biophys. J. 83:1237–1258. [DOI] [PMC free article] [PubMed] [Google Scholar]
- 10.Glazier, J. A., and F. Graner. 1993. Simulation of the differential adhesion driven rearrangement of biological cells. Phys. Rev. E Stat. Phys. Plasmas Fluids Relat. Interdiscip. Topics. 47:2128–2154. [DOI] [PubMed] [Google Scholar]
- 11.Abercrombie, M. 1980. The crawling movement of metazoan cells. Proc. Royal Soc. B. (Lond.). 207:129–147. [Google Scholar]
- 12.Meinhardt, H. 1999. Orientation of chemotactic cells and growth cones: models and mechanisms. J. Cell Sci. 112:2867–2874. [DOI] [PubMed] [Google Scholar]
- 13.Rappel, W. J., P. J. Thomas, H. Levine, and W. F. Loomis. 2002. Establishing direction during chemotaxis in eukaryotic cells. Biophys. J. 83:1361–1367. [DOI] [PMC free article] [PubMed] [Google Scholar]
- 14.Postma, M., L. Bosgraaf, H. M. Loovers, and P. J. M. Van Haastert. 2004. Chemotaxis: signalling modules join hands at front and tail. EMBO Rep. 5:35–40. [DOI] [PMC free article] [PubMed] [Google Scholar]
- 15.Ma, L., C. Janetopoulos, L. Yang, P. N. Devreotes, and P. A. Iglesias. 2004. Two complementary, local excitation, global inhibition mechanisms acting in parallel can explain the chemoattractant-induced regulation of PI(3,4,5)P-3 response in Dictyostelium cells. Biophys. J. 87:3764–3774. [DOI] [PMC free article] [PubMed] [Google Scholar]
- 16.Iijima, M., Y. E. Huang, and P. Devreotes. 2002. Temporal and spatial regulation of chemotaxis. Dev. Cell. 3:469–478. [DOI] [PubMed] [Google Scholar]
- 17.Xu, J. S., F. Wang, A. Van Keymeulen, P. Herzmark, A. Straight, K. Kelly, Y. Takuwa, N. Sugimoto, T. Mitchison, and H. R. Bourne. 2003. Divergent signals and cytoskeletal assemblies regulate self-organizing polarity in neutrophils. Cell. 114:201–214. [DOI] [PubMed] [Google Scholar]
- 18.Heidemann, S. R., S. Kaech, R. E. Buxbaum, and A. Matus. 1999. Direct observations of the mechanical behaviors of the cytoskeleton in living fibroblasts. J. Cell Biol. 145:109–122. [DOI] [PMC free article] [PubMed] [Google Scholar]
- 19.Burridge, K., M. Chrzanowska-Wodnicka, and C. L. Zhong. 1997. Focal adhesion assembly. Trends Cell Biol. 7:342–347. [DOI] [PubMed] [Google Scholar]
- 20.DePasquale, J. A., and C. S. Izzard. 1987. Evidence for an actin-containing cytoplasmic precursor of the focal contact and the timing of incorporation of vinculin at the focal contact. J. Cell Biol. 105:2803–2809. [DOI] [PMC free article] [PubMed] [Google Scholar]
- 21.Raftopoulou, M., and A. Hall. 2004. Cell migration: Rho GTPases lead the way. Dev. Biol. 265:23–32. [DOI] [PubMed] [Google Scholar]
- 22.Insall, R. H., and O. D. Weiner. 2001. PIP3, PIP2, and cell movement–similar messages, different meanings? Dev. Cell. 1:743–747. [DOI] [PMC free article] [PubMed] [Google Scholar]
- 23.Weiner, O. D., P. O. Neilsen, G. D. Prestwich, M. W. Kirschner, L. C. Cantley, and H. R. Bourne. 2002. A PtdInsP(3)- and Rho GTPase-mediated positive feedback loop regulates neutrophil polarity. Nat. Cell Biol. 4:509–513. [DOI] [PMC free article] [PubMed] [Google Scholar]
- 24.Parsons, J. T. 2003. Focal adhesion kinase: the first ten years. J. Cell Sci. 116:1409–1416. [DOI] [PubMed] [Google Scholar]
- 25.Verkhovsky, A. B., T. M. Svitkina, and G. G. Borisy. 1999. Self-polarization and directional motility of cytoplasm. Curr. Biol. 9:11–20. [DOI] [PubMed] [Google Scholar]
- 26.Nishimura, S. I., and M. Sasai. 2007. Modulation of the reaction rate of regulating protein induces large morphological and motional change of amoebic cell. J. Theor. Biol. 245:230–237. [DOI] [PubMed] [Google Scholar]
- 27.Sastry, S. K., Z. Rajfur, B. P. Liu, J. F. Cote, M. L. Tremblay, and K. Burridge. 2006. PTP-PEST couples membrane protrusion and tail retraction via VAV2 and p190RhoGAP. J. Biol. Chem. 281:11627–11636. [DOI] [PMC free article] [PubMed] [Google Scholar]
- 28.Kaneko, K. 1993. Theory and Applications of Coupled Map Lattices. Wiley, Chichester, UK.
- 29.Soll, D. R., D. Wessels, P. J. Heid, and H. Zhang. 2002. A contextual framework for characterizing motility and chemotaxis mutants in Dictyostelium discoideum. J. Muscle Res. Cell Motil. 23:659–672. [DOI] [PubMed] [Google Scholar]
- 30.Kennedy, J., and R. Eberhart. 1995. Particle swarm optimization. Proc. IEEE Int. Conf. Neural Netw. 4:1942–1948. [Google Scholar]
- 31.Yumura, S., H. Mori, and Y. Fukui. 1984. Localization of actin and myosin for the study of ameboid movement in Dictyostelium using improved immunofluorescence. J. Cell Biol. 99:894–899. [DOI] [PMC free article] [PubMed] [Google Scholar]
- 32.Shutt, D. C., D. Wessels, K. Wagenknecht, A. Chandrasekhar, A. L. Hitt, E. J. Luna, and D. R. Soll. 1995. Ponticulin plays a role in the positional stabilization of pseudopods. J. Cell Biol. 131:1495–1506. [DOI] [PMC free article] [PubMed] [Google Scholar]
- 33.Nelder, J. A., and R. Mead. 1965. A simplex method for function minimization. Comput. J. 7:308–313. [Google Scholar]
- 34.De Priester, W., P. Riegman, and A. Vonk. 1988. Effects of microtubule-disrupting agents on chemotactic events in Dictyostelium discoideum. Eur. J. Cell Biol. 46:94–97. [Google Scholar]
- 35.Reference deleted in proof.
- 36.Merlot, S., and R. A. Firtel. 2003. Leading the way: directional sensing through phosphatidylinositol 3-kinase and other signaling pathways. J. Cell Sci. 116:3471–3478. [DOI] [PubMed] [Google Scholar]
- 37.Park, K. C., F. Rivero, R. Meili, S. Lee, F. Apone, and R. A. Firtel. 2004. Rac regulation of chemotaxis and morphogenesis in Dictyostelium. EMBO J. 23:4177–4189. [DOI] [PMC free article] [PubMed] [Google Scholar]
- 38.Li, Z., X. Dong, Z. Wang, W. Liu, N. Deng, Y. Ding, L. Tang, T. Hla, R. Zeng, L. Li, and D. Wu. 2005. Regulation of PTEN by Rho small GTPases. Nat. Cell Biol. 7:399–404. [DOI] [PubMed] [Google Scholar]
- 39.Xu, J., F. Wang, A. Van Keymeulen, M. Rentel, and H. R. Bourne. 2005. Neutrophil microtubules suppress polarity and enhance directional migration. Proc. Natl. Acad. Sci. USA. 102:6884–6889. [DOI] [PMC free article] [PubMed] [Google Scholar]
- 40.Danowski, B. A. 1989. Fibroblast contractility and actin organization are stimulated by microtubule inhibitors. J. Cell Sci. 93:255–266. [DOI] [PubMed] [Google Scholar]
- 41.Krylyshkina, O., K. I. Anderson, I. Kaverina, I. Upmann, D. J. Manstein, J. V. Small, and D. K. Toomre. 2003. Nanometer targeting of microtubules to focal adhesions. J. Cell Biol. 161:853–859. [DOI] [PMC free article] [PubMed] [Google Scholar]
- 42.Ueda, M., and S. Ogihara. 1994. Microtubules are required in amoeba chemotaxis for preferential stabilization of appropriate pseudopods. J. Cell Sci. 107:2071–2079. [DOI] [PubMed] [Google Scholar]
- 43.Wolf, K., I. Mazo, H. Leung, K. Engelke, U. H. von Andrian, E. I. Deryugina, A. Y. Strongin, E. B. Brocker, and P. Friedl. 2003. Compensation mechanism in tumor cell migration: mesenchymal-amoeboid transition after blocking of pericellular proteolysis. J. Cell Biol. 160:267–277. [DOI] [PMC free article] [PubMed] [Google Scholar]