

Abstract
Skeletal muscle repair occurs through a programmed series of events including myogenic precursor activation, myoblast proliferation, and differentiation into new myofibers. We previously identified a role for Stem cell antigen-1 (Sca-1) in myoblast proliferation and differentiation in vitro. We demonstrated that blocking Sca-1 expression resulted in sustained myoblast cell division. Others have since demonstrated that Sca-1-null myoblasts display a similar phenotype when cultured ex vivo. To test the importance of Sca-1 during myogenesis in vivo, we employed a myonecrotic injury model in Sca-1−/− and Sca-1+/+ mice. Our results demonstrate that Sca-1−/− myoblasts exhibit a hyperproliferative response consisting of prolonged and accelerated cell division in response to injury. This leads to delayed myogenic differentiation and muscle repair. These data provide the first in vivo evidence for Sca-1 as a regulator of myoblast proliferation during muscle regeneration. These studies also suggest that the balance between myogenic precursor proliferation and differentiation is critical to normal muscle repair.
Keywords: Sca-1, muscle repair, stem cell, skeletal muscle, muscle injury
INTRODUCTION
In response to skeletal muscle damage, resident myogenic progenitors undergo activation to form a pool of proliferating myoblasts. These mononuclear myoblasts differentiate and fuse, forming multinucleated myocytes, which repair or replace the damaged tissue [1–3]. This programmed series of events is essential to maintaining tissue homeostasis during exercise and aging, and to ensuring recovery from muscle trauma [4]. While the balance between myoblast proliferation and differentiation is critical to muscle repair, its regulation is incompletely understood.
We previously identified Stem cell antigen-1 (Sca-1; also known as Ly-6A/E) during an expression screen to identify genes regulating myoblast cell cycle withdrawal during differentiation [5]. Sca-1 is a member of the Ly-6 multigene family encoding a number of highly homologous, glycosyl-phosphatidylinositol (GPI)-anchored surface membrane proteins, and is widely used as a marker of murine hematopoietic stem cells [6–8]. Beyond its role as a stem cell marker, it has been shown that overexpression of Sca-1 inhibits proliferation of CD4+ T-cells [9], as well as differentiation of hematopoietic stem cells [6, 10–12]. Sca-1−/− mice are viable, however, they exhibit immune and hematopoietic defects [6, 10–12]. Specifically, these mice demonstrate a lymphocytosis and thrombocytopenia, and isolated Sca-1−/− T-cells undergo prolonged hyperproliferation with stimulation in vitro [11]. Consistent with a role in progenitor cell maintenance, Sca-1-null animals have a reduced ability to re-populate bone marrow after serial transplantation [6, 12] and develop age-related failure of osteogenesis [10].
Sca-1 also is expressed on the surface of muscle-derived stem cells [13, 14] and myogenic precursors recruited to sites of skeletal or cardiac muscle injury [13, 15–18]. We previously reported that inhibition of Sca-1 expression by antisense or Sca-1 interference with blocking antibodies stimulated myoblast proliferation and delayed myoblast fusion in vitro [19]. Subsequently, others have observed sustained proliferation in Sca-1−/− myoblasts cultured ex vivo [20], but a specific regulatory role for Sca-1 during skeletal myogenesis in vivo has not been described.
We now demonstrate that Sca-1 functions as a regulator of myogenic repair in vivo through its control of myoblast proliferation. Using a myonecrotic injury model in Sca-1−/− and Sca-1+/+ mice, we show for the first time that Sca-1 regulates the tempo of muscle repair by controlling the balance between proliferation and differentiation of activated myoblasts.
MATERIALS AND METHODS
Animals
All animal procedures were approved by the Institutional Animal Care and Use Committee at the University of California, San Francisco. Mice heterozygous at the Sca-1 locus were graciously provided by Patrick Flood (University of North Carolina) [11], and backcrossed to BALB/c strain for eight generations. Sca-1+/− littermates were bred to homozygosity. Genotypes were confirmed for all experimental animals by Southern blot analysis, as previously described [11]. All experiments were performed on 12–18 week-old mice unless otherwise noted, and in male and female animals as indicated. Gender-matched, wild type (Sca-1+/+) BALB/c littermates from heterozygous matings were used as controls in all experiments.
Skeletal muscle injury and tissue harvest
Myonecrotic injury was induced in isoflurane-anesthetized female mice by injecting 100μl 10μM cardiotoxin (Sigma, [21]) in Ca++/Mg++-free phosphate-buffered saline (PBS) into the left tibialis anterior (TA) muscle using a 27-gauge needle [22]. The right leg was used as an uninjured control. TA muscles were dissected for histopathology or single cell isolation at indicated times. For tissue sections, muscle was cut transversely and snap frozen in fresh N2(l)-cooled isopentane. Serial 8μm transverse sections were cut and stored at -80°C. Sections were stained with hematoxylin and eosin (H&E) to define tissue architecture. For growth curves, uninjured Sca-1+/+ and Sca-1−/− littermates were anesthetized and total body weight, wet TA muscle weight and tibial length were measured from 4 weeks of age through adulthood (35 weeks of age).
Myofiber cross sectional area
Cross sectional area (CSA) measurements were made on H&E-stained sections of injured and control TA muscles. For each TA muscle, four to six random fields from the region of injury (Region 1) were captured at 40X magnification with a phase contrast Eclipse E600 microscope (Nikon) and SPOT digital camera (Diagnostic Instruments). Region 1 (R1) corresponded to the injured area where >90% of fibers had central nuclei (regenerating fibers). CSA was calculated for ≥125 myofibers per animal (≥500 myofibers/region), using NIH ImageJ 1.34 software [23].
Isolation of primary myoblasts
To obtain single cell suspensions of muscle cells, TA muscles were dissected, minced, and enzymatically digested as previously described [19]. Briefly, tissue was minced, washed in cold, sterile phosphate-buffered saline (PBS), and digested with 1.5 U/ml collagenase D (Sigma), 2.4 U/ml dispase II (Sigma) with 2.5 mM CaCl2 at 37°C. Tissue slurries were suspended in cold Ham’s F-10 containing 20% FBS (Omega Scientific), centrifuged at 350xg for 15 minutes, resuspended in cold PBS, serially filtered through a 200um, 100um, and 40 μm nylon mesh, centrifuged, and aliquoted for subsequent analyses.
To measure cell numbers, TA muscles were enzymatically dispersed as described and single cell suspensions were fixed with 1% paraformaldehyde. Cells were washed with PBS and nuclei stained with 10μg/ml propidium iodide (PI). Nucleated cells were counted manually using a Nikon Eclipse TE 300 fluorescence microscope. The percentage of α7+ nucleated cells recovered was used to calculate the number of α7+ cells per gram of TA muscle.
Flow cytometric analysis and FACS
For multivariate flow cytometric analyses, freshly isolated single cell suspensions were stained live with monoclonal rat anti-α7-integrin antibody (clone CY8; gift of R. Kramer, UCSF [24, 25]) at 1:3000 and phycoerythrin (PE)-conjugated donkey anti-rat F(ab’)2 (Jackson ImmunoResearch). Stained cells were then fixed with 1% paraformaldehyde or 25% ethanol containing 25mM MgCl2 (for Ki67 staining and DNA kinetics) at 4°C. After fixation, cells were incubated with additional primary antibodies in 100μl PBS with 2% calf serum, 1% donkey serum, 0.05% Triton X-100, 2μg/ml DNAse-free RNAse A (Sigma), washed and incubated in 100μl PBS with 2% calf serum containing secondary antibody. Prior to flow cytometry, cells were stained with 35 μg/ml PI or 0.4 μg/ml 7-Amino-actinomycin D (7-AAD; BD Pharmingen) to detect DNA. Subsequent analyses of cell size, DNA content, and expression of proliferation and/or myogenic proteins in myogenic cells were accomplished by gating on nucleated α7+ cells. Forward angle light scatter plots were used to measure relative cell size [26]. Additional primary antibodies used were monoclonal mouse anti-desmin (DAKO) at 1:400, monoclonal mouse anti-myosin at 1:100 (MF20; Developmental Studies Hybridoma Bank), fluorescein isothyocyanate (FITC)-conjugated monoclonal rat anti-Sca-1 (clone E13-161.7; BD Pharmingen) at 1:200, biotin-conjugated monoclonal rat anti-CD45 (BD Pharmingen) at 1:60, monoclonal mouse anti-M-cadherin (BD Pharmingen) at 1:30, and monoclonal mouse anti-Ki67 at 1:30 (BD Pharmingen). For analysis with non-conjugated primary antibodies, FITC- or APC-conjugated streptavidin (BD Pharmingen) at 1:1000, FITC- or PE-conjugated donkey anti-rat F(ab’)2 fragment at 1:200, and FITC- or APC-conjugated donkey anti-mouse F(ab’)2 fragment (Jackson Immuno Research) at 1:200 were used as secondary antibodies. Data were collected using a Becton Dickinson FACSCalibur with 488nm argon-ion laser or a Becton Dickinson LSR II with 488nm and 633nm argon-ion lasers and standard filter sets. FITC, PE and APC signals were collected for ≥10,000 cells gated for DNA content (PI or 7-AAD). In all experiments, the positive gates were determined by analyzing cells stained with isotype-matched IgG control antibodies. DNA area versus width plots confirmed that our gating strategy included all cell populations ranging from mononuclear cells with 2N DNA content [27] to bi- or tri-nucleated myocytes containing ≤ 6N DNA content. Data were analyzed using FlowJo V7.2-8.33 (Tree Star, Inc.) on a Macintosh platform.
For fluorescence-activated cell sorting, freshly isolated single cell suspensions were stained live for α7-integrin antibody as described above. All centrifugations were performed at 350xg at 4°C. Cells were filtered through 40μm mesh prior to sorting, and stained with PI at 1μg/ml for live/dead cell discrimination. Live cells were sorted on the α7-integrin PE signal using the 488-nm laser on a standard configuration FACSAria (BD Laboratories) with DIVA software (BD Laboratories). At least 10,000 α7+ events were collected for RNA isolation or evaluation of apoptosis.
DNA Kinetics, Multinucleation and Apoptosis
To quantitate DNA content in asynchronously dividing populations of α7+ cells, single cell suspensions were stained live for α7-integrin, fixed with ethanol, then stained overnight with PI at 35μg/ml containing RNase. Cell cycle kinetics and multinucleation (DNA content=2N, 4N, 6N) were evaluated on ≥10,000 α7+ events using FlowJo 8.33 (Dean-Jett-Fox algorithm) or ModFit LT3.0 (Verity House Software).
To detect cells undergoing apoptosis, single cell suspensions were stained live with anti-α7-integrin antibody, Alexa Fluor 647-conjugated Annexin V (Molecular Probes) per the manufacture’s protocol, and PI for live/dead discrimination. At least 10,000 nucleated events were analyzed. Analysis of α7+, mononuclear cells for Annexin V staining was accomplished using FlowJo 8.3.3 on a Macintosh platform.
Quantitative real-time PCR
RNA was extracted from ≥5,000 freshly isolated α7+ cells using the PicoPure RNA Isolation Kit (Arcturus/Molecular Devices) according to the manufacturer's directions. cDNA was synthesized from total RNA using SuperScript III (Invitrogen) with 50μM oligo(dT) primers and quantitated using a Nanodrop ND-1000 Spectrophotometer (Nanodrop Technologies, ND Software version 3.3.0). Linear pre-amplification of target sequences was accomplished using the Applied Biosystems PreAmp system. Relative expression was determined by quantitative real-time PCR (qPCR) using the TaqMan Assay (Applied Biosystems) on an ABI Prism 7700 with the following primer pairs (ABI): Myf5 (Mm00435125_m1), MyoD (Mm00440387_m1), Myogenin (Mm00446195_g1), Desmin (Mm00802455_m1), myosin (Mm00454991_m1), and GAPDH (4352339E). Cycle times to detection were normalized against GAPDH controls, and relative changes were calculated using Excel (Microsoft) on a Macintosh platform.
Statistics
Chi square analysis was used to assess the significance of differences between frequency distributions of myofiber CSA. Likelihood ratios within sample groups were first analyzed for significant variation between animals within groups. In all cases, there was no significant variation within groups. Animals within groups were then pooled, and pooled frequency distributions were compared and analyzed for significance by Chi square analysis. Other results are presented as mean ± standard deviation. Differences between two groups were tested for significance by unpaired t-test, and for three or more groups by one-way analysis of variance, followed by Bonferroni’s post-test to isolate specific differences. A value of p <0.05 was considered significant. All analyses were performed using either JMP IN 5 (Thomson) or Prism 4 (GraphPad) software for Macintosh.
RESULTS
Sca-1−/− skeletal muscle exhibits delayed repair after muscle injury
To determine whether Sca-1 regulates muscle repair in vivo, TA muscles in Sca-1+/+ and Sca-1−/− female mice were injured by cardiotoxin injection. This model has been demonstrated to injure only mature myofibers and spare resident myogenic stem cells and other supporting cells [28]. We harvested muscle at days 3, 7 and 25 following injection, and analyzed tissue sections from both injured muscle and uninjured muscle obtained from the contralateral limb. By day 3 following injury, Sca-1+/+ and Sca-1−/− mice developed a mononuclear cell infiltrate and concomitant necrosis of myofibers in the injured area (Region 1, R1; Fig. 1A). While the mononuclear infiltrate in Sca-1−/− mice appeared qualitatively increased, consistent with the hyperinflammatory response originally observed in Sca-1−/− immune cells by others [11], this was not statistically significant (data not shown). By day 7 following injury, the injured area (R1) in both Sca-1+/+ and Sca-1−/− TA muscle was replaced with regenerating fibers distinguished by their smaller size and central nuclei (Fig. 1A). To quantitate the repair process, we measured cross-sectional area (CSA) of regenerating fibers in the R1 region of Sca-1+/+ and Sca-1−/− muscles [29]. Notably, the CSA of Sca-1−/− regenerating fibers in the R1 region at day 7 was 26% smaller than Sca-1+/+ regenerating fibers (Fig. 1B; C2=23.3; DF 6; p=0.006). By day 14, there was a slight increase in the number of mononuclear myoblasts with centrally located nuclei in the Sca-1−/− animals, but this difference did not reach statistical significance (data not shown). By day 25, the regenerating fibers in the R1 region from Sca-1+/+ and Sca-1−/− animals demonstrated equivalent CSA distributions (Fig. 1A,B; C2=7.2; DF 6; p=0.3) and the mononuclear cells had completely cleared. No replacement fibrosis was observed at day 25 after injury in either group. Although subtle, these findings suggested that Sca-1 affects the rate of muscle repair following injury.
Fig. 1. Sca-1−/− skeletal muscle exhibits delayed repair after myonecrotic injury.

(A) Sample H&E-stained cross-sections of Sca-1+/+ TA muscles from adult female mice before (Uninjured) and 3, 7 and 25 days after cardiotoxin-induced myonecrotic injury. Bars, 100μm. R1, injured area. Myoblast proliferation, inflammation and myofiber necrosis peak by 3 days, as evidenced by large numbers of mononuclear cells and disappearance of skeletal myofibers in R1. Myofibers with >90% centrally located nuclei represent the new regenerating fibers forming in R1 at 7 days and persisting through 25 days. Myofibers with >90% peripherally located nuclei are seen in the adjacent uninjured area at all time points. (B) CSA frequency histograms comprised of 200–400 fibers from Sca-1+/+ (solid line) and Sca-1−/− (dashed line) mice at indicated times following injury. Regenerating Sca-1−/− fibers within the injured area (R1) were significantly smaller than Sca-1+/+ fibers 7 days after injury (Region 1 (D7)), although these appeared to have recovered fully by 25 days (Region 1 (D25)). *, p<0.01.
Sca-1−/− myogenic cells demonstrate a hyperproliferative response following injury
While we observed a measurable delay in myofiber growth after injury in Sca-1−/− animals, this was more modest than anticipated. However, the most striking finding was an increase in the number of mononuclear cells seen in the injured muscle of these mice. Our previous work suggested that Sca-1 regulates myoblast proliferation in vitro [19]. To investigate this as the underlying mechanism for a delay in muscle repair, we analyzed the in vivo myogenic compartment after injury for evidence of increased cell proliferation.
Identification of a pan-myogenic compartment in vivo
To analyze the myogenic compartment, we used α7-integrin to sort and subsequently analyze Sca-1+/+ and Sca-1−/− myogenic cells. α7-integrin is expressed on myogenic intermediates from satellite cells to myocytes in vivo [24, 30, 31], and has been used to isolate and study human myoblast progenitors [24, 25] and primary skeletal myoblasts from neonatal and adult mice [19, 32, 33]. In addition, others recently have confirmed that there is significant overlap between α7-integrin expression and the c-Met+M-cadherin+ myogenic compartment [25], as well as both Pax7+/Myf5+ and Pax7+/Myf5− satellite cells [31]. Thus, α7-integrin serves as a cell surface marker representing the myogenic compartment in Sca-1+/+ and Sca-1−/− animals after muscle injury. To validate this in our experimental model, we analyzed α7-integrin+ cells isolated from Sca-1+/+ TA muscles 0, 1, 3, and 5 days following injury. Activated α7-integrin+ myoblasts increased in cell size and DNA content, presumably as a function of early fusion events, and demonstrated induction of M-cadherin and desmin expression when compared to uninjured controls at day 3 (Fig. 2). These findings supported the in vivo myogenic potential of this population.
Fig. 2. Myogenic activation of the α7-integrin+ population.

Flow cytometric analysis of the α7-integrin+ compartment from TA muscle 3 days after myonecrotic injury demonstrates an increase in cell size (upper left) and DNA content (upper right), as a function of cell cycle entry and multinucleation, and expression of desmin (lower left) and M-cadherin (lower right), compared to uninjured muscle (n=3). Typical results shown. FALS, forward angle light scatter, PI, propidum iodide.
Sca-1 expression is downregulated in the myogenic compartment during muscle repair in vivo
We previously had shown that temporally regulated Sca-1 expression is necessary for normal myogenic differentiation in vitro [19]. To establish the temporal pattern of Sca-1 expression within the α7+ myogenic compartment in vivo, we harvested TA muscles from Sca-1+/+ animals after 0, 2 and 5 days following injury and examined the α7+ myogenic compartment by flow cytometric analysis. We determined that Sca-1 expression was temporally downregulated on α7+ myoblasts during in vivo differentiation (Fig. 3), with the ratio of Sca-1+α7+ to total α7+ cells falling over a 5 day period (day 0: 60±6.5%; day 2: 44±9.5%; day 5: 12±3.4%, p<0.05). We also have shown that there is little overlap between expression of Sca-1 and desmin or myosin within the α7+ compartment during differentiation after injury or in cultured C2C12 skeletal myoblasts (Fig. S1). These results suggest a pattern of Sca-1 expression similar to that observed in vitro, where Sca-1 is expressed on quiescent precursor and proliferative myoblasts and lost as cells differentiate into myocytes [19], further supporting a role for Sca-1 during the proliferative phase of myoblast activation.
Fig. 3. Sca-1 expression is downregulated during myogenic differentiation in vivo.

Multivariate flow cytometric analysis of the α7-integrin+ compartment for Sca-1 expression in TA muscle from Sca-1+/+ mice shows that by 5 days following injury, the percentage of Sca-1+α7+ myogenic cells has significantly decreased (n=3). *, p<0.05; ¶, p<0.01. Data shown represent mean ± SD.
Increased myogenic cell numbers in Sca-1−/− mice following injury
We initially observed an increase in mononuclear cells in injured muscle from Sca-1−/− mice compared to their wild-type counterparts (data not shown). To determine the contribution of the α7+ myogenic compartment to this mononuclear cell expansion, we quantitated the number of α7+ cells recovered from uninjured and injured TA muscles. At baseline, Sca-1+/+ and Sca-1−/− animals had the same number of α7+ cells (Fig. 4A). At 72 hours after cardiotoxin injury, both Sca-1+/+ and Sca-1−/− animals developed a significant increase in the number of α7+ cells (Fig. 4A), consistent with activation and proliferation of the myogenic compartment. However, this increase in α7+ cells was much greater in Sca-1−/− muscle relative to Sca-1+/+, (4.5- versus 2.3-fold, p<0.05). We also determined that the increased myogenic cell numbers in Sca-1−/− injured muscle was not due to an increase in inflammatory cells, since there was no appreciable increase in the number of α7+ cells co-expressing the panhematogenous marker, CD45, in response to injury (Fig. 4B).
Fig. 4. Activated Sca-1−/− myoblasts exhibit a hyperproliferative response.

(A) Quantitation of α7-integrin+ cells obtained from Sca-1+/+ and Sca-1−/− TA muscle before and 72 hours after injury. Before injury, there is no difference between groups. Following injury, both Sca-1+/+ and Sca-1−/− muscle demonstrate an increase in the number of α7+ cells, with a significantly greater increase observed in Sca-1−/− compared to Sca-1+/+ muscle (n=3). *, p<0.05. Data shown represent mean ± SD. (B) Flow cytometry demonstrates no significant increase in the CD45+ inflammatory cell population within the α7+ myogenic compartment (n=3). Typical results shown. (C) Cell numbers counted in actively dividing cultures at indicated timepoints demonstrate accelerated division of α7+ cells from Sca-1−/− injured muscle (n=2). Data shown represent mean ± SD. (D) Bivariate flow cytometric analysis of α7+ cells from Sca-1+/+ uninjured muscle and Sca-1+/+ and Sca-1−/− muscle 48 hours after injury. The percentage of Ki67+α7+ cycling myoblasts increases following injury, with significantly more Ki67+α7+ myoblasts observed in Sca-1−/− muscle (n=3). Typical results shown. (E) Quantitative analysis of data presented in (C). *, p< 0.001; ¶, p < 0.01. Data shown represent mean ± SD.
Increased myogenic cell proliferation in Sca-1−/− mice following injury
To test whether the increase in myogenic cell numbers in injured Sca-1−/− muscle was due to accelerated proliferation, we monitored α7+ cell numbers isolated from Sca-1−/− and Sca-1+/+ muscle cultured ex vivo following injury. The α7+ cells isolated from Sca-1−/− muscle divided at an accelerated rate compared to α7+ Sca-1+/+ cells (Fig. 4C). We also measured expression of Ki67, a marker of actively proliferating cells [34, 35], against DNA content (Fig. 4D). The fraction of α7+Ki67+ myogenic cells at 48 hours after injury in Sca-1−/− muscle increased 18.8-fold relative to uninjured muscle, compared to an increase of only 8.3-fold in Sca-1+/+ muscle (p<0.01) (Fig. 4E). These data suggested that Sca-1−/− myoblasts proliferate faster in response to injury compared to Sca-1+/+ myoblasts.
Altered DNA kinetics of activated Sca-1−/− myoblasts
The accelerated proliferation rate of α7+ Sca-1−/− cells suggested a decrease in cell cycle length. To determine the specific impact of Sca-1 expression on DNA kinetics of activated myoblasts, we examined DNA content in α7+ cells isolated from TA muscles harvested from Sca-1+/+ and Sca-1−/− mice at 0, 1, 3, and 5 days following injury (Fig. 5A,B). At Day 0 (uninjured controls), the α7+ myogenic cells from Sca-1+/+ and Sca-1−/− animals displayed DNA histograms consistent with quiescence, with almost all cells showing 2N DNA content (Fig. 5A, top). Following injury, DNA histograms of α7+ cells demonstrated cell cycle entry, with increasing numbers of cells with >2N DNA content (S and G2/M; Fig. 5A, bottom). By day 3, however, there were fewer α7+ cells from Sca-1−/− mice observed to be in S-phase (Sca-1+/+: 35%±3.8%; Sca-1−/−: 20%±3.7%, p<0.05) compared to Sca-1+/+ controls (Fig. 5B, middle), whereas the number of cells in G2/M was not significantly changed suggesting that the decrease in S-phase cell number was not due to cell cycle exit.
Fig. 5. Sca-1 affects cell cycle transit rate.

(A-B) Flow cytometric analysis of DNA content. (A) DNA histograms of α7+ myoblasts before (Day 0) and 3 days after injury demonstrate a quiescent myogenic population prior to injury in both Sca-1+/+ and Sca-1−/− TA muscle (upper). With injury, α7+ myoblasts enter the cell cycle, as evidenced by cells with >2N DNA content (lower) (n=5). Typical results shown. * indicates significant difference in S-phase observed between Sca-1+/+ and Sca-1−/− muscle sampled at day 3, which is further evaluated in (B) and (C). (B) DNA content analysis of asynchronous populations of α7+ myoblasts isolated from Sca-1+/+ and Sca-1−/− TA muscles 1, 3, and 5 days following injury demonstrates that fewer cells are observed in S-phase at day 3 in Sca-1−/− muscle (n=5). *, p<0.05. Data shown represent mean ± SD. (C) Annexin V staining of cells analyzed in (B) demonstrates that the difference in the number of S-phase cells is not due to a difference in cellular apoptosis in Sca-1−/− muscle (n=3). Data shown represent mean ± SD.
In an asynchronously dividing cell population, fewer cells in a given phase of the cell cycle can be interpreted as either more rapid transit through that phase, or excess cell death during that phase. To determine if the observed difference in cell number in S-phase was due to asymmetric cell loss by apoptotic cell death, we measured expression of Annexin V, a marker for apoptotic cells [36], within the α7+ compartment 1, 3, and 5 days after injury (Fig. 5C). We observed no significant difference in apoptosis between Sca-1+/+ and Sca-1−/− myoblasts (day 1: 12.5±7.9% versus 12.6±10.8%; day 3: 21.6±19% versus 24.3±21.6%; day 5: 27.3±18% versus 25.7±18.8%, respectively). Taken together, these data suggest a likely explanation that Sca-1−/− α7+ myoblasts cycle more rapidly because of shorter S-phase transit times.
Sca-1−/− myoblasts demonstrate delayed cellular differentiation in vivo
We next assessed the impact of more rapid, sustained myoblast proliferation in Sca-1−/− animals following injury on myoblast differentiation. We analyzed expression of myogenic regulatory factors [37] from sorted α7+ myoblasts at 0, 2, 3, and 5 days following injury by qPCR. We observed that Sca-1−/− myoblasts demonstrated appropriate evidence of early myogenesis, as assessed by expression of Myf5, yet displayed a significant delay in the onset of MyoD and myogenin expression compared to Sca-1+/+ myoblasts (Fig. 6A). These results suggested that in the absence of Sca-1 expression, the robust hyperproliferation stimulated by injury delayed the normal pattern of cellular differentiation in the α7+ myogenic compartment in vivo. Furthermore, qPCR analysis from Sca-1−/− myoblasts showed delayed expression of both desmin and myosin, later markers of myogenic differentiation, presumably a manifestation of the downstream effects of delayed MyoD and myogenin induction.
Fig. 6. Sca-1−/− myoblasts exhibit delayed myogenic differentiation.
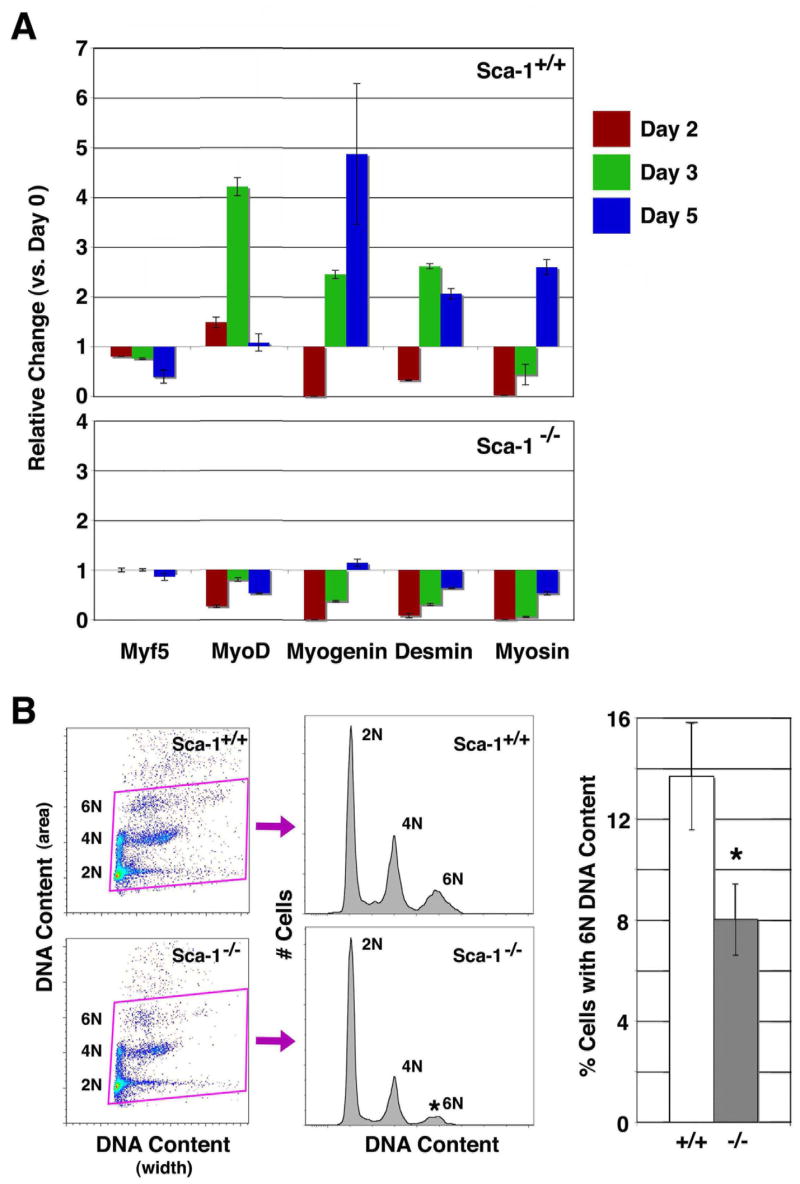
(A) Relative expression time course for myogenic transcripts analyzed by qPCR. Sca-1+/+ cells demonstrate appropriate induction of Myf5, MyoD, Myogenin, desmin, and myosin expression at days 2 through 5 following injury, consistent with reparative myogenesis. Sca-1−/− myoblasts show delayed expression of MyoD, Myogenin, desmin and myosin at 3 and 5 days following injury, while expression of the earliest myoblast marker, Myf5, persisted. Data shown represent mean ± SD (n=5). (B) Flow cytometric analysis of early multinucleation events by DNA content. α7+ cells from Sca-1+/+ (upper) and Sca-1−/− (lower) muscle were analyzed 3 days following injury. α7+ Sca-1−/− myoblasts demonstrated significantly fewer 6N events 3 days after injury compared to α7+ cells from Sca-1+/+ muscle, suggesting a delay in early fusion events (n=5). *, p<0.05. Data shown represent mean ± SD.
Since the expression profiles demonstrated delayed expression of desmin and myosin, we wanted to test whether this delay affected early fusion events in Sca-1−/− myoblasts. We therefore evaluated DNA content in these cells in order to assess the pool of cells with >2 nuclei (6N DNA content) (Fig. 6B). Differentiating myoblasts fuse to generate multinucleated myocytes, and those with 6N DNA content represent the first identifiable fusion events within a heterogenous pool of mononuclear and multinuclear cells. α7+ cells from Sca-1−/− TA muscles harvested 3 days after injury demonstrated significantly fewer cells with 6N DNA content, compared to Sca-1+/+ cells (8±1.4% versus 13.7±2.3%, p<0.05), suggesting a delay in early fusion events (Fig. 6B). These findings are consistent with our previous work that demonstrated attenuated fusion in vitro in Sca-1 deficient myoblasts [19].
Thus, we have demonstrated for the first time that skeletal muscle injury in Sca-1−/− animals produces myoblast hyperproliferation and a delay in myogenic differentiation when activated by injury. These effects of Sca-1 on myoblast proliferation in vivo recapitulate observations made in vitro and lend firm support to our hypothesis that Sca-1 regulates myoblast proliferation in vivo, ultimately impacting the tempo of myogenic repair in response to injury.
DISCUSSION
Skeletal muscle retains the ability to regenerate following injury by the expansion and differentiation of resident myogenic precursor cells. Our studies demonstrate that Sca-1 deletion in vivo results in a hyperproliferative state that resists differentiation, consistent with previous in vitro observations made by us and subsequently by others [19, 20]. This disturbance in the balance between myoblast proliferation and differentiation contributes to a subtle delay in muscle regeneration after myonecrotic injury. The current studies constitute the first report of hyperproliferation and delayed differentiation in Sca-1−/− myoblasts in vivo, and support the hypothesis that Sca-1 functions as a regulator of muscle regeneration in vivo through its direct effect on myoblast proliferation and secondary effect on differentiation. We therefore propose a model whereby Sca-1, through its expression on myogenic progenitors and proliferating myoblasts, and downregulated coincident with differentiation into myocytes, controls the balance between proliferation and differentiation during myogenic repair (Fig. 7). This model explains why the absence of Sca-1 results in an imbalance between these two processes, with increased cellular proliferation and delayed myogenic differentiation ultimately resulting in the delayed regeneration observed in Sca-1−/− myofibers following injury.
Fig. 7. Model for Sca-1 function during muscle regeneration.
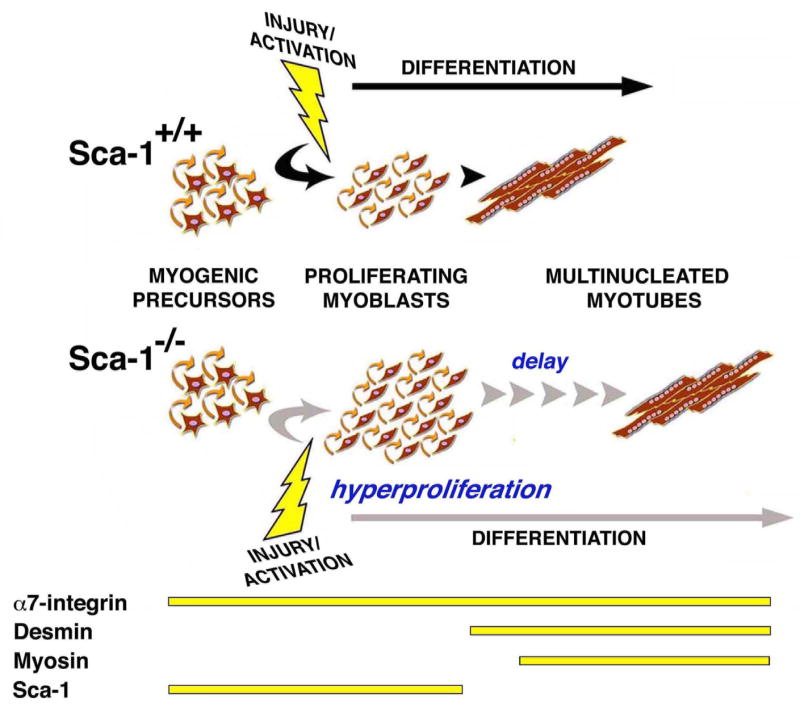
From these studies, we propose that Sca-1 is expressed during myogenic precursor activation and myoblast proliferation, and that its appropriately timed down regulation is necessary to allow cell cycle withdrawal and myogenic differentiation. In the absence of Sca-1, persistent proliferation occurs, delaying myogenic differentiation and muscle repair.
Interestingly, Sca-1 appears to have little impact during primary myogenesis. Sca-1−/− mice are viable and breed normally [11, 12]. They appear to have normal levels of physical activity, and histological analysis suggests that Sca-1 is not necessary for myogenic determination and myofiber formation during embryonic development (Fig. S2). We observed after weaning that body and muscle weight gain, tibial length, and myofiber CSA between Sca-1+/+ and Sca-1−/− mice were comparable (Fig. S2). We followed growth curves of Sca-1−/− mice until 35 weeks of age and found no difference when controlled for gender. In addition, we have not observed increased fibrosis or histologic abnormalities in Sca-1−/− muscle with age (data not shown). Furthermore, the numbers of α7-integrin+ resident myogenic cells were unaffected by Sca-1 deletion (Fig. 4A) which suggests that Sca-1 is not required for the initial specification and establishment of myogenic progenitors.
The proposed role of Sca-1 in regulating precursor cell proliferation versus differentiation, as illustrated by the response to muscle injury in Sca-1−/− animals, is supported by parallel observations obtained after serial bone marrow transplantation [6, 12], where Sca-1−/− bone marrow failed to repopulate irradiated mice. These authors suggested that the absence of Sca-1 affected the balance between hematopoietic stem cell proliferation and self-renewal. Similarly, Sca-1−/− mice develop age-related osteoporosis [10], indicating that Sca-1 may regulate proliferation versus differentiation of mesenchymal stem cells. These findings in muscle, bone marrow, and bone support a role for Sca-1 in regulating tissue progenitor cell function rather than in initial cell and tissue development [38]. They also are consistent with an overall model where Sca-1 expression is pivotal for determining the balance between proliferation, differentiation, and self-renewal in a variety of tissues [6, 10, 12]. While a focal injury model (i.e., cardiotoxin injection) is unlikely to elicit exhaustion of the myogenic progenitor compartment through diminished self-renewal, studies combining the Sca-1−/− background with advanced age or crossing with a mouse strain that undergoes chronic muscle injury, e.g., the mdx mouse [39], should be able to test this hypothesis.
Recently published studies suggested age-dependent alterations in primary myogenesis in Sca-1-null mice [20], however, we observed no difference in body and muscle weight, tibial length, or myofiber CSA between Sca-1−/− and Sca-1+/+ animals evaluated from 4 through 35 weeks of age (Fig. S2). It is possible that those observations reported by others were made in animals that were significantly older, or of mixed gender compared to the cohort we have studied. Gender itself can contribute significantly to skeletal muscle regenerative capacity [40]. In addition, those mice were from a different genetic background (C57BL/6), and it is well-established that Sca-1 haplotype expression varies by strain [41–45]. More important, however, is the consistent conclusion drawn from both studies regarding a regulatory role for Sca-1 during myoblast proliferation. Specifically, in vitro data previously reported by us and others [19, 20] overlap well with our current in vivo observations, lending significant validity to the model of Sca-1 as a regulator of myoblast proliferation during myogenic repair.
It is worth noting that while we observed an initial cell cycle acceleration of proliferating α7+ myoblasts, this was a transient phenomenon and eventually lead to appropriate cell cycle withdrawal and differentiation, although this was delayed. The regulatory mechanisms that eventually slow cell division and allow for myoblast differentiation in the absence of Sca-1 are not known. The observation that these cells continue to proliferate ex vivo, where they are not subject to other signals from the tissue milieu, only serves to reinforce a hypothesis that while the absence of Sca-1 disinhibits myoblast proliferation in response to injury in vivo, this most likely represents a higher threshold for initiating cell cycle withdrawal and differentiation.
For this study, we did not distinguish between myogenic precursors on the basis of anatomical location traditionally used to identify satellite cells. Instead, our α7-integrin-based strategy pooled a heterogeneous population of myogenic precursors that become M-cadherin+desmin+ with activation (Fig. 2), and should include both satellite cells as well as interstitial cells with myogenic potential, while excluding hematogenous cells present in adult muscle (Fig. 4B) [2, 46–48]. While the myogenic potential of the α7+ compartment has been well-documented [24, 25, 30, 32, 33], the extrapolation of these results to other myogenic progenitor pools characterized by more restrictive criteria is cautioned.
While we observed equivalent size distributions among regenerating fibers in Sca-1+/+ and Sca-1−/− animals by day 25, we also noticed an increase in the frequency of larger myofibers (≥2000 μm2) in the area immediately adjacent to the previously injured region in Sca-1−/− versus Sca-1+/+ muscle (Fig. S3). This could indicate either an exaggerated compensatory hypertrophy adjacent to the site of injury due to a qualitative difference in regenerating Sca-1−/− muscle, but also might be explained by extension of the expanded Sca-1−/− myoblast pool into the surrounding muscle. The latter seems more likely, since no qualitative defect in muscle function (e.g., ambulation, food seeking behavior, exercise) was observed in the recovered Sca-1−/− mice.
The molecular footprints of progenitor cell activation, myoblast proliferation, and differentiation into myocytes have previously been characterized [49–52]. We followed these transcriptional changes in the myogenic population over time. Our results suggest that Sca-1−/− myoblasts experience an early differentiation delay, specifically affecting MyoD, myogenin, desmin and myosin expression. Interestingly, the expression of Myf5, one of the earliest markers of myogenic commitment, persisted. This is consistent with our previous in vitro observation that skeletal myoblasts treated with Sca-1 antisense or blocking antibodies undergo differentiation arrest after the expression of Myf5 [19]. With the delay in expression of desmin, a mature myoblast marker, and in myosin, which heralds differentiation into myocytes, we also uncovered a subtle delay in early fusion. These observations not only provide insight into the molecular events occurring in the absence of Sca-1, but strongly support that Sca-1−/− myoblasts proliferate at the expense of progression along the differentiation pathway. Previously, we ascribed to Sca-1 a specific role in myoblast fusion in vitro [19]. However, with these new insights from in vivo study, we now conclude that the effect of Sca-1 interference on myoblast differentiation and fusion we had observed in vitro was likely the consequence of its direct effect on myoblast proliferation. This explanation similarly is supported by studies from other investigators [20].
Thus, based on previous studies in vitro [19, 20] and our current in vivo observations reported here, we revise our model to propose that Sca-1 controls the tempo of myogenic repair in vivo, and that its appropriately regulated expression controls myoblast cell cycle withdrawal during differentiation in response to injury. More generally, these observations emphasize the importance of balancing progenitor proliferation and differentiation during tissue repair. A through understanding of the mechanisms guiding these cellular decisions, as well as those governing progenitor activation and self-renewal, remain critical to developing strategies for targeted tissue regeneration.
Supplementary Material
Flow cytometric analysis of Sca-1 co-expression with desmin and myosin in α7-integrin+ cells isolated from tibialis anterior muscle 72hrs following injury (upper), and in cultured C2C12 skeletal myoblasts grown in differentiation medium for 48hrs (lower) [5]. During early myoblast activation following injury in vivo, there is little overlap in expression between desmin (upper left) or myosin (upper right) and Sca-1. Similarly, in differentiating C2C12 myoblasts there is little overlap between Sca-1 and myosin expression (lower). These data suggest that Sca-1 expression is lost in vivo and in vitro as proliferating myoblasts differentiate toward myocytes expressing desmin and myosin.
(A and B) Tibial length, total body weights and wet TA muscle weights of female (A) and male (B) mice were plotted against the postnatal age of individual Sca-1+/+ (black triangle) and Sca-1−/− (green square) animals. There was no significant difference in growth parameters between Sca-1+/+ and Sca-1−/− mice, regardless of gender, from weaning (3–5 wks) through adulthood (35–40 wks). (C and D) TA muscle from adult Sca-1+/+ and Sca-1−/− mice were stained with H&E. (C) No differences were seen between histopathology of Sca-1−/− and Sca-1+/+ TA muscle. Representative cross-sections are shown. Bars, 100μm. (D) Histograms depict 400–700 fiber CSAs from Sca-1−/− (dashed line) and Sca- 1+/+ (solid line) TA muscles. No significant difference was noted between the CSAs of Sca-1 −/− and Sca-1+/+ mice for either gender.
(A) Sample H&E-stained cross-sections of Sca-1+/+ TA muscles from adult female mice 7 and 25 days after cardiotoxin-induced myonecrotic injury. Bars, 100μm. R1, injured area; R2, adjacent uninjured area. (B) CSA frequency histograms comprised of 200–400 fibers from Sca-1+/+ (solid line) and Sca-1−/− (dashed line) mice at 7 and 25 days following injury. Adjacent uninjured Sca-1−/− fibers (R2) were not significantly different from Sca-1+/+ fibers 7 days after injury (Region 2 (D7)), however, there was a greater frequency of larger Sca-1−/− fibers (>2000μm2) 25 days after injury compared to Sca-1+/+ fibers (Region 2 (D25)). *, C2=72.4; DF 6; p<0.0001.
Acknowledgments
This work was supported by Public Health Service grant HL062174 from NHLBI, an AHA Established Investigator Award, and funds from the Pollin Foundation to H.S.B. C.L.E. was supported by the AMSPDC Pediatric Scientist Development Program (Public Health Service grant HD004739) and the Pediatric Critical Care Scientist Development Program (Public Health Service grant HD047349). J.E.L. was supported by National Research Service Award HL062174 from NHLBI and a Sarnoff Foundation Scholar Award.
We thank Patrick Flood (UNC) for generously providing breeding pairs of Sca-1+/− mice, Randall Kramer (UCSF) for sharing anti-α7-integrin antibody, Margaret Mayes and Manoj Rodrigo for assistance with histopathology preparations, Julien I. E. Hoffman for advice on statistical analysis of the data, and Charles Ordahl, Louis Ptacek and Frank King for helpful discussions and critical review of this manuscript.
Footnotes
Publisher's Disclaimer: This is a PDF file of an unedited manuscript that has been accepted for publication. As a service to our customers we are providing this early version of the manuscript. The manuscript will undergo copyediting, typesetting, and review of the resulting proof before it is published in its final citable form. Please note that during the production process errors may be discovered which could affect the content, and all legal disclaimers that apply to the journal pertain.
References
- 1.Charge SB, Rudnicki MA. Cellular and molecular regulation of muscle regeneration. Physiol Rev. 2004;84:209–238. doi: 10.1152/physrev.00019.2003. [DOI] [PubMed] [Google Scholar]
- 2.Dhawan J, Rando TA. Stem cells in postnatal myogenesis: molecular mechanisms of satellite cell quiescence, activation and replenishment. Trends Cell Biol. 2005;15:666–673. doi: 10.1016/j.tcb.2005.10.007. [DOI] [PubMed] [Google Scholar]
- 3.Hawke TJ, Garry DJ. Myogenic satellite cells: physiology to molecular biology. J Appl Physiol. 2001;91:534–551. doi: 10.1152/jappl.2001.91.2.534. [DOI] [PubMed] [Google Scholar]
- 4.Seale P, Asakura A, Rudnicki MA. The potential of muscle stem cells. Developmental cell. 2001;1:333–342. doi: 10.1016/s1534-5807(01)00049-1. [DOI] [PubMed] [Google Scholar]
- 5.Shen X, Collier JM, Hlaing M, Zhang L, Delshad EH, Bristow J, Bernstein HS. Genome-wide examination of myoblast cell cycle withdrawal during differentiation. Dev Dyn. 2003;226:128–138. doi: 10.1002/dvdy.10200. [DOI] [PubMed] [Google Scholar]
- 6.Ito CY, Li CY, Bernstein A, Dick JE, Stanford WL. Hematopoietic stem cell and progenitor defects in Sca-1/Ly-6A-null mice. Blood. 2003;101:517–523. doi: 10.1182/blood-2002-06-1918. [DOI] [PubMed] [Google Scholar]
- 7.Ma X, Robin C, Ottersbach K, Dzierzak E. The Ly-6A (Sca-1) GFP transgene is expressed in all adult mouse hematopoietic stem cells. Stem Cells. 2002;20:514–521. doi: 10.1634/stemcells.20-6-514. [DOI] [PubMed] [Google Scholar]
- 8.Hanson P, Mathews V, Marrus SH, Graubert TA. Enhanced green fluorescent protein targeted to the Sca-1 (Ly-6A) locus in transgenic mice results in efficient marking of hematopoietic stem cells in vivo. Exp Hematol. 2003;31:159–167. doi: 10.1016/s0301-472x(02)01021-4. [DOI] [PubMed] [Google Scholar]
- 9.Henderson SC, Kamdar MM, Bamezai A. Ly-6A.2 expression regulates antigen-specific CD4+ T cell proliferation and cytokine production. J Immunol. 2002;168:118–126. doi: 10.4049/jimmunol.168.1.118. [DOI] [PubMed] [Google Scholar]
- 10.Bonyadi M, Waldman SD, Liu D, Aubin JE, Grynpas MD, Stanford WL. Mesenchymal progenitor self-renewal deficiency leads to age-dependent osteoporosis in Sca-1/Ly-6A null mice. Proc Natl Acad Sci U S A. 2003;100:5840–5845. doi: 10.1073/pnas.1036475100. [DOI] [PMC free article] [PubMed] [Google Scholar]
- 11.Stanford WL, Haque S, Alexander R, Liu X, Latour AM, Snodgrass HR, Koller BH, Flood PM. Altered proliferative response by T lymphocytes of Ly-6A (Sca-1) null mice. J Exp Med. 1997;186:705–717. doi: 10.1084/jem.186.5.705. [DOI] [PMC free article] [PubMed] [Google Scholar]
- 12.Bradfute SB, Graubert TA, Goodell MA. Roles of Sca-1 in hematopoietic stem/progenitor cell function. Exp Hematol. 2005;33:836–843. doi: 10.1016/j.exphem.2005.04.001. [DOI] [PubMed] [Google Scholar]
- 13.Asakura A, Seale P, Girgis-Gabardo A, Rudnicki M. Myogenic specification of side population cells in skeletal muscle. J Cell Biol. 2002;159:123–134. doi: 10.1083/jcb.200202092. [DOI] [PMC free article] [PubMed] [Google Scholar]
- 14.Jankowski RJ, Deasy BM, Cao B, Gates C, Huard J. The role of CD34 expression and cellular fusion in the regeneration capacity of myogenic progenitor cells. J Cell Sci. 2002;115:4361–4374. doi: 10.1242/jcs.00110. [DOI] [PubMed] [Google Scholar]
- 15.Jackson KA, Majka SM, Wang H, Pocius J, Hartley CJ, Majesky MW, Entman ML, Michael LH, Hirschi KK, Goodell MA. Regeneration of ischemic cardiac muscle and vascular endothelium by adult stem cells. J Clin Invest. 2001;107:1395–1402. doi: 10.1172/JCI12150. [DOI] [PMC free article] [PubMed] [Google Scholar]
- 16.Polesskaya A, Seale P, Rudnicki MA. Wnt Signaling Induces the Myogenic Specification of Resident CD45(+) Adult Stem Cells during Muscle Regeneration. Cell. 2003;113:841–852. doi: 10.1016/s0092-8674(03)00437-9. [DOI] [PubMed] [Google Scholar]
- 17.Oh H, Bradfute SB, Gallardo TD, Nakamura T, Gaussin V, Mishina Y, Pocius J, Michael LH, Behringer RR, Garry DJ, Entman ML, Schneider MD. Cardiac progenitor cells from adult myocardium: Homing, differentiation, and fusion after infarction. Proc Natl Acad Sci U S A. 2003;100:12313–12318. doi: 10.1073/pnas.2132126100. [DOI] [PMC free article] [PubMed] [Google Scholar]
- 18.Pfister O, Mouquet F, Jain M, Summer R, Helmes M, Fine A, Colucci WS, Liao R. CD31- but Not CD31+ cardiac side population cells exhibit functional cardiomyogenic differentiation. Circ Res. 2005;97:52–61. doi: 10.1161/01.RES.0000173297.53793.fa. [DOI] [PubMed] [Google Scholar]
- 19.Epting CL, Lopez JE, Shen X, Liu L, Bristow J, Bernstein HS. Stem cell antigen-1 is necessary for cell-cycle withdrawal and myoblast differentiation in C2C12 cells. J Cell Sci. 2004;117:6185–6195. doi: 10.1242/jcs.01548. [DOI] [PubMed] [Google Scholar]
- 20.Mitchell PO, Mills T, O'Connor RS, Kline ER, Graubert T, Dzierzak E, Pavlath GK. Sca-1 negatively regulates proliferation and differentiation of muscle cells. Dev Biol. 2005;283:240–252. doi: 10.1016/j.ydbio.2005.04.016. [DOI] [PubMed] [Google Scholar]
- 21.Goetsch SC, Martin CM, Embree LJ, Garry DJ. Myogenic progenitor cells express filamin C in developing and regenerating skeletal muscle. Stem Cells Dev. 2005;14:181–187. doi: 10.1089/scd.2005.14.181. [DOI] [PubMed] [Google Scholar]
- 22.Ishii A, Lo SH. A role of tensin in skeletal-muscle regeneration. Biochem J. 2001;356:737–745. doi: 10.1042/0264-6021:3560737. [DOI] [PMC free article] [PubMed] [Google Scholar]
- 23.O'Connell TD, Ishizaka S, Nakamura A, Swigart PM, Rodrigo MC, Simpson GL, Cotecchia S, Rokosh DG, Grossman W, Foster E, Simpson PC. The alpha(1A/C)- and alpha(1B)-adrenergic receptors are required for physiological cardiac hypertrophy in the double-knockout mouse. J Clin Invest. 2003;111:1783–1791. doi: 10.1172/JCI16100. [DOI] [PMC free article] [PubMed] [Google Scholar]
- 24.Yao CC, Ziober BL, Squillace RM, Kramer RH. Alpha7 integrin mediates cell adhesion and migration on specific laminin isoforms. J Biol Chem. 1996;271:25598–25603. doi: 10.1074/jbc.271.41.25598. [DOI] [PubMed] [Google Scholar]
- 25.Ozeki N, Lim M, Yao CC, Tolar M, Kramer RH. alpha7 integrin expressing human fetal myogenic progenitors have stem cell-like properties and are capable of osteogenic differentiation. Exp Cell Res. 2006;312:4162–4180. doi: 10.1016/j.yexcr.2006.09.017. [DOI] [PMC free article] [PubMed] [Google Scholar]
- 26.Hlaing M, Shen X, Dazin P, Bernstein HS. The hypertrophic response in C2C12 myoblasts recruits the G1 cell cycle machinery. J Biol Chem. 2002;277:23794–23799. doi: 10.1074/jbc.M201980200. [DOI] [PubMed] [Google Scholar]
- 27.Sharpless T, Traganos F, Darzynkiewicz Z, Melamed MR. Flow cytofluorimetry: discrimination between single cells and cell aggregates by direct size measurements. Acta Cytol. 1975;19:577–581. [PubMed] [Google Scholar]
- 28.d'Albis A, Couteaux R, Janmot C, Roulet A, Mira JC. Regeneration after cardiotoxin injury of innervated and denervated slow and fast muscles of mammals. Myosin isoform analysis. Eur J Biochem. 1988;174:103–110. doi: 10.1111/j.1432-1033.1988.tb14068.x. [DOI] [PubMed] [Google Scholar]
- 29.Horsley V, Friday BB, Matteson S, Kegley KM, Gephart J, Pavlath GK. Regulation of the growth of multinucleated muscle cells by an NFATC2-dependent pathway. J Cell Biol. 2001;153:329–338. doi: 10.1083/jcb.153.2.329. [DOI] [PMC free article] [PubMed] [Google Scholar]
- 30.LaBarge MA, Blau HM. Biological progression from adult bone marrow to mononucleate muscle stem cell to multinucleate muscle fiber in response to injury. Cell. 2002;111:589–601. doi: 10.1016/s0092-8674(02)01078-4. [DOI] [PubMed] [Google Scholar]
- 31.Kuang S, Kuroda K, Le Grand F, Rudnicki MA. Asymmetric self-renewal and commitment of satellite stem cells in muscle. Cell. 2007;129:999–1010. doi: 10.1016/j.cell.2007.03.044. [DOI] [PMC free article] [PubMed] [Google Scholar]
- 32.Blanco-Bose WE, Yao CC, Kramer RH, Blau HM. Purification of mouse primary myoblasts based on alpha 7 integrin expression. Exp Cell Res. 2001;265:212–220. doi: 10.1006/excr.2001.5191. [DOI] [PubMed] [Google Scholar]
- 33.Yao CC, Breuss J, Pytela R, Kramer RH. Functional expression of the alpha 7 integrin receptor in differentiated smooth muscle cells. J Cell Sci. 1997;110(Pt 13):1477–1487. doi: 10.1242/jcs.110.13.1477. [DOI] [PubMed] [Google Scholar]
- 34.Wilson A, Murphy MJ, Oskarsson T, Kaloulis K, Bettess MD, Oser GM, Pasche AC, Knabenhans C, Macdonald HR, Trumpp A. c-Myc controls the balance between hematopoietic stem cell self-renewal and differentiation. Genes Dev. 2004;18:2747–2763. doi: 10.1101/gad.313104. [DOI] [PMC free article] [PubMed] [Google Scholar]
- 35.Landberg G, Tan EM, Roos G. Flow cytometric multiparameter analysis of proliferating cell nuclear antigen/cyclin and Ki-67 antigen: a new view of the cell cycle. Exp Cell Res. 1990;187:111–118. doi: 10.1016/0014-4827(90)90124-s. [DOI] [PubMed] [Google Scholar]
- 36.Haendeler J, Hoffmann J, Tischler V, Berk BC, Zeiher AM, Dimmeler S. Redox regulatory and anti-apoptotic functions of thioredoxin depend on S-nitrosylation at cysteine 69. Nat Cell Biol. 2002;4:743–749. doi: 10.1038/ncb851. [DOI] [PubMed] [Google Scholar]
- 37.Sabourin LA, Rudnicki MA. The molecular regulation of myogenesis. Clinical genetics. 2000;57:16–25. doi: 10.1034/j.1399-0004.2000.570103.x. [DOI] [PubMed] [Google Scholar]
- 38.Holmes C, Stanford WL. Stem Cell Antigen-1: Expression, Function, and Enigma. Stem Cells. 2007 doi: 10.1634/stemcells.2006-0644. [DOI] [PubMed] [Google Scholar]
- 39.Durbeej M, Campbell KP. Muscular dystrophies involving the dystrophin-glycoprotein complex: an overview of current mouse models. Curr Opin Genet Dev. 2002;12:349–361. doi: 10.1016/s0959-437x(02)00309-x. [DOI] [PubMed] [Google Scholar]
- 40.Deasy BM, Lu A, Tebbets JC, Feduska JM, Schugar RC, Pollett JB, Sun B, Urish KL, Gharaibeh BM, Cao B, Rubin RT, Huard J. A role for cell sex in stem cell-mediated skeletal muscle regeneration: female cells have higher muscle regeneration efficiency. J Cell Biol. 2007;177:73–86. doi: 10.1083/jcb.200612094. [DOI] [PMC free article] [PubMed] [Google Scholar]
- 41.Rock KL, Reiser H, Bamezai A, McGrew J, Benacerraf B. The LY-6 locus: a multigene family encoding phosphatidylinositol-anchored membrane proteins concerned with T-cell activation. Immunol Rev. 1989;111:195–224. doi: 10.1111/j.1600-065x.1989.tb00547.x. [DOI] [PubMed] [Google Scholar]
- 42.van de Rijn M, Heimfeld S, Spangrude GJ, Weissman IL. Mouse hematopoietic stem-cell antigen Sca-1 is a member of the Ly-6 antigen family. Proc Natl Acad Sci U S A. 1989;86:4634–4638. doi: 10.1073/pnas.86.12.4634. [DOI] [PMC free article] [PubMed] [Google Scholar]
- 43.Malek TR, Danis KM, Codias EK. Tumor necrosis factor synergistically acts with IFN-gamma to regulate Ly-6A/E expression in T lymphocytes, thymocytes and bone marrow cells. J Immunol. 1989;142:1929–1936. [PubMed] [Google Scholar]
- 44.Ortega G, Korty PE, Shevach EM, Malek TR. Role of Ly-6 in lymphocyte activation. I. Characterization of a monoclonal antibody to a nonpolymorphic Ly-6 specificity. J Immunol. 1986;137:3240–3246. [PubMed] [Google Scholar]
- 45.Spangrude GJ, Brooks DM. Mouse strain variability in the expression of the hematopoietic stem cell antigen Ly-6A/E by bone marrow cells. Blood. 1993;82:3327–3332. [PubMed] [Google Scholar]
- 46.Scime A, Rudnicki MA. Anabolic potential and regulation of the skeletal muscle satellite cell populations. Curr Opin Clin Nutr Metab Care. 2006;9:214–219. doi: 10.1097/01.mco.0000222102.21385.7d. [DOI] [PubMed] [Google Scholar]
- 47.Sherwood RI, Christensen JL, Conboy IM, Conboy MJ, Rando TA, Weissman IL, Wagers AJ. Isolation of adult mouse myogenic progenitors: functional heterogeneity of cells within and engrafting skeletal muscle. Cell. 2004;119:543–554. doi: 10.1016/j.cell.2004.10.021. [DOI] [PubMed] [Google Scholar]
- 48.Sherwood RI, Christensen JL, Weissman IL, Wagers AJ. Determinants of skeletal muscle contributions from circulating cells, bone marrow cells, and hematopoietic stem cells. Stem Cells. 2004;22:1292–1304. doi: 10.1634/stemcells.2004-0090. [DOI] [PubMed] [Google Scholar]
- 49.Cornelison DD, Wold BJ. Single-cell analysis of regulatory gene expression in quiescent and activated mouse skeletal muscle satellite cells. Dev Biol. 1997;191:270–283. doi: 10.1006/dbio.1997.8721. [DOI] [PubMed] [Google Scholar]
- 50.Weintraub H. The MyoD family and myogenesis: redundancy, networks, and thresholds. Cell. 1993;75:1241–1244. doi: 10.1016/0092-8674(93)90610-3. [DOI] [PubMed] [Google Scholar]
- 51.Hinterberger TJ, Sassoon DA, Rhodes SJ, Konieczny SF. Expression of the muscle regulatory factor MRF4 during somite and skeletal myofiber development. Dev Biol. 1991;147:144–156. doi: 10.1016/s0012-1606(05)80014-4. [DOI] [PubMed] [Google Scholar]
- 52.Smith CK, 2nd, Janney MJ, Allen RE. Temporal expression of myogenic regulatory genes during activation, proliferation, and differentiation of rat skeletal muscle satellite cells. J Cell Physiol. 1994;159:379–385. doi: 10.1002/jcp.1041590222. [DOI] [PubMed] [Google Scholar]
Associated Data
This section collects any data citations, data availability statements, or supplementary materials included in this article.
Supplementary Materials
Flow cytometric analysis of Sca-1 co-expression with desmin and myosin in α7-integrin+ cells isolated from tibialis anterior muscle 72hrs following injury (upper), and in cultured C2C12 skeletal myoblasts grown in differentiation medium for 48hrs (lower) [5]. During early myoblast activation following injury in vivo, there is little overlap in expression between desmin (upper left) or myosin (upper right) and Sca-1. Similarly, in differentiating C2C12 myoblasts there is little overlap between Sca-1 and myosin expression (lower). These data suggest that Sca-1 expression is lost in vivo and in vitro as proliferating myoblasts differentiate toward myocytes expressing desmin and myosin.
(A and B) Tibial length, total body weights and wet TA muscle weights of female (A) and male (B) mice were plotted against the postnatal age of individual Sca-1+/+ (black triangle) and Sca-1−/− (green square) animals. There was no significant difference in growth parameters between Sca-1+/+ and Sca-1−/− mice, regardless of gender, from weaning (3–5 wks) through adulthood (35–40 wks). (C and D) TA muscle from adult Sca-1+/+ and Sca-1−/− mice were stained with H&E. (C) No differences were seen between histopathology of Sca-1−/− and Sca-1+/+ TA muscle. Representative cross-sections are shown. Bars, 100μm. (D) Histograms depict 400–700 fiber CSAs from Sca-1−/− (dashed line) and Sca- 1+/+ (solid line) TA muscles. No significant difference was noted between the CSAs of Sca-1 −/− and Sca-1+/+ mice for either gender.
(A) Sample H&E-stained cross-sections of Sca-1+/+ TA muscles from adult female mice 7 and 25 days after cardiotoxin-induced myonecrotic injury. Bars, 100μm. R1, injured area; R2, adjacent uninjured area. (B) CSA frequency histograms comprised of 200–400 fibers from Sca-1+/+ (solid line) and Sca-1−/− (dashed line) mice at 7 and 25 days following injury. Adjacent uninjured Sca-1−/− fibers (R2) were not significantly different from Sca-1+/+ fibers 7 days after injury (Region 2 (D7)), however, there was a greater frequency of larger Sca-1−/− fibers (>2000μm2) 25 days after injury compared to Sca-1+/+ fibers (Region 2 (D25)). *, C2=72.4; DF 6; p<0.0001.