

Abstract
Staphylocoagulase (SC) is a potent nonproteolytic prothrombin (ProT) activator and the prototype of a newly established zymogen activator and adhesion protein family. The staphylocoagulase fragment containing residues 1–325 (SC-(1–325)) represents a new type of nonproteolytic activator with a unique fold consisting of two three-helix bundle domains. The N-terminal, domain 1 of SC (D1, residues 1–146) interacts with the 148 loop of thrombin and prethrombin 2 and the south rim of the catalytic site, whereas domain 2 of SC (D2, residues 147–325) occupies (pro)exosite I, the fibrinogen (Fbg) recognition exosite. Reversible conformational activation of ProT by SC-(1–325) was used to create novel analogs of ProT covalently labeled at the catalytic site with fluorescence probes. Analogs selected from screening 10 such derivatives were used to characterize quantitatively equilibrium binding of SC-(1–325) to ProT, competitive binding with native ProT, and SC domain interactions. The results support the conclusion that SC-(1–325) binds to a single site on fluorescein-labeled and native ProT with indistinguishable dissociation constants of 17–72 pM. The results obtained for isolated SC domains indicate that D2 binds ProT with ~130-fold greater affinity than D1, yet D1 binding accounts for the majority of the fluorescence enhancement that accompanies SC-(1–325) binding. The SC-(1–325)·(pro)thrombin complexes and free thrombin showed little difference in substrate specificity for tri-peptide substrates or with their natural substrate, Fbg. Lack of a significant effect of blockage of (pro)exosite I of (pro)thrombin by SC-(1–325) on Fbg cleavage indicates that a new Fbg substrate recognition exosite is expressed on the SC-(1–325)·(pro)thrombin complexes. Our results provide new insight into the mechanism that mediates zymogen activation by this prototypical bacterial activator.
Staphylocoagulase (SC)3 is the prototype of a newly established zymogen activator and adhesion protein family (1). SC nonproteolytically activates the blood coagulation zymogen, prothrombin (ProT) through interactions localized to the N-terminal 324 residues, and the SC-(1–325)·(pro)thrombin catalytic complex recognizes and cleaves fibrinogen (Fbg) as a specific substrate (2–4). The C-terminal region of SC contains five to eight 27-residue repeat sequences that mediate distinctly different Fbg binding interactions (5). Binding of C-terminal regions of SC to Fbg may localize the active SC·ProT complex to the platelet surfaces through Fbg bound to αIIbβ3 integrin (6).
The recently determined crystal structure of a functional N-terminal fragment of SC (SC-(1–325)) bound to the catalytic domain of ProT, prethrombin 2 (Pre 2) (1) provided the first structural proof of the “molecular sexuality” mechanism of zymogen activation (7). The N terminus of SC is bound to the “Ile16 pocket” (chymotrypsinogen numbering) of Pre 2, presenting Ile1-Val2 residues of SC to Asp194 of Pre 2 and resulting in formation of the salt bridge necessary for proper serine proteinase folding and catalytic activity. SC-(1–325) is a boomerang-shaped molecule that consists primarily of two three-helix bundle domains. The N-terminal domain (D1) of SC-(1–325) interacts with the 148 loop of Pre 2, positioning the N terminus for insertion into the Ile16 pocket, whereas the second domain (D2) binds to (pro)exosite I on thrombin, Pre 2, and ProT (1). The SC·(pro)thrombin complex cleaves Fbg specifically to generate fibrin clots in a process that is thought to contribute to the pathology of Staphylococcus aureus in human diseases such as pulmonary infections (8) and acute bacterial endocarditis (9). Fbg recognition and cleavage by the SC-(1–325)·(pro)thrombin complexes and studies of full-length SC (10) or C-terminal regions of SC (6) indicate that there are two distinct modes of Fbg binding. The two distinct modes of interaction with Fbg may localize the SC·(pro)thrombin complexes pathophysiologically and mediate specific Fbg cleavage, although the relationship between these interactions is unknown.
The procoagulant and anticoagulant specificity of α-thrombin is linked to the expression of exosite I (11–15), which directs specific recognition of numerous macromolecular substrates (factor V (16–18), factor VIII (16), Fbg (19), and proteinase-activated receptors (20, 21)), inhibitors (hirudin (15, 22) and heparin cofactor II (23, 24)), and regulatory proteins (thrombomodulin (25) and fibrin (19, 26)). Substrate specificity studies of SC·(pro)thrombin complexes indicate a highly restricted specificity for Fbg. The SC complexes do not cleave other physiological thrombin substrates, including factor V, factor VIII, or proteinase-activated receptors (3, 27). SC binding to (pro)thrombin imparts resistance to the serpin inhibitors of thrombin, antithrombin-heparin (3, 28), and heparin cofactor II.4 Because SC·(pro)thrombin complexes cleave Fbg specifically with D2 of SC occupying (pro)exosite I, Fbg substrate recognition must occur through a different site. A detailed structural analysis of the interfaces of D1 and D2 of SC-(1–325) with ProT and prediction of the mode of Fbg recognition by the SC-(1–325)·(pre)thrombin complexes are presented in the accompanying paper (29).
To quantitate binding of SC-(1–325) to ProT and binding of Fbg (29), we developed novel active site-labeled fluorescent analogs of the ProT zymogen as probes of the interactions.5 The analogs are based on the reversibility of SC-induced ProT activation, which allows irreversible inactivation of the catalytic site of the zymogen by hemiketal formation with Ser195 and alkylation of His57 with the inhibitor Nα-[(acetylthio)acetyl]-D-Phe-Pro-Arg-CH2Cl (ATA-FPR-CH2Cl), followed by specific attachment of various probes, and separation of the fluorescent zymogen derivatives from SC-(1–325). Equilibrium binding of SC-(1–325) to ProT was characterized for the first time by the use of fluorescent ProT analogs selected by screening a panel of 10 derivatives for reporters of the interaction. Our results demonstrate that SC-(1–325) binds to active site-labeled ProT analogs and native ProT with a 1:1 stoichiometry and extremely high affinity (KD = 17–72 pM). SC-(1–325)·ProT complexes formed with native ProT were cleaved slowly at both thrombin-sensitive sites, Arg155-Ser156 and Arg284-Thr285, generating prethrombin 1 (Pre 1) and fragment 1 and generating Pre 2′ and fragment 2, respectively. D1 binding to labeled ProT accounted primarily for the fluorescence enhancement observed upon SC-(1–325) binding, whereas the affinity of the isolated D2 for ProT was ~130-fold greater than that of D1. SC-(1–325) complexes with thrombin and ProT exhibited equivalent Fbg clotting activities, only small differences in specificity for tripeptide chromogenic substrates compared with free thrombin, and no preference for the sequences preceding the cleavage sites for release of fibrinopeptides A and B. The blockage of exosite I-dependent Fbg clotting activity by SC-(1–325) and the small changes in tripeptide substrate specificity suggest that Fbg recognition is mediated by an exosite on the complex. Further studies of the Fbg interaction are presented in the companion paper (29).
EXPERIMENTAL PROCEDURES
Protein Purification and Characterization
ProT was purified from human plasma (30). α-Thrombin was active site-titrated by previously described methods (30). The proteins were pure as determined by SDS gel electrophoresis. The protein concentrations were determined by absorbance at 280 nm with the following absorption coefficients ((mg/ml)−1cm−1) and molecular weights (31, 32): ProT, 1.47, 71,600; thrombin, 1.74, 36,600; Fbg, 1.54, 340,000; Met-SC-(1–325) and SC-(1–325), 1.00, 38,000; D1, 1.42, 17,562 (calculated); D2, 0.64, 20,398 (calculated); and Met-SC-(1–325)-His6, 0.96, 39,461 (calculated). Absorption coefficients for SC species were calculated from the aromatic amino acid composition (33).
Recombinant Staphylocoagulase-(1–325) and Fusion Proteins
Met-SC-(1–325) and SC-(1–325) were expressed, purified, and characterized as described previously (1). Met-SC-(1–325) fused to a C-terminal His6 tag (Met-SC-(1–325)-His6) was prepared by deleting a stop codon, which allowed translation of additional Lys-Leu-Ala-Ala-Ala-Leu-Glu-His6 residues. Met-SC-(1–325)-His6 was expressed in Escherichia coli strain BL21(DE3) plysS. The cells were grown to an optical density of 0.4–0.6 at 600 nm and induced by the addition of 500 μM isopropyl-β-D-thiogalactopyranoside. The cells were induced for 4–6 h and lysed by three rounds of consecutive freeze-thaw cycles or sonication, and Met-SC-(1–325)-His6 was purified from the soluble fraction after centrifugation, by Ni2+-iminodiacetic acid-Sepharose chromatography. Met-SC-(1–325)-His6 activated ProT, as measured by H-D-Phe-Pip-Arg-p-nitroanilide assay, with comparable activity as determined previously for Met-SC-(1–325) (1). Met-SC-(1–325)-His6 was used instead of Met-SC-(1–325) in ProT labeling to facilitate separation of the activator and labeled zymogen.
Preparation of Active Site-labeled ProT Analogs
The thrombin-selective thioester-peptide chloromethyl ketone, ATA-FPR-CH2Cl, was prepared as described previously (30, 34), and labeling followed a protocol similar to that described previously for streptokinase (SK)-mediated fluorescence labeling of plasminogen (35). The Met-SC-(1–325)·ProT complex was inactivated by adding 145–200 μM ATA-FPR-CH2Cl to 45–60 μM ProT in 50 mM Hepes, 110 mM NaCl, 5 mM CaCl2, 1 mg/ml polyethylene glycol 8000, pH 7.4 buffer (Buffer A) at 25 °C. Inhibition reactions were initiated by the addition of 90–120 μM Met-SC-(1–325) and were monitored by the decrease in the rate of hydrolysis of H-D-Phe-Pip-Arg-pNA. The reactions were typically complete (<0.1% activity) within 1 h. To ensure complete inhibition, 200 μM FPR-CH2Cl was added. Excess inhibitor was removed by Sephadex G-25 chromatography in 0.1 M Hepes, 0.1 M NaCl, 5 mM CaCl2, pH 7.0 buffer. Met-SC-(1–325)·ATA-FPR-ProT (10–25 μM) was labeled by the addition of a 10-fold molar excess of the desired thiol-reactive probe derivative and subsequent addition of 0.1 M NH2OH, followed by incubation for 1–2 h in the dark at 25 °C. Excess label was removed by Sephadex G-25 chromatography. Met-SC-(1–325)-labeled ProT complex was concentrated and dissociated by dialysis against Buffer A with 3 M NaSCN but without polyethylene glycol 8000. The dissociated proteins were separated by fast protein liquid chromatography gel filtration chromatography on 2–3 tandem Superdex 200 HR 10/30 columns equilibrated with the same buffer. Fractions containing the first of two overlapping peaks, consisting primarily of labeled ProT, were pooled and dialyzed against 50 mM Hepes, 125 mM NaCl buffer, pH 7.4 (Buffer B). The pooled protein was rechromatographed on Superdex 200 HR 10/30 in Buffer B under the same conditions. Fractions containing the second of two peaks, consisting of labeled ProT, were pooled, quick-frozen, and stored at −70 °C.
A second, improved method was subsequently used for separation of labeled ProT from the Met-SC-(1–325)-labeled ProT complex using Met-SC-(1–325)-His6. The Met-SC-(1–325)-His6·ProT complex was formed, inactivated, and labeled, and excess probe was removed as described above. Met-SC-(1–325)-His6·labeled ProT was chromatographed on Ni2+-iminodiacetic acid-Sepharose in Buffer B. Labeled ProT was step-eluted with 3 M NaSCN, and the majority of Met-SC-(1–325)-His6 was eluted with a gradient of imidazole up to 500 mM. Trace amounts of Met-SC-(1–325)-His6-labeled ProT complex were removed by fast protein liquid chromatography gel filtration on Superdex 200 HR 10/30 in Buffer B. Two peaks corresponding to Met-SC-(1–325)-His6-labeled ProT complex and free labeled ProT were eluted, and the labeled analog was pooled, dialyzed against Buffer B, quick-frozen, and stored at −70 °C.
Characterization of Labeled ProT
The stoichiometry of fluorescence probe incorporation into ProT for 5-(iodoacetamido)fluorescein (5F), 2-((4′-iodoacetamido)anilino)naphthalene-6-sulfonic acid (ANS), and Oregon Green 488 iodoacetamide or 5-(and 6)-iodoacetamido-2′,7′-difluorofluorescein (OG) was determined from the absorbance at 280 nm and the corresponding probe absorbance in 0.1 M Tris-HCl, 1 mM EDTA, 6 M guanidine, pH 8.5. For 5F-labeled ProT, 84,000 M−1 cm−1 at 498 nm and an absorbance ratio A280 nm/A498 nm of 0.19 were used (36). Incorporation of ANS was measured using 26,000 M−1 cm−1 at 328 nm and A280 nm/A328 nm of 0.78 (30). Incorporation of OG was measured using 55,800 M−1 cm−1 at 491 nm and A280 nm/A491 nm of 0.29 (37). The concentration of residual active ProT was determined by chromogenic substrate assay of 25 nM labeled ProT after incubation with a 5-fold excess of SC-(1–325) for 20 min at 25 °C, relative to a known concentration of the native SC-(1–325)·ProT complex.
Fluorescence Studies
Fluorescence was measured with an SLM 8100 fluorometer, in acrylic cuvettes coated with polyethylene glycol 20,000. All of the experiments were performed in Buffer A at 25 °C. Corrections for background were made from parallel measurements on blanks lacking the labeled species. Binding of SC-(1–325) (or when applicable isolated SC domains) to various labeled ProT analogs was measured in titrations of labeled ProT monitoring the change in fluorescence at probe emission wavelengths (nm) of ProT labeled with: dansylaziridine (DAN), 506; ANS, 438; 6-acryloyl-2-dimethylaminonaphthalene (ACR), 502; 6-bromoacetyl-2-dimethyl-aminonaphthalene (BAD), 510; AF350 (the sulfonated coumarin derivative called AlexaFluor 350 C5 maleimide), 436; BODIPY® 507/545 iodoacetamide or N-(4,4-difluoro-1,3,5,7-tetramethyl-4-bora-3a,4a-diaza-s-indacene-2-yl)iodoacetamide (BD), 535; tetramethylrhodamine-5-iodoacetamide dihydroiodide (TMR), 580; 4′-(iodoacetamido)fluorescein (4′F), 521; and 5F and OG, 520. The probes were excited at wavelengths (nm): DAN, 343; ANS, 335; ACR, 398; BAD, 400; AF350, 352; BD, 506; TMR, 550; and 4′F, 5F, and OG, 490. The fluorescence changes measured as a function of total SC-(1–325) concentration and expressed as (Fobs − Fo)/Fo = ΔF/Fo were fit by the quadratic binding equation to obtain the maximum fluorescence change ((Fmax − Fo)/Fo = ΔFmax/Fo), the dissociation constant (KD), and the stoichiometric factor (n). Nonlinear least squares fitting was performed with SCIENTIST software (MicroMath). The error estimates represent ± 2 S.D.
[OG]FPR-ProT Fluorescence Emission Spectra
[OG]FPR-ProT was excited at 490 nm in the absence and presence of 500 nM SC-(1–325), 8 μM D1, and 8 μM D2, and the spectra were collected (8-nm band pass) in 1 nM steps with two consecutive scans averaged. Emission spectra of D1 binding to [OG]FPR-ProT were recorded at D1 concentrations of 0.5, 1.6, 3.8, 5.6, and 8 μM.
Proteolytic Cleavage of ProT in the Presence of SC-(1–325)
To characterize cleavage of the SC-(1–325)·ProT complex, mixtures of 2 μM [OG]FPR-ProT and 0.05–12 μM SC-(1–325) were incubated for 18 h in the dark at 25 °C in the presence of 10 μM FPR-CH2Cl. Similar reactions were performed in the presence of 2 μM native ProT without inhibitor and in the presence of 100 μM FPR-CH2Cl and 4-(2-aminoethyl)-benzenesulfonyl fluoride (AEBSF). The cleavage products were identified by SDS gel electrophoresis in comparison with purified ProT fragments. The gels were stained for protein with GelCode Blue (Pierce), and fluorescence was visualized with a 300-nm transilluminator.
Competitive Binding of SC-(1–325) to Native ProT and [OG]FPR-ProT
The effect of native ProT on SC-(1–325) binding to 0.12 nM [OG]FPR-ProT was measured in titrations with native ProT, at fixed concentrations of SC-(1–325) (0.5, 5, and 10 nM). The fluorescence changes for individual reactions were calculated from 30–40-min time course measurements for a reaction blank, [OG]FPR-ProT alone, and mixtures of [OG]FPR-ProT and native ProT after the addition of SC-(1–325). Together with the direct titration data of [OG]FPR-ProT with SC-(1–325), the data were fit simultaneously by the cubic equation for tight competitive binding of SC-(1–325) to labeled and native ProT to determine the dissociation constant and stoichiometry for the native SC-(1–325)·ProT interaction (38, 39).
D2 Binding to (Pro)exosite I on ProT
To determine whether the isolated SC-(147–325) fragment containing D2 and excluding D1 bound (pro)exosite I of ProT, competitive binding experiments were performed using the fluorescein-labeled C-terminal hirudin peptide, Gly54-Asp-Phe-Glu-Glu-Ile-Pro-Glu-Glu-Tyr( )-Leu-Gln65 ([5F]Hir-(54–65)( )) (15). The titrations were performed and analyzed with the cubic equation as described previously for Met-SC-(1–325) binding to proexosite I on ProT (1).
Fbg Clotting Assays
Fbg clotting assays were performed at 37 °C with a fibrometer (40). Relative clotting activity was determined by comparison with an α-thrombin standard from the slopes of plots of clotting time against the reciprocal of the enzyme concentration. Hir-(54–65)( ) was used at 20 μM as an exosite I-specific inhibitor (19).
Chromogenic Substrate Kinetics
Kinetic parameters for hydrolysis of chromogenic substrates by α-thrombin and SC-(1–325)·(pro)thrombin were determined by monitoring the absorbance increase at 405 nm in Buffer A containing 1 mg/ml bovine serum albumin and 0.1 mg/ml soybean trypsin inhibitor at 25 °C, using polyethylene glycol 20,000-coated cuvettes. For substrates with low Km, H-D-Phe-Pip-Arg-pNA, H-D-Ile-Pro-Arg-pNA, and H-D-Phe-Pro-Arg-pNA, the kinetic parameters, kcat, Km and when applicable, Ki, were determined by simultaneous fits of the integrated Michaelis-Menten equation (including competitive product inhibition) to the full reaction progress curves for conversion of substrate at concentration ranges of 0.9–1, 4–5, 8–10, and 17–20 μM by 0.5 nM enzyme and 60 μM by 5 nM enzyme for each substrate. For Gly-Val-Arg-pNA, Ser-Ala-Arg-pNA, and CH3-Gly-Gly-Arg-pNA, the kinetic parameters were determined by fitting the Michaelis-Menten equation to initial rates collected over a substrate concentration range of 0–6 mM. In all of the assays, SC-(1–325) and (pro)thrombin were preincubated for at least 20 min, and the reactions were initiated by the addition of substrate. Because the complex-dependent proteolysis described below is minimized at the concentrations used in the kinetic studies, there was no variation of the initial rates beyond the 20-min preincubation time.
RESULTS
Active Site Labeling of ProT
Active site-labeled fluorescent analogs of ProT were prepared as novel probes of SC-induced ProT activation and Fbg substrate recognition (Fig. 1A and the accompanying paper (29)). The catalytic site induced by Met-SC-(1–325) binding to ProT was inactivated by hemiketal formation with Ser195 and His57 alkylation with the thioester-peptide chloromethyl ketone, ATA-FPR-CH2Cl (30, 34, 35, 41). Subsequent generation of the free thiol by treatment with NH2OH, and probe incorporation by reaction with a thiol-reactive fluorescence probe yielded the labeled ProT zymogen. Specificity of ProT labeling was examined by determining the dependence of fluorescence probe incorporation on each of the steps in the reaction scheme (Fig. 1A), as seen by fluorescence (Fig. 1B) and protein staining (Fig. 1C) on SDS gels. The protein bands of SC-(1–325) and ProT are seen as individual bands on the gels because the complex dissociates in SDS. The reaction in lane 1 showed that without SC-(1–325) no probe was incorporated because of the lack of zymogen activation. The reaction in lane 6 showed that the absence of NH2OH prevented probe incorporation, indicating the need for the free thiol. Blocking of the catalytic site in the Met-SC-(1–325)·ProT complex with FPR-CH2Cl before reaction with ATA-FPR-CH2Cl also blocked probe incorporation, demonstrating the requirement for reaction of the inhibitor with the activated zymogen (Fig. 1, B and C, lane 7). The results demonstrated specific labeling of the SC-activated catalytic site of the ProT zymogen. Preparation of a Met-SC-(1–325)-His6 construct allowed separation of labeled ProT from SC-(1–325) based on the high affinity of His6 for Ni2+-iminodiacetic acid under dissociating conditions (3 M NaSCN) and purification of the labeled analog (Fig. 1, B and C, lane 8). Stoichiometries of probe incorporation into the isolated zymogen were 0.82–0.98 mol probe/mol of ProT for ANS, 5F, and OG. Preparations of labeled ProT had residual activities of 1–3%, determined by the activity generated with excess SC-(1–325).
FIGURE 1. Specificity of ProT active site-labeling.
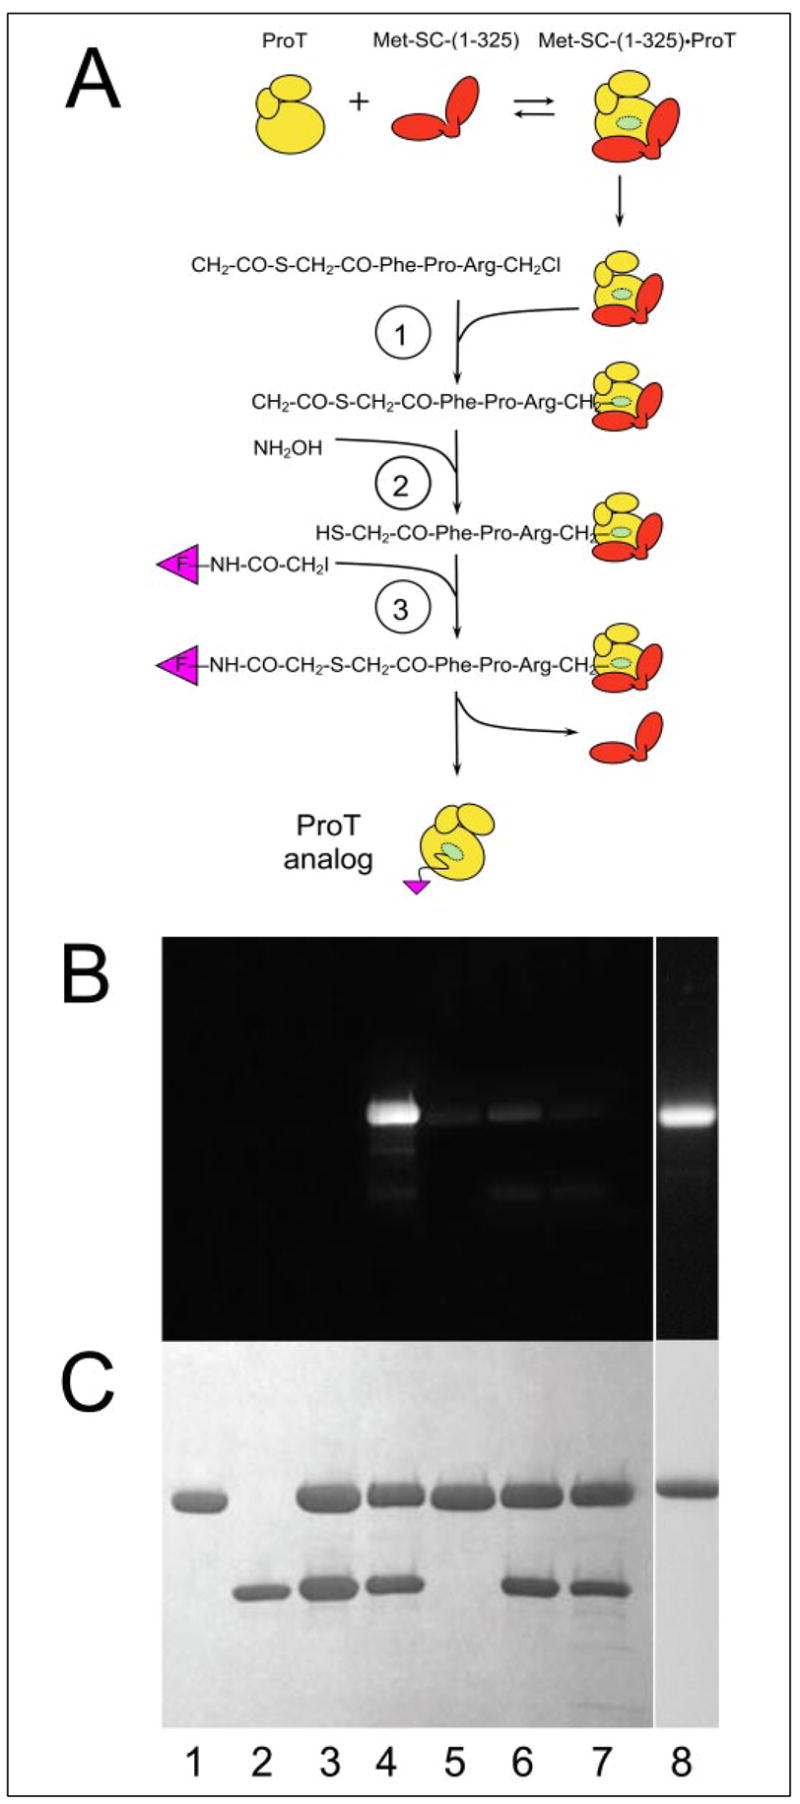
A, the three reactions of the active site labeling scheme are shown for inactivation of ProT in the Met-SC-(1–325)·ProT complex with ATA-FPR-CH2Cl (1), generation of the thiol (2), and labeling with a fluorescence probe-iodoacetamide (3). B and C, specificity of Met-SC-(1–325)·ProT complex labeling with 5F assessed by SDS gel electrophoresis. The fluorescence (B) and protein-stained bands (C) are shown for reduced samples of ProT (lane 1), Met-SC-(1–325) (lane 2), ATA-FPR-CH2Cl-inactivated Met-SC-(1–325)·ProT complex (lane 3), and the products of the complete labeling reactions (lane 4), compared with controls in which Met-SC-(1–325) was omitted (lane 5), NH2OH was omitted (lane 6), or the catalytic site of the SC-(1–325)·ProT complex was blocked with FPR-CH2Cl before subjection to all of the labeling reactions (lane 7). The purified fluorescein-labeled ProT analog separated from Met-SC-(1–325) (lane 8). Labeling reactions were performed as described under “Experimental Procedures.”
Screening of ProT Analogs for Signals Accompanying SC-(1–325) Binding
An array of ProT analogs containing 10 fluorescence probes with various fluorescence spectral properties was prepared. The results of fluorescence titrations with SC-(1–325) are grouped by similar probe structures in Fig. 2. SC-(1–325) titrations of 50–285 nM labeled ProT indicated that SC-(1–325) bound ProT with a 0.84–1.00 stoichiometry for those that could be determined (ACR, AF350, BD, 4′F, 5F, OG, and TMR). The KD values were poorly defined in these single titrations because of the apparent, very high affinity in relation to the labeled ProT concentrations. The signs and amplitudes of the fluorescence changes accompanying SC-(1–325) binding were dependent on the structures and spectral properties of the probes with no obvious correlation with polarity sensitivity (Fig. 2). Interestingly, the polarity-sensitive probes, ACR and BAD, the adducts of which differ only by a methylene group in the linker, showed a 62% enhancement and essentially no change, respectively (Fig. 2A).
FIGURE 2. Fluorescence titrations of an array of ProT analogs with SC-(1–325).
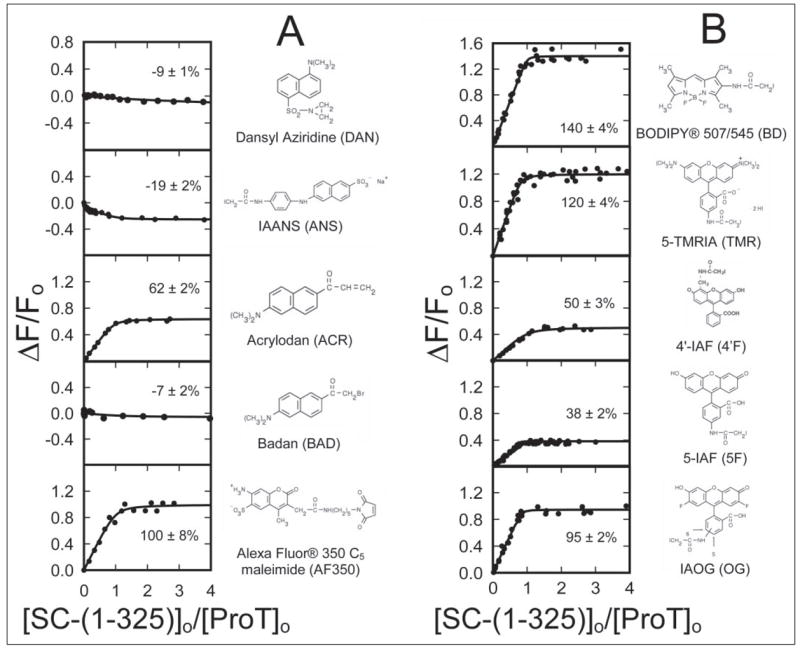
The fractional change in fluorescence (ΔF/Fo) is plotted against the ratio of the total concentrations of SC-(1–325) to ProT ([SC-(1–325)]o/[ProT]o) for 10 ProT analogs labeled with the indicated thiol-reactive probes, grouped roughly by similar structures in A and B. The lines through the data represent the least squares fits of the binding equation with the indicated maximum fluorescence changes (%). The fluorescence titrations were performed and analyzed as described under “Experimental Procedures.”
Quantitation of SC-(1–325) Binding to [OG]FPR-ProT and [5F]FPR-ProT
All of the high quantum yield fluorescein-ProT derivatives, OG, 5F, and 4′F, showed large fluorescence enhancements of 95, 38, and 50%, respectively, at saturating SC-(1–325) (Fig. 2B). [OG]FPR-ProT and [5F]FPR-ProT were selected for quantitating SC-(1–325) binding to labeled ProT. Simultaneous fits of 0.11, 1, and 50 nM [OG]FPR-ProT titrations with SC-(1–325) showed that SC-(1–325) bound to 0.95 ± 0.05 mol sites/mol of ProT with a dissociation constant (KD) of 17 ± 6 pM, and a maximal fluorescence enhancement (ΔFmax/Fo) of 98 ± 2% (Fig. 3A). These results were confirmed by analysis of similar titrations of 0.075, 0.25, 2.5, 10, and 100 nM [5F]FPR-ProT, indicating binding of SC-(1–325) to 0.96 ± 0.05 mol sites/mol of ProT with a KD of 37 ± 1 pM and a maximal fluorescence enhancement of 39 ± 1% (Fig. 3B).
FIGURE 3. Fluorescence titrations of [OG]FPR-ProT and [5F]FPR-ProT with SC-(1–325).
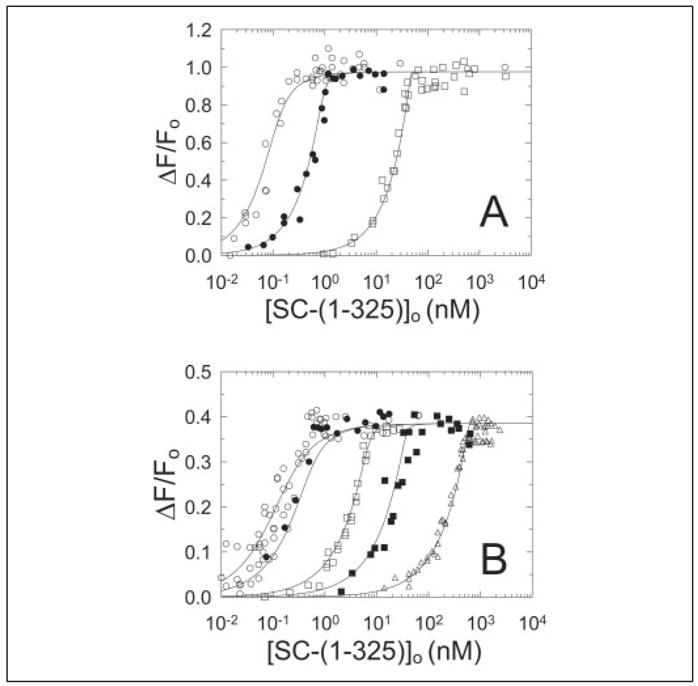
The fractional change in fluorescence (ΔF/Fo) was plotted against the total concentration of SC-(1–325) ([SC-(1–325)]o). A, titrations of 110 pM (○), 1 nM (●), and 50 nM (□) [OG]FPR-ProT. B, titrations of 75 pM (○), 250 pM (●), 2.5 nM (□), 10 nM (■), and 100 nM (△) [5F]FPR-ProT. The lines represent the simultaneous fit of the data by the quadratic binding equation with the parameters given in the text. Fluorescence titrations were performed and analyzed as described under “Experimental Procedures.”
Proteolytic Cleavage of ProT in the Presence of SC-(1–325)
To determine the proteolytic stability of the SC-(1–325)·ProT complex, we incubated [OG]FPR-ProT with fixed or varied levels of SC-(1–325), in the presence of inhibitors, and with native ProT in the presence and absence of inhibitors and analyzed the products by fluorescence and protein staining on SDS gels. Fig. 4 shows the time course of ProT conversion to Pre 1 and Pre 2 in a mixture of labeled and native ProT (4 μM each) and SC-(1–325) (8 μM). Although cleavage was not complete, there was significant production of Pre 2 over the 4-h incubation. Fig. 5 (A and B) shows the results for mixtures of a preparation of [OG]FPR-ProT that had <2% residual native ProT activity, incubated with increasing concentrations of SC-(1–325) in the presence of 10 μM FPR-CH2Cl. Labeled ProT in the absence and presence of SC-(1–325) was stable for up to 18 h in the dark at 25 °C (Fig. 5, A and B). In the presence of native ProT and in the absence of inhibitors, however, both native and labeled ProT were increasingly cleaved as a function of the SC-(1–325)·native ProT complex concentration (Fig. 5, C and D), as evidenced by the similar staining pattern seen by fluorescence (Fig. 5C) and protein staining (Fig. 5D). Cleavage was essentially complete in mixtures of 3–6 μM SC-(1–325), 2 μM native ProT, and 2 μM [OG]FPR-ProT (Fig. 5, C and D, lanes 6 and 7). It was also evident that the SC-(1–325)·native ProT complex cleaved native and [OG]FPR-ProT bound to SC-(1–325) because in mixtures incubated for >16 h at concentrations of SC-(1–325) saturating labeled and native ProT (Fig. 5C, lanes 7 and 8), essentially complete cleavage was observed. ProT cleavage in a mixture of labeled and native ProT (2 μM each) and saturating SC-(1–325) (12 μM) was completely inhibited by 100 μM FPR-CH2Cl and 100 μM AEBSF (Fig. 5, C and D, lane 9). Free ProT was also cleaved at a much slower rate by the SC-(1–325)·native ProT complex than the ProT molecules bound to SC-(1–325) (data not shown). Two major fluorescent reaction product bands were identified as Pre 1 and Pre 2′ by comparison of similar reactions with purified ProT activation species (not shown). Pre 2′ is formed by thrombin cleavage of ProT at Arg284-Thr285, resulting in a form of Pre 2 that is 13 residues shorter (42). N-terminal sequencing of the polyvinylidene difluoride membrane-blotted reaction product confirmed the N-terminal sequence of Thr-Phe-Gly-Ser-Gly, corresponding to Pre 2′.
FIGURE 4. Time dependence of ProT cleavage in the presence of SC-(1–325).

Fluorescence (A) and protein-stained bands (B) on SDS 4 –15% polyacrylamide gels are shown for samples (4 –5 μg) at zero time (lane 1) and taken from reaction mixtures at 30-min intervals (lanes 2–9) over 4 h for [OG]FPR-ProT (4 μM) and native ProT (4 μM) incubated in the presence of SC-(1–325) (8 μM). The reactions were performed as described under “Experimental Procedures.”
FIGURE 5. Proteolytic cleavage of ProT in the presence of SC-(1–325).
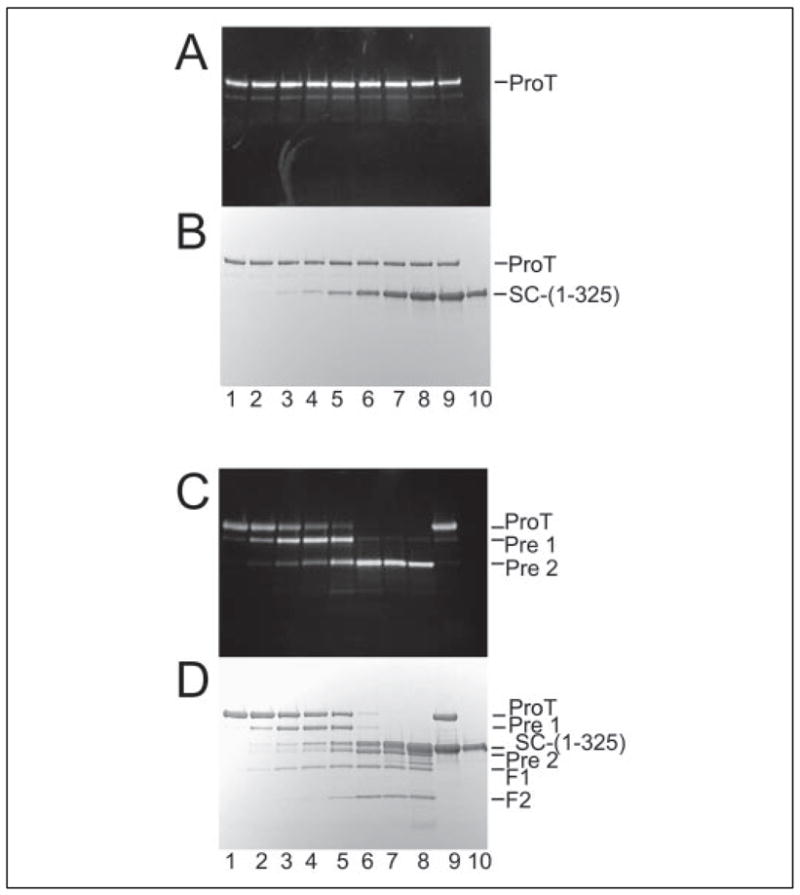
Fluorescence (A and C) and protein-stained bands (B and D) on SDS 4 –15% polyacrylamide gels are shown for samples (4 –5 μg) after 18-h reactions of varying levels of SC-(1–325) with [OG]FPR-ProT in the presence of native ProT. A and B, reactions of [OG]FPR-ProT (2 μM) alone (lane 1) and with 50 nM (lane 2), 200 nM (lane 3), 500 nM (lane 4), 1 μM (lane 5), 3 μM (lane 6), 6 μM (lane 7), and 12 μM (lane 8) SC-(1–325) in the presence of 10 μM FPR-CH2Cl. In addition, a sample containing [OG]FPR-ProT (2 μM) incubated with 12 μM SC-(1–325) in the presence of 100 μM of FPR-CH2Cl and 100 μM of AEBSF (lane 9) and a control sample of SC-(1–325) alone (lane 10) are shown. C and D, reactions of [OG]FPR-ProT (2 μM) in the presence of 2 μM native ProT with the same concentrations SC-(1–325) used in A and B. The reactions were done in the absence of FPR-CH2Cl (lanes 1– 8). A sample containing native ProT and 12 μM SC-(1–325) in the presence of 100 μM FPR-CH2Cl and 100 μM AEBSF (lane 9) and a sample of SC-(1–325) alone (lane 10) are also shown. The reaction product bands were identified as indicated by comparison with purified ProT activation species. The reactions were performed as described under “Experimental Procedures.”
Binding of SC-(1–325) to Native ProT
To characterize binding of SC-(1–325) to native ProT, [OG]FPR-ProT was used as a probe of the competitive SC-(1–325) binding equilibria in the absence of proteinase inhibitors. To resolve the rapid binding equilibrium from slower proteolytic cleavage, individual fluorescence intensity measurements were made as a function of time after the addition of SC-(1–325) to 0.5, 5, or 10 nM final concentrations to mixtures of [OG]FPR-ProT (0.12 nM) and varying native ProT. Three fluorescence intensity values were obtained for additions corresponding to buffer, [OG]FPR-ProT, and a mixture of [OG]FPR-ProT and native ProT to which SC-(1–325) was added. The fluorescence intensities stabilized within 2–3 min after the addition of SC-(1–325). The addition of native ProT had no effect on the fluorescence of [OG]FPR-ProT. Simultaneous fitting of the competitive cubic binding equation to the titrations (Figs. 3A and 6) gave a dissociation constant for SC-(1–325) binding to [OG]FPR-ProT of 17 ± 6 pM with a stoichiometric factor of 1.2 ± 0.3, and a dissociation constant of 72 ± 36 pM and stoichiometric factor of 0.7 ± 0.2 for SC-(1–325) binding to native ProT (Fig. 6). There were no significant differences between the curves generated by the cubic binding equation when the stoichiometric factor was fit (Fig. 6, solid lines) or fixed at 1 (dashed lines). These results were in good agreement with the dissociation constants of 37 ± 1 and 17 ± 6 pM determined for direct binding of SC-(1–325) to [5F]FPR-ProT and [OG]FPR-ProT (Fig. 3) and indicated that native and labeled ProT bound SC-(1–325) with indistinguishable affinity.
FIGURE 6. Competitive binding of SC-(1–325) to native ProT and [OG]FPR-ProT.
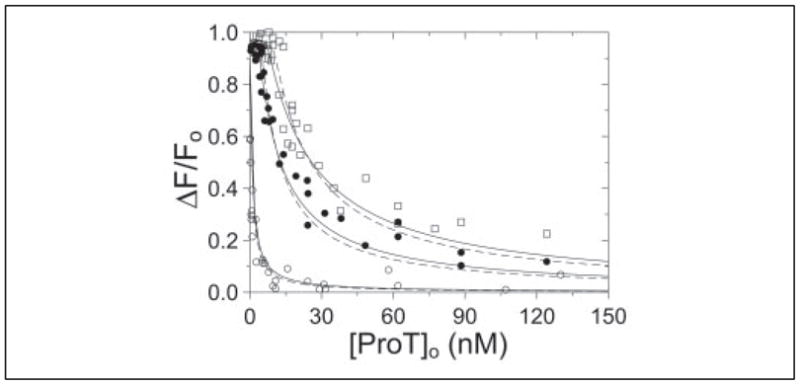
The fractional change in fluorescence (ΔF/Fo) plotted against the total concentration of native ProT ([ProT]o) at 0.5 (○), 5 (●), and 10 (□) nM SC-(1–325). The lines represent the fit by the cubic equation with the parameters given in the text. The dashed lines represent the fit of the same data with n fixed at 1. Fluorescence titrations were performed and analyzed as described under “Experimental Procedures.”
Binding of D2 to (Pro)exosite I on ProT
To determine whether the lack of SC cofactor activity exhibited by D2 (1) was a direct result of a loss of proexosite I affinity, a competitive binding experiment was performed with [5F]Hir-(54–65)( ) used as an exosite I-specific competitor (15). Direct binding of [5F]Hir-(54–65)( ) to proexosite I on ProT (KD = 4.4 ± 1.4 μM) resulted in a maximum fluorescence quench of 18 ± 2%, in good agreement with previous studies (15). Analysis of competitive binding titrations (Fig. 7) of D2 to ProT gave a dissociation constant of 40 ± 90 nM and a 1.0 ± 0.1 mol D2/mol of ProT stoichiometry. These results indicated that D2 folds independently of D1 and that the isolated D2 domain binds to proexosite I on ProT in a similar fashion as SC-(1–325). To our knowledge, this is the highest affinity proexosite I interaction for a protein ligand to date.
FIGURE 7. D2 interaction with proexosite I on ProT.
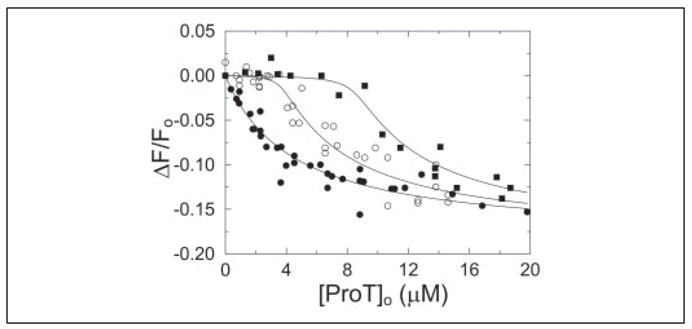
Fractional change in fluorescence (ΔF/Fo) of 50 nM [5F]Hir-(54 – 65)( ) as a function of total ProT concentration ([ProT]o). Titrations were performed in the absence (●) or presence of 4 μM (○) or 9.2 μM (■) D2 (i.e. SC-(147–325)). Competitive binding titrations were performed and analyzed as described under “Experimental Procedures.”
Binding of Isolated Domains of SC-(1–325) to [OG]FPR-ProT
To determine the relative contribution of SC domains to the fluorescence enhancement that resulted from SC-(1–325) binding to [OG]FPR-ProT, emission spectra were collected for [OG]FPR-ProT alone or in the presence of 8 μM D1 or D2 and 0.5 μM SC-(1–325) (Fig. 8A). D1 binding to [OG]FPR-ProT caused a ~10-fold larger fluorescence enhancement than binding of D2, suggesting that interactions of D1 residues with ProT were the primary source of the fluorescence change that resulted from SC-(1–325) binding. Emission spectra were also collected to characterize the concentration dependence of D1 binding to [OG]FPR-ProT (Fig. 8B). The results suggested that D1 binding was necessary and sufficient to cause a fluorescence signal comparable with SC-(1–325) binding with a modest red shift (~5 nm) in the emission maximum. Quantitation of D1 and D2 binding to [OG]FPR-ProT gave dissociation constants of 3.5 ± 1.1 μM and 27 ± 30 nM for D1 and D2 binding labeled ProT with fluorescence enhancements of 130 ± 14 and 10 ± 2%, respectively. These results in combination with those obtained above by [5F]Hir-(54–65)( ) competition indicated that D2 binds [OG]FPR-ProT and native ProT with similar affinity.
FIGURE 8. Interactions of isolated domains of SC-(1–325) with ProT.
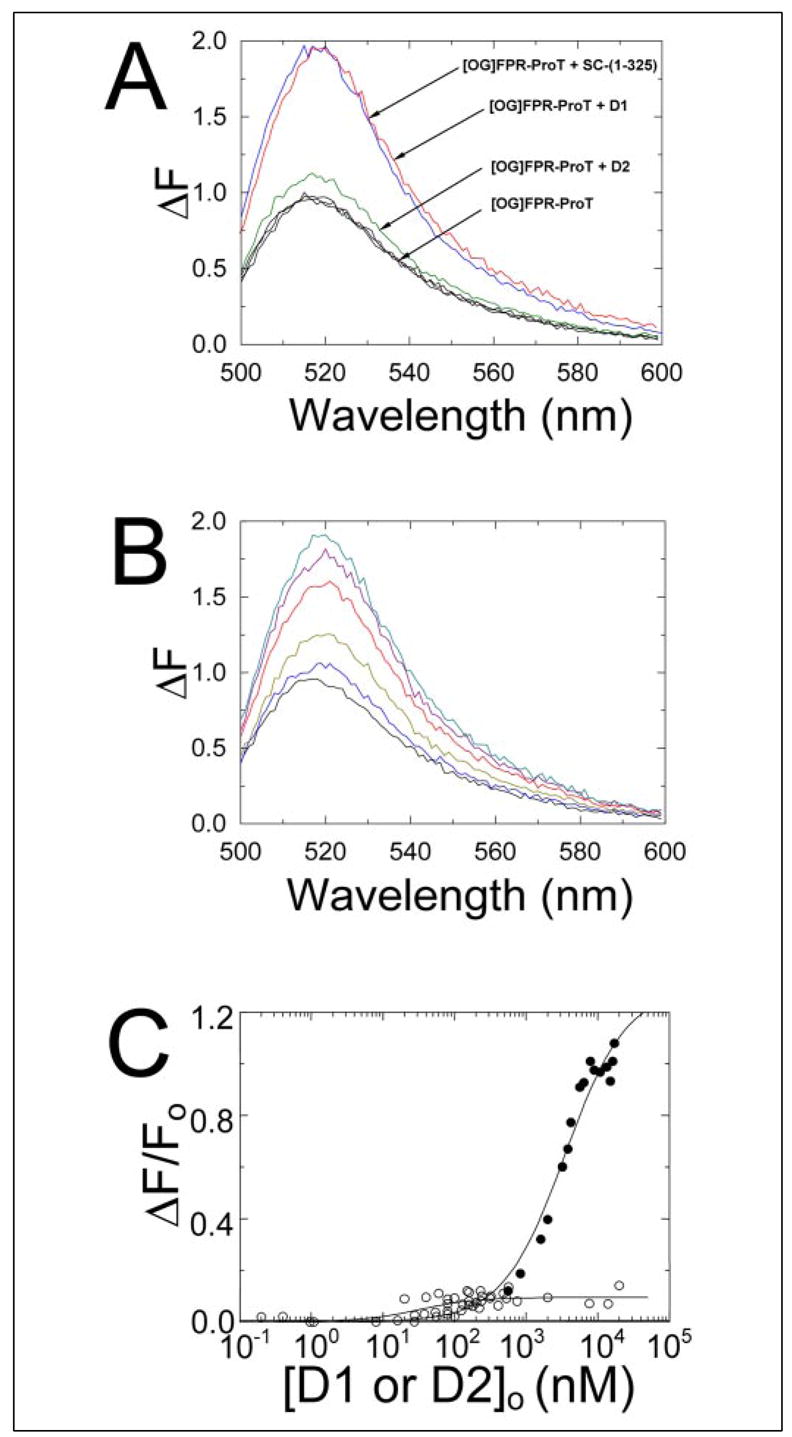
A, fluorescence emission spectra of [OG]FPR-ProT (1 nM) in the absence (black) in triplicate and in the presence of saturating D1 (SC-(1–146); red), D2 (SC-(147–325; green), or SC-(1–325) (blue). B, fluorescence spectral titration of 10 nM [OG]FPR-ProT with D1 at 0 (black), 0.5 (blue), 1.6 (gold), 3.8 (red), 5.6 (purple), and 8.0 μM (green). C, the fractional change in fluorescence (ΔF/Fo) plotted against the total concentration of D1(●) or D2 (○)([D1 or D2]o). The lines represent the fit of the data by the quadratic binding equation. The fluorescence emission spectra and titrations were performed and analyzed as described under “Experimental Procedures.”
Comparison of Fbg Clotting Activity of α-Thrombin and SC-(1–325)·(Pro)thrombin Complexes
Thrombin in the presence of saturating SC-(1–325) or Met-SC-(1–325) had 120% of the Fbg clotting activity of free thrombin, and the complexes with ProT had 78% clotting activity (Table 1). Although thrombin was almost totally inhibited (88%) by Hir-(54–65)( ) binding to exosite I, the peptide had a negligible effect (5%) on the clotting activities of SC-(1–325)·α-thrombin and Met-SC-(1–325)·α-thrombin, and a small (22%) effect on the corresponding ProT complexes.
TABLE 1. Fbg clotting activities of SC-(1–325)·(pro)thrombin complexes.
Mean Fbg clotting activities are listed for SC-(1–325)·(pro)thrombin and Met-SC-(1–325)·(pro)thrombin complexes relative to the activity of free α-thrombin. α-Thrombin and ProT were saturated with 500–750 nM SC-(1–325) or Met-SC-(1–325), and assays were performed in the absence and presence of 20 μM Hir-(54–65)( ) as described under “Experimental Procedures.”
| Enzyme | Relative clotting activity
|
|
|---|---|---|
| No inhibitor | Hir-(54–65)(Equation) | |
| % | ||
| α-Thrombin | 100 | 12 |
| Met-SC-(1–325)·ProT | 78 | 61 |
| Met-SC-(1–325)·α-thrombin | 120 | 114 |
| SC-(1–325)·ProT | 78 | 61 |
| SC-(1–325)·α-thrombin | 119 | 112 |
Effect of SC-(1–325) on the Specificity of (Pro)thrombin for Tripeptide Chromogenic Substrates
To assess differences in substrate specificity of α-thrombin and SC-(1–325)·(pro)thrombin complexes, Michaelis-Menten kinetic parameters were determined for a panel of six tripeptide-pNA substrates. The SC-(1–325)·α-thrombin complex showed a ~2-fold decrease in kcat compared with free α-thrombin for hydrolysis of the tight binding substrates, H-D-Phe-Pip-Arg-pNA, H-D-Ile-Pro-Arg-pNA, and D-Phe-Pro-Arg-pNA (Table 2). Kinetic parameters Km and Ki for product were remarkably similar for α-thrombin, SC-(1–325)·α-thrombin, and SC-(1–325)·ProT complexes for these tight substrates with the exception of a 40-fold higher affinity for the product of D-Phe-Pro-Arg-pNA cleavage for SC-(1–325)·α-thrombin compared with α-thrombin or SC-(1–325)·ProT. To determine whether SC-(1–325) binding affected hydrolysis of substrates based on the P1-P36 cleavage sequences for fibrinopeptides A and B, Ser-Ala-Arg-pNA and Gly-Val-Arg-pNA were examined. SC-(1–325)·α-thrombin complex showed a ~2-fold increase in kcat for both substrates compared with free α-thrombin, whereas there were no consistent changes for SC-(1–325)·ProT complex (Table 2). The combined kinetic data indicated that the SC-(1–325)·α-thrombin complex displayed only small ~2-fold increases or decreases in kcat compared with α-thrombin. In the cases of H-D-Phe-Pip-Arg-pNA and H-D-Ile-Pro-Arg-pNA, titrations of thrombin activity as a function of SC-(1–325) verified the decreases in kcat accompanying tight binding of SC-(1–325) to α-thrombin (not shown). Taken together, these results indicated that SC-(1–325) binding to ProT generated an α-thrombin-like substrate recognition site for tripeptide-pNA substrates, with small but reproducible effects on kcat for hydrolysis of certain substrates, and no significant preference for substrates based on the sequences preceding the fibrinopeptide cleavage sites.
TABLE 2. Effect of SC-(1–325) binding to ProT and α-thrombin on the hydrolysis of tripeptide-pNA substrates.
Michaelis-Menten kinetic parameters determined for the indicated enzyme species and substrates are listed. The parameters were obtained by nonlinear least squares fitting of the Michaelis-Menten equation to the initial rates or fitting of the integrated equation to progress curves for tight binding substrates in the presence of saturating concentrations of SC-(1–325). The experiments were performed and analyzed as described under “Experimental Procedures.”
| Substrate | Enzyme | kcat | Km | Ki | kcat/Km |
|---|---|---|---|---|---|
| s−1 | μM | μM | μM−1 s−1 ×10³ | ||
| D-Phe-Pip-Arg-pNA | α-Thrombin | 77 ± 1 | 2.5 ± 0.2 | 11.5 ± 0.2 | 31,000 ± 1,500 |
| SC-(1–325)·thrombin | 58.1 ± 0.3 | 2.0 ± 0.1 | 9 ± 1 | 29,000 ± 1,000 | |
| SC-(1–325)·ProT | 72.2 ± 0.1 | 1.2 ± 0.1 | 6.2 ± 0.1 | 58,000 ± 300 | |
| D-Ile-Pro-Arg-pNA | α-Thrombin | 52 ± 1.0 | 2.0 ± 0.1 | 100 ± 70 | 26,000 ± 1,000 |
| SC-(1–325)·thrombin | 25.6 ± 0.3 | 1.0 ± 0.1 | 2.5 ± 0.4 | 25,000 ± 1,000 | |
| SC-(1–325)·ProT | 36 ± 1.0 | 2.2 ± 0.4 | 100 ± 180 | 16,000 ± 2,000 | |
| D-Phe-Pro-Arg-pNA | α-Thrombin | 13.8 ± 0.1 | 0.6 ± 0.1 | 6.1 ± 0.3 | 24,700 ± 800 |
| SC-(1–325)·thrombin | 5.6 ± 0.1 | 1.0 ± 0.1 | 5.2 ± 0.6 | 5,100 ± 400 | |
| SC-(1–325)·ProT | 12.5 ± 0.2 | 2.0 ± 0.2 | 3.8 ± 0.5 | 6,400 ± 400 | |
| CH3-Gly-Gly-Arg-pNA | α-Thrombin | 13 ± 1 | 190 ± 30 | 70 ± 10 | |
| SC-(1–325)·thrombin | 17 ± 1 | 150 ± 30 | 110 ± 30 | ||
| SC-(1–325)·ProT | 6.1 ± 0.2 | 126 ± 10 | 48 ± 5 | ||
| Ser-Ala-Arg-pNA | α-Thrombin | 60 ± 10 | 980 ± 360 | 60 ± 20 | |
| SC-(1–325)·thrombin | 120 ± 10 | 750 ± 130 | 160 ± 30 | ||
| SC-(1–325)·ProT | 63 ± 5 | 2100 ± 300 | 30 ± 20 | ||
| Gly-Val-Arg-pNA | α-Thrombin | 146 ± 4 | 1660 ± 70 | 88 ± 5 | |
| SC-(1–325)·thrombin | 330 ± 10 | 840 ± 60 | 390 ± 40 | ||
| SC-(1–325)·ProT | 62 ± 3 | 900 ± 100 | 69 ± 8 |
DISCUSSION
Reversible activation of the ProT catalytic site induced by SC-(1–325) allowed the development of novel, active site-specifically labeled ProT analogs as tools for quantifying SC interactions for the first time. Various thiol-reactive fluorescence probes were covalently linked to the catalytic Ser195 and His57 residues of the SC-(1–325)·ProT complex by a thioester derivative of FPR-CH2Cl. Characterization of the labeling reactions demonstrated that probe incorporation was covalent, active site-specific, and stoichiometric. Screening of 10 fluorescent ProT analogs identified the best quantitative reporters of SC-(1–325) binding. Previous studies indicated that SC bound to ProT with a 1:1 stoichiometry (1, 4, 43, 44), but because of the apparent high affinity of the interaction, it was not possible to obtain accurate estimates of the dissociation constant (3). The results for SC-(1–325) binding to [OG]FPR-ProT and [5F]FPR-ProT studied over a 500- or 1300-fold range of protein concentration, respectively, support the finding that SC-(1–325) binds to 0.95–0.96 sites on labeled ProT with a KD of 17–37 pM.
Stability studies of mixtures of ProT and SC previously found that these mixtures converted Pro to Pre 1, releasing fragment 1 (3, 28, 45). Our studies confirm that Pre 1 is generated initially, but in addition demonstrate that Pre 2′ is generated more slowly. Reactions of ProT with saturating concentrations of SC-(1–325) resulted in conversion of ProT to Pre 1 and Pre 2′ by cleavage of the two thrombin-sensitive bonds at Arg155-Ser156 and Arg284-Thr285 (ProT numbering), respectively. Pre 2′ generation as a result of SC-(1–325)·ProT binding has not been previously reported. At saturating levels of SC-(1–325), the SC-(1–325)·native and labeled ProT complexes were completely cleaved, suggesting that the active complex catalyzed cleavage of other complexes. The mechanism underlying this observation is not known, but conversion of ProT to Pre 1 and Pre 2′ may play a role in the mechanism of fibrin formation by SC. Although sedimentation equilibrium studies indicate that the SC-(1–325)·Pre 2 and SC-(1–325)·α-thrombin complexes were not detectably dimeric under these experimental conditions (29), there is apparently some interaction between SC-(1–325)·ProT complexes.
Because of the complex nature of ProT cleavage at saturating concentrations of SC-(1–325), competitive binding of native and labeled ProT was assessed under conditions of subsaturating concentrations of SC-(1–325) and within a time window that minimized proteolysis. SC-(1–325) bound to native ProT with KD of 72 ± 36 pM and stoichiometry of 0.7 ± 0.2 mol SC-(1–325)/mol ProT. These results were in good agreement with the KD of 17 ± 6 pM determined for the direct binding of SC-(1–325) to the [OG]FPR-ProT analog and KD of 37 ± 1 pM determined for [5F]FPR-ProT. Although there is significant experimental error in the determination of such high affinities, the results demonstrated that the ProT derivatives reported quantitatively indistinguishable binding of SC-(1–325) to labeled and native ProT. This indicates that the presence of the probe and the tripeptide inhibitor in the active site had a ≤2-fold effect on SC-(1–325) binding affinity.
Contrary to previous estimates of the Fbg clotting activity of SC·thrombin, SC·Pre 1, and SC·ProT complexes ranging from 20 to 90% (3, 46), we found no significant difference in the Fbg clotting activity of SC-(1–325) complexes with ProT or thrombin compared with free α-thrombin. Occupancy of exosite I by D2 (1) imparted resistance of SC-(1–325)·(pro)thrombin complexes to inhibition by the exosite I-specific ligand, Hir-(54–65)( ). Chromogenic substrate kinetics results indicate that binding of SC-(1–325) to ProT induces expression of a functional active site with similar P1-P3 substrate specificity as thrombin alone and no detectable preference for cleavage of peptides corresponding to P1-P3 of fibrinopeptides A and B.
The results presented here also assessed the binding of D2 to (pro)exosite I on ProT. Our previous studies indicated that D2 binding did not result in conformational activation of ProT at concentrations up to 43 μM (1). A possible interpretation of these results could have been that D2 does not fold independently of D1, resulting in the loss of binding affinity. Another interpretation could have been that D2 binds to a nonproductive site on the zymogen, eliminating its potential ProT activation ability, similar to a result seen for the isolated α-domain of SK binding to μ-plasminogen (the catalytic domain of the plasminogen zymogen (47)). The results indicate that D2 binds to (pro)exosite I on ProT with rather high affinity but does not induce detectable ProT activation. This finding is contrary to results reported previously for a chymotryptic fragment of SC containing D2, which indicated that the fragment activated ProT with an apparent KD of 120 nM (43).
Fluorescence measurements with the isolated domains of SC-(1–325) allowed us to dissect further their individual contribution to the fluorescence enhancement that accompanies SC-(1–325) binding. The fluorescence enhancement accompanying D1 binding (~130%) is primarily responsible for the enhancement seen with SC-(1–325) (98%) binding [OG]FPR-ProT, whereas D2 makes only a small contribution. The affinity of D1 binding to labeled ProT was 3.5 ± 1.1 μM, whereas the affinity of D1 determined for native ProT activation was ~4.5-fold higher (780 ± 150 nM). By contrast, the affinity of D2 binding to [OG]FPR-ProT was 27 ± 30 nM, similar to the affinity determined for native ProT obtained by competitive displacement of [5F]Hir-(54–65)( ) (40 ± 90 nM). The presence of the probe thus decreased the affinity of D1 binding while having no detectable effect on the D2 interaction. On this basis, the change in binding energy for D1 caused by the presence of the probe is ~1 kcal/mol. This represents a small fraction of the total binding energy of SC-(1–325) for labeled and native ProT, both about −14 kcal/mol, and is within the experimental error of the determinations. Having estimates of the affinity of SC-(1–325) and the separate domains for ProT allows estimation of the free energy advantage or disadvantage for binding of the two-domain fragment compared with the individual domains, represented by the coupling free energy (48). The estimated coupling free energies, for the labeled and native ProT interactions, are −4.5 and −3.5 kcal/mol. These negative values indicate that, surprisingly, binding of the two-domain SC-(1–325) fragment is less favorable than the isolated domains. The source of this effect is not clear from the present results, and further studies will be required to address this question.
The crystal structures of the SC-(1–325)·(pre)thrombin complexes labeled with p-hydroxymercuribenzoate attached to the thioacetyl-peptide chloromethyl ketone provide some insight into the sources of the diverse fluorescence changes seen with different probes. In the SC-(1–325)·(pre)thrombin complexes, the probe probably binds into the shallow depression formed by the side chains of thrombin residues Arg221–Glu146 and Glu217, together with the SCAsp106 side chain (and maybe SCThr104 and SCGlu107) of the cognate SC D1. Before SC-(1–325) binding, the probe could well make contact with the side chain of Trp148 of thrombin, which in some previous FPR-thrombin structures is defined (11–13, 49) but which in several other thrombin structures is (together with the whole 148 loop) flexible. The 148 loop in the SC-(1–325)·(pre)thrombin complexes is trapped in the SC-(1–325) groove of D1, and the mercury ion is only 2.9 Å away from one of both SCAsp106 carboxylate oxygens, thus in ion bond distance. From these observations and the weakening of the affinity for D1 by the presence of the probe, it is apparent that direct contact of SC-(1–325) with the probe and/or the possible interaction and movement of the 148 loop likely account for the fluorescence changes observed for the fluorescein derivatives and some of the other probes. It is important to note that this is not the case for all of the probes, however, because, for example, [ANS]FPR-ProT shows large spectral changes accompanying proteolytic activation to thrombin, whereas the fluorescein-ProT derivative does not.7 A very similar probe-specific effect is observed for active site fluorescein-labeled plasminogen, which reports SK binding but not activation to plasmin, whereas the ANS derivative reports proteolytic activation and SK binding with similar, large spectral changes (35).8 This effect is not limited to cofactor-zymogen binding, because interactions for which arrays of probes have been examined, including SK with plasmin (37) and thrombin with exosite I and II ligands (41, 50), show similarly diverse behavior. For the interactions studied thus far with multiple probes, there is no significant correlation of their signaling with bulk solution properties of the probes, such as the dependence on dielectric constant. The highly structured microenvironment of the probes and the structures of the probes themselves appear to place them in slightly different locations, resulting in idiosyncratic fluorescence changes on SC or SK binding to their respective zymogens, which allows them to report different molecular events. This is evident by the results for the highly polarity-sensitive probes, ACR and BAD, which showed a large fluorescence enhancement and essentially no change, respectively, accompanying SC-(1–325) binding. These probes differ only in an additional methylene group in the linker connecting the probe to the thiol group of the inhibitor peptide. On this basis, it can be expected that subtle changes in the probe microenvironment, established in part by the probe itself, the intrinsic spectral properties of the probes, and the reporting of different structural changes mediated by direct contact and transmitted by conformational changes dictate the observed spectral changes for various interactions. At present, there is no clear basis from the structures or spectral properties of the probes to support a detailed explanation of the differences observed or their predictability.
Development of fluorescent ProT analogs enabled quantitative analysis of SC-(1–325) interactions reported by changes in probe fluorescence intensity because of changes in the microenvironment of the active site-bound probes. These probe fluorescence changes showed a complex and sensitive dependence on probe structure as well as spectral properties. The versatility of the labeling approach allows selecting the best derivatives for characterizing interactions of ProT by fluorescence intensity, resonance energy transfer, and anisotropy changes. Although the purpose here was to characterize SC-(1–325) interactions, [ANS]FPR-ProT and likely other fluorescent derivatives report activation of ProT by the factor Xa·factor Va, prothrombinase complex,7 which should enable fluorescence studies of prothrombinase complex interactions and prothrombin activation. Finally, the use of expression of a unique thiol group as the basis for active site labeling allows specific labeling with other types of spectroscopic probes, heavy atom labeling (1), active site-specific immobilization (18), and affinity ligand labeling. These derivatives should provide valuable new tools for investigating ProT interactions and the mechanism of activation of ProT by both physiologic and pathologic activators.
Acknowledgments
We thank Dr. Ingrid Verhamme for assistance in the analysis of the kinetic data and comments on the manuscript and Elena Consacro and Sarah Stuart for performing the clotting assays.
Footnotes
This work was supported by National Institutes of Health Grants HL038779 and HL071544 (to P. E. B.) and by the SFB 469 of the Deutsche Forschungsgemeinschaft and the Fonds der Chemischen Industrie (to W. B.).
The abbreviations used are: SC, staphylocoagulase; SC-(1–325), staphylocoagulase fragment, residues 1–325; D1, domain 1 of SC, residues 1–146; D2, domain 2 of SC, residues 147–325; Fbg, fibrinogen; SK, streptokinase; FPR-CH2Cl, D-Phe-Pro-Arg-CH2Cl; ATA-FPR-CH2Cl, Nα-[(acetylthio)acetyl]-(D-Phe)-Pro-Arg-CH2Cl; ANS, 2-((4′-iodoacetamido)anilino)naphthalene-6-sulfonic acid; ACR, 6- acryloyl-2-dimethylam-inonaphthalene; BAD, 6-bromoacetyl-2-dimethyl-aminonaphthalene; AF350, the sulfonated coumarin derivative called AlexaFluor 350 C5 maleimide; BD, BODIPY® 507/545 iodoacetamide or N-(4,4-difluoro-1,3,5,7- tetramethyl-4-bora-3a,4a-diaza-s-indacene-2-yl)iodoacetamide; TMR, tetramethylrhodamine-5-iodoacetamide dihydroiodide; 4′F, 4′-(iodoacetamido)fluorescein; 5F, 5-(iodoacetamido)fluorescein; OG, Oregon Green 488 iodoacetamide or 5- (and 6)-iodoacetamido-2′,7′-difluorofluorescein; pNA, p-nitroaniline; AEBSF, 4-(2-aminoethyl)-benzenesulfonyl fluoride hydrochloride; ProT, prothrombin; Pre 1, the product of cleavage of ProT at Arg155-Ser156; Pre 2, the product of cleavage of ProT at Arg271-Thr272; Pre 2′, the product of cleavage of ProT at Arg284-Thr285; DAN, dansylaziridine.
I. M. A. Verhamme, P. Panizzi, and P. E. Bock, unpublished results.
Fluorescent analogs of ProT are represented by: [probe abbreviation]connecting thioester peptide chloromethyl ketone-ProT.
Schechter-Berger (51) notation referring to the residues of a substrate (from the N-terminal end) as …-P4-P3-P2-P1-P1′-P2′- … with the scissile bond at P1-P1′, which interact with complementary specificity sites -S4-S3-S2-S1-S1′-S2′ … on the proteinase.
P. Panizzi and P. E. Bock, unpublished observations.
P. E. Bock and P. D. Boxrud, unpublished observations.
References
- 1.Friedrich R, Panizzi P, Fuentes-Prior P, Richter K, Verhamme I, Anderson PJ, Kawabata S, Huber R, Bode W, Bock PE. Nature. 2003;425:535–539. doi: 10.1038/nature01962. [DOI] [PubMed] [Google Scholar]
- 2.Tager M, Drummond MC. Ann N Y Acad Sci. 1965;128:92–111. doi: 10.1111/j.1749-6632.1965.tb11632.x. [DOI] [PubMed] [Google Scholar]
- 3.Hendrix H, Lindhout T, Mertens K, Engels W, Hemker HC. J Biol Chem. 1983;258:3637–3644. [PubMed] [Google Scholar]
- 4.Hemker HC, Bas BM, Muller AD. Biochim Biophys Acta. 1975;379:180–188. doi: 10.1016/0005-2795(75)90020-3. [DOI] [PubMed] [Google Scholar]
- 5.Phonimdaeng P, O’Reilly M, Nowlan P, Bramley AJ, Foster TJ. Mol Microbiol. 1990;4:393–404. doi: 10.1111/j.1365-2958.1990.tb00606.x. [DOI] [PubMed] [Google Scholar]
- 6.Heilmann C, Herrmann M, Kehrel BE, Peters G. J Infect Dis. 2002;186:32–39. doi: 10.1086/341081. [DOI] [PubMed] [Google Scholar]
- 7.Bode W, Huber R. FEBS Lett. 1976;68:231–236. doi: 10.1016/0014-5793(76)80443-7. [DOI] [PMC free article] [PubMed] [Google Scholar]
- 8.Sawai TTK, Yanagihara K, Yamamoto Y, Kaku M, Hirakata Y, Koga H, Tashiro T, Kohno S. Infect Immun. 1997;65:466–471. doi: 10.1128/iai.65.2.466-471.1997. [DOI] [PMC free article] [PubMed] [Google Scholar]
- 9.Korzeniowski OM, Kaye D. In: Heart Disease: A Textbook of Cardiovascular Medicine. 4. Braunwald E, editor. W. B. Saunders; Philadelphia, PA: 1992. pp. 1078–1105. [Google Scholar]
- 10.Phonimdaeng P, O’Reilly M, O’Toole PW, Foster TJ. J Gen Microbiol. 1988;134:75–83. doi: 10.1099/00221287-134-1-75. [DOI] [PubMed] [Google Scholar]
- 11.Bode W, Mayr I, Baumann U, Huber R, Stone SR, Hofsteenge J. EMBO J. 1989;8:3467–3475. doi: 10.1002/j.1460-2075.1989.tb08511.x. [DOI] [PMC free article] [PubMed] [Google Scholar]
- 12.Bode W, Turk D, Karshikov A. Protein Sci. 1992;1:426–471. doi: 10.1002/pro.5560010402. [DOI] [PMC free article] [PubMed] [Google Scholar]
- 13.Bode W, Huber R, Rydel T, Tulinsky A. In: Thrombin Structure and Function. Berliner LJ, editor. Plenum Press; New York: 1992. [Google Scholar]
- 14.Anderson PJ, Nesset A, Dharmawardana KR, Bock PE. J Biol Chem. 2000;275:16435–16442. doi: 10.1074/jbc.M001255200. [DOI] [PubMed] [Google Scholar]
- 15.Anderson PJ, Nesset A, Dharmawardana KR, Bock PE. J Biol Chem. 2000;275:16428–16434. doi: 10.1074/jbc.M001254200. [DOI] [PubMed] [Google Scholar]
- 16.Esmon CT, Lollar P. J Biol Chem. 1996;271:13882–13887. doi: 10.1074/jbc.271.23.13882. [DOI] [PubMed] [Google Scholar]
- 17.Myles T, Yun TH, Hall SW, Leung LL. J Biol Chem. 2001;276:25143–25149. doi: 10.1074/jbc.M011324200. [DOI] [PubMed] [Google Scholar]
- 18.Dharmawardana KR, Bock PE. Biochemistry. 1998;37:13143–13152. doi: 10.1021/bi9812165. [DOI] [PubMed] [Google Scholar]
- 19.Naski MC, Fenton JW, II, Maraganore JM, Olson ST, Shafer JA. J Biol Chem. 1990;265:13484–13489. [PubMed] [Google Scholar]
- 20.Jacques SL, LeMasurier M, Sheridan PJ, Seeley SK, Kuliopulos A. J Biol Chem. 2000;275:40671–40678. doi: 10.1074/jbc.M004544200. [DOI] [PubMed] [Google Scholar]
- 21.Liu LW, Vu TK, Esmon CT, Coughlin SR. J Biol Chem. 1991;266:16977–16980. [PubMed] [Google Scholar]
- 22.Rydel TJ, Ravichandran KG, Tulinsky A, Bode W, Huber R, Roitsch C, Fenton JW., II Science. 1990;249:277–280. doi: 10.1126/science.2374926. [DOI] [PubMed] [Google Scholar]
- 23.Van Deerlin VM, Tollefsen DM. J Biol Chem. 1991;266:20223–20231. [PubMed] [Google Scholar]
- 24.Rogers SJ, Pratt CW, Whinna HC, Church FC. J Biol Chem. 1992;267:3613–3617. [PubMed] [Google Scholar]
- 25.Ye J, Liu LW, Esmon CT, Johnson AE. J Biol Chem. 1992;267:11023–11028. [PubMed] [Google Scholar]
- 26.Naski MC, Shafer JA. J Biol Chem. 1991;266:13003–13010. [PubMed] [Google Scholar]
- 27.Soulier JP, Prou-Wartelle O. Thromb Diath Haemorrh. 1967;17:321–334. [PubMed] [Google Scholar]
- 28.Kawabata S, Morita T, Iwanaga S, Igarashi H. J Biochem (Tokyo) 1985;97:1073–1078. doi: 10.1093/oxfordjournals.jbchem.a135150. [DOI] [PubMed] [Google Scholar]
- 29.Panizzi P, Friedrich R, Fuentes-Prior P, Richter K, Bock PE, Bode W. J Biol Chem. 2005;281:1179–1187. doi: 10.1074/jbc.M507956200. [DOI] [PMC free article] [PubMed] [Google Scholar]
- 30.Bock PE. J Biol Chem. 1992;267:14963–14973. [PubMed] [Google Scholar]
- 31.Mann KG, Elion J, Butkowski RJ, Downing M, Nesheim ME. Methods Enzymol. 1981;80:286–302. doi: 10.1016/s0076-6879(81)80025-0. [DOI] [PubMed] [Google Scholar]
- 32.Fenton JW, II, Fasco MJ, Stackrow AB. J Biol Chem. 1977;252:3587–3598. [PubMed] [Google Scholar]
- 33.Pace CN, Vajdos F, Fee L, Grimsley G, Gray T. Protein Sci. 1995;4:2411–2423. doi: 10.1002/pro.5560041120. [DOI] [PMC free article] [PubMed] [Google Scholar]
- 34.Bock PE. Methods Enzymol. 1993;222:478–503. doi: 10.1016/0076-6879(93)22030-j. [DOI] [PubMed] [Google Scholar]
- 35.Bock PE, Day DE, Verhamme IM, Bernardo MM, Olson ST, Shore JD. J Biol Chem. 1996;271:1072–1080. doi: 10.1074/jbc.271.2.1072. [DOI] [PubMed] [Google Scholar]
- 36.Hogg PJ, Jackson CM, Labanowski JK, Bock PE. J Biol Chem. 1996;271:26088–26095. doi: 10.1074/jbc.271.42.26088. [DOI] [PubMed] [Google Scholar]
- 37.Boxrud PD, Fay WP, Bock PE. J Biol Chem. 2000;275:14579–14589. doi: 10.1074/jbc.275.19.14579. [DOI] [PubMed] [Google Scholar]
- 38.Lindahl P, Raub-Segall E, Olson ST, Björk I. Biochem J. 1991;276:387–394. doi: 10.1042/bj2760387. [DOI] [PMC free article] [PubMed] [Google Scholar]
- 39.Olson ST, Bock PE, Sheffer R. Arch Biochem Biophys. 1991;286:533–545. doi: 10.1016/0003-9861(91)90076-u. [DOI] [PubMed] [Google Scholar]
- 40.Fenton JW, II, Fasco MJ. Thromb Res. 1974;4:809–817. doi: 10.1016/0049-3848(74)90024-3. [DOI] [PubMed] [Google Scholar]
- 41.Bock PE. J Biol Chem. 1992;267:14974–14981. [PubMed] [Google Scholar]
- 42.Butkowski RJ, Elion J, Downing MR, Mann KG. J Biol Chem. 1977;252:4942–4957. [PubMed] [Google Scholar]
- 43.Kawabata S, Morita T, Miyata T, Iwanaga S, Igarashi H. J Biol Chem. 1986;261:1427–1433. [PubMed] [Google Scholar]
- 44.Kawabata S, Miyata T, Morita T, Iwanaga S, Igarashi H. J Biol Chem. 1986;261:527–531. [PubMed] [Google Scholar]
- 45.Kawabata S, Morita T, Iwanaga S, Igarashi H. J Biochem (Tokyo) 1985;98:1603–1614. doi: 10.1093/oxfordjournals.jbchem.a135430. [DOI] [PubMed] [Google Scholar]
- 46.Kawabata S, Morita T, Miyata T, Kaida S, Iwanaga S, Igarashi H. J Protein Chem. 1987;6:17–32. [Google Scholar]
- 47.Wang X, Lin X, Loy JA, Tang J, Zhang XC. Science. 1998;281:1662–1665. doi: 10.1126/science.281.5383.1662. [DOI] [PubMed] [Google Scholar]
- 48.Jencks W. Proc Natl Acad Sci U S A. 1981;78:4046–4050. doi: 10.1073/pnas.78.7.4046. [DOI] [PMC free article] [PubMed] [Google Scholar]
- 49.Pineda AO, Chen ZW, Caccia S, Cantwell AM, Savvides SN, Waksman G, Mathews FS, Di Cera E. J Biol Chem. 2004;279:39824–39828. doi: 10.1074/jbc.M407272200. [DOI] [PubMed] [Google Scholar]
- 50.Bock PE, Olson ST, Björk I. J Biol Chem. 1997;272:19837–19845. doi: 10.1074/jbc.272.32.19837. [DOI] [PubMed] [Google Scholar]
- 51.Schechter I, Berger A. Biochem Biophys Res Commun. 1967;27:157–162. doi: 10.1016/s0006-291x(67)80055-x. [DOI] [PubMed] [Google Scholar]