Abstract
Giardia intestinalis is a ubiquitous intestinal protozoan parasite and has been proposed to represent the earliest diverging lineage of extant eukaryotes. Despite the importance of Giardia as a model organism, research on Giardia has been hampered by an inability to achieve cell cycle synchrony for in vitro cultures. This report details successful methods for attaining cell cycle synchrony in Giardia cultures. The research presented here demonstrates reversible cell cycle arrest in G1/S and G2/M with aphidicolin and nocodazole, respectively. Following synchronization, cells were able to recover completely from drug treatment and remained viable and maintained synchronous growth for 6 h. These techniques were used to synchronize Giardia cultures to increase the percentages of mitotic spindles in the cultures. This method of synchronization will enhance our ability to study cell cycle-dependent processes in G. intestinalis.
Giardia intestinalis is a ubiquitous intestinal protozoan parasite causing disease in humans and animals worldwide (1, 11). In developing countries, diarrheal disease is responsible for 80% of the deaths of children under 2 years of age (21), and Giardia is one of the major causes of this condition. As a diplomonad, Giardia has been proposed to represent the earliest diverging lineage of extant eukaryotes, based on single rRNA and single and/or concatenated protein phylogenies developed by considering an archaeal out-group (2, 3, 5, 15, 23), making it a valuable organism for studying the evolution of biological processes in all eukaryotes. Characteristic of the order Diplomonadida, Giardia trophozoites contain two nuclei that remain separate during mitosis, with each daughter cell inheriting one copy of each parental nucleus (19). The trophozoite form, which attaches to the small intestine of the host, has a tetraploid (4N) DNA content in G1 since each nucleus is 2N (4). Following a round of DNA synthesis, each G2 nucleus is 4N, making the cell 8N. According to previous flow cytometry results, actively growing Giardia cultures spend the majority of the cell cycle in the G2/M phase and significantly less time in the G1 and S phases (4); in contrast, many tissue culture cells display a lengthy G1 phase. Until recently, an inability to synchronize in vitro Giardia cultures to any degree has severely hampered the ability of researchers to study cell cycle-dependent processes (16, 20).
This work demonstrates successful cell cycle arrest by using nocodazole, a microtubule-destabilizing drug that leads to the depolymerization of spindle microtubules in Giardia (6, 20). A brief nocodazole treatment resulted in cells arrested early in mitosis or at the end of G2, presumably by the activation of a mitotic spindle checkpoint (22). G2 arrest using nocodazole was combined with G1 arrest using aphidicolin, a drug that presumably acts through the inhibition of polymerase-dependent DNA synthesis (8, 12, 14, 25). By combining these two treatments, we were able to effectively synchronize Giardia cultures while maintaining cell viability. These synchronization methods were used to enrich cultures with mitotic spindles at the M phase. Moreover, these methods will be a valuable tool for studying other aspects of Giardia biology such as encystation, the time in the life cycle when the trophozoite transforms into an infectious cyst.
MATERIALS AND METHODS
Culture conditions and growth curves.
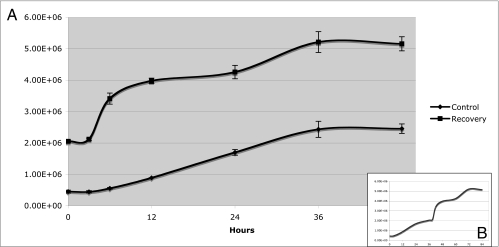
G. intestinalis trophozoites, strain WBC6, ATCC 50803, were grown in modified TYI-S-33 medium with adult bovine bile (catalog no. B9433; Sigma) (10). Cultures were maintained in 15-ml plastic screw-top tubes (Fisher Scientific) at 37°C. Growth curves were constructed by counting cells with a hemacytometer at the time points specified in Fig. 4. Prior to counting, the cells were placed on ice for 15 min to detach the cells.
FIG. 4.
Growth curves. (A) A growth curve for control cultures starting after the cultures were split (0 h, control curve) and continuing over 48 h was generated. After 36 h of growth, the nocodazole and aphidicolin treatments were performed. Fresh growth medium was added (0 h, recovery curve), and growth was tracked during recovery for an additional 48 h to generate the recovery curve. In panel B, both control and recovery data were graphed in a linear fashion to represent the data as one continuous curve.
Synchronization.
For synchronization studies, confluent cultures containing approximately 2.5 × 10⁶ cells/ml were iced for 20 min to detach cells. The experiments were conducted in 8-ml polystyrene tubes (Falcon tube no. 35-2027). The appropriate number of 8-ml cultures were started by adding ∼2.5 × 10⁶ cells to a final volume of 6 ml of modified TYI-S-33 medium (10) for a final concentration of ∼4.15 × 10⁶ cells/ml, and the cultures were incubated for anywhere from 24 to 36 h until they were approximately 80% or less confluent and were in log phase of growth. The old medium containing detached and dead cells was decanted and replaced with fresh 37°C growth medium and 100 nM nocodazole (catalog no. M1404; Sigma), and the cultures were incubated at 37°C. After 2 h the medium containing the nocodazole, as well as any unattached cells, was again decanted and replaced with fresh 37°C growth medium and 6 μM aphidicolin (catalog no. 10797; Fluka). The nocodazole and aphidicolin were both dissolved in dimethyl sulfoxide (DMSO) and kept at −20°C. Control cultures received an amount of DMSO equivalent to the amount of the nocodazole- and aphidicolin-DMSO solutions. After 6 h the medium was decanted and replaced with fresh 37°C growth medium for the prescribed recovery times.
Cell fixation and preparation for flow cytometry analysis.
Following the individual treatments (i.e., nocodazole treatment, aphidicolin treatment, and recovery), the cultures were placed on ice for 15 to 20 min to detach cells. The cells were pelleted by centrifugation at 800 × g for 5 min, the supernatant was aspirated, and the pellet was washed twice in 2 ml of HEPES-buffered saline (150 mM NaCl, 5 mM KCl, 1 mM MgSO4, 10 mM HEPES, pH 7.4). For fixation, the cells were resuspended in 300 μl of HEPES-buffered saline and 700 μl of ice-cold 100% EtOH was added drop by drop while the cell suspension was subjected to a gentle vortex. At this point, the cells could be stored at 4°C indefinitely. The cultures were then centrifuged, the pellet was rinsed in 50 mM Na citrate (Sigma) and resuspended in a 0.5-ml volume of 50 mM Na citrate containing fresh RNase A at 0.1 mg/ml, and the suspension was incubated overnight at 4°C. Directly prior to flow cytometry analysis, a 0.5-ml volume of 50 mM Na citrate containing 10 μM Sytox green (Sigma) was added for a final Sytox green concentration of 5 μM. Flow cytometry was performed on a Beckman Coulter EPICS XL flow cytometer, and the data were analyzed with FlowJo software (Tree Star Inc., Ashland, OR).
Viability assay.
The viability of the control and treated Giardia cultures was determined using the adsorption indicator phloxine B (catalog no. 28550; Fluka). Samples of cultures were stained to a final concentration of 2.5 g of pholxine B/liter, and cells were counted on a light microscope. Dead cells stain bright pink, while live cells remain clear.
Immunolocalization.
Trophozoites were fixed in the culture tubes with 1% paraformaldehyde for 10 min, centrifuged, washed with PEM buffer {100 mM PIPES [piperazine-N,N′-bis(2-ethanesulfonic acid)], 1 mM EGTA, 0.1 mM MgSO4}, and attached to poly-l-lysine-coated coverslips. Cells were permeabilized in 0.1% Triton X-100 for 15 min. Coverslips were washed with PEM buffer and blocked for 30 min in PEMBALG (PEM with 1% bovine serum albumin, 0.1% sodium azide, 100 mM lysine, and 0.5% cold-water fish skin gelatin [Sigma, St Louis, MO]). Microtubules were visualized by incubating coverslips with the monoclonal α-tubulin antibody TAT1 (26) diluted 1:75 in PEMBALG at room temperature overnight. The coverslips were then rinsed and incubated with Alexa Fluor 555 (Molecular Probes, Eugene, OR) diluted 1:50 in PEMBALG at room temperature for 2 h. The coverslips were then rinsed in PEMBALG and PEM before being mounted with ProLong AntiFade with DAPI (4′,6′-diamidino-2-phenylindole; Molecular Probes).
Fluorescence deconvolution microscopy.
Images were collected using SoftWorX image acquisition software (Applied Precision, Issaquah, WA) and an Olympus IX70 wide-field inverted fluorescence microscope with an Olympus Uplan apochromat 100× oil-immersion objective (numerical aperture, 1.35) and a Photometrics charge-coupled device CH350 camera cooled to −35°C (Roper Scientific, Tuscon, AZ). Serial sections were acquired at 0.2-μm intervals, and data stacks were deconvolved using the SoftWorX deconvolution software. For printing purposes, two-dimensional projections were created from the three-dimensional data sets by using the DeltaVision image analysis software (Applied Precision).
RESULTS
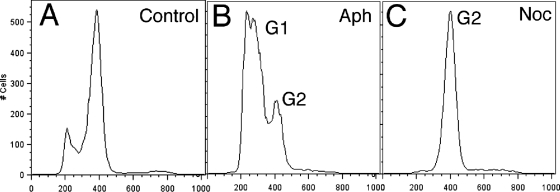
Figure 1A shows flow cytometry-determined DNA distributions for an untreated control population of Giardia cells, with two prominent peaks. Based on previous flow cytometry results (4), we interpret the first peak to represent cells in G1/S (4N) and the second to represent cells in G2/M (8N). Aphidicolin is a common synchronizing agent for eukaryotic cells that acts by blocking the cell cycle in the G1/S phase (18). Initial attempts at synchronizing Giardia cultures in our laboratory indicated that exposure to the high concentrations of aphidicolin required to effectively attain arrest at G1/S caused cell death shortly after the removal of the drug (data not shown). We determined that the highest concentration of aphidicolin that Giardia cultures could tolerate was 6 μM, and 6 h was the optimal incubation period, allowing the cells to remain viable. Figure 1B shows the profile of a culture following the 6-h, 6 μM aphidicolin treatment, with the accumulation of cells in G1/S; however, a significant number of cells remained in G2 (Fig. 1B). In initial experiments using nocodazole, a microtubule-destabilizing drug, cells were arrested in G2; however, the removal of the drug did not lead to a noticeable synchronization of the cell cycle. In an attempt to produce an effective synchronization protocol, we developed a two-step procedure combining both drugs. The addition of 100 nM nocodazole following a 6-h, 6 μM aphidicolin treatment resulted in efficient cell arrest, with close to 100% of the cells arresting in G2 (Fig. 1C). In order to arrest cells at G1/S and avoid the possibility of an irreversible disruption of microtubule arrays by nocodazole, we reversed the order of the treatments, resulting in arrest in G2 followed by G1/S. The addition of 100 nM nocodazole to a log-phase culture for 2 h resulted in cell cycle arrest, eliminating the first peak from the control (Fig. 2A) and causing all cells to accumulate in the stage represented by the second peak, identified as G2 (Fig. 2B). This drug concentration leads to the depolymerization of spindle microtubules (20), arresting cells early in mitosis or at the end of G2 presumably by the activation of a mitotic spindle checkpoint (22). Upon the removal of nocodazole-containing medium and the addition of fresh medium containing 6 μM aphidicolin for 6 h, the cells arrested at the position of the first peak (Fig. 2C). The nocodazole treatment could then be repeated, and the cells arrested in G2/M again (Fig. 2D). Using drugs to reversibly arrest the cell cycle and toggle between G2 and G1 and back to G2 while monitoring changes in DNA contents in the cell population confirmed the identities of the respective G1 and G2 peaks as described by Bernander et al. (4).
FIG. 1.
Arrest of Giardia cell cycle with aphidicolin and nocodazole. (A and B) Subjecting a control culture with a 5:1 ratio of G2 to G1 cells (A) to treatment with 6 μM aphidicolin (Aph) for 6 h results in very loose cell cycle arrest in G1, with a significant number of cells in G2 (B). (C) After the removal of aphidicolin, cultures were exposed to 100 nM nocodazole (Noc) for 2 h, resulting in very tight G2 arrest.
FIG. 2.
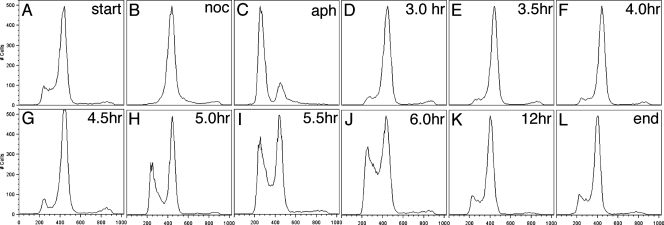
Arrest of Giardia cell cycle with nocodazole and aphidicolin. (A) Starting culture with a 5:1 ratio of G2 to G1 cells. (B) Arrest in G2 after exposure to medium containing 100 nM nocodazole for 2 h. (C) The removal of nocodazole and exposure to medium containing 6 μM aphidicolin for 6 h result in G1 arrest. (D) Cultures are returned to G2 by another treatment with 100 nM nocodazole. Data were collected as described above and gated according to a normal flow cytometry procedure using FlowJo software (Tree Star Inc., Ashland, OR).
In order to ascertain how quickly the cell cycle was reestablished after our dual drug treatment and determine subsequent cell viability, we performed a recovery time course experiment following treatment with nocodazole and aphidicolin. Exposure to 100 nM nocodazole for 2 h followed by treatment with 6 μM aphidicolin for 6 h resulted in cell cycle arrest first in G2/M and then in G1 (Fig. 3B and C). Following the removal of nocodazole-containing medium and the addition of medium containing 6 μM aphidicolin, cells arrested in G1 (Fig. 3C). After the removal of aphidicolin medium and replacement with fresh medium, the cells were allowed to recover under normal growth conditions. The cells remained synchronously in G2 for 3.0, 3.5, and 4.0 h (Fig. 3D to F). By 4.5 h, the cells began to go through mitosis and to accumulate in G1 (Fig. 3G). After 5.0, 5.5, and 6.0 h of recovery, the cells continued to accumulate in G1 (Fig. 3H to J). After 12 h of recovery, the cells had returned to the normal 5:1 ratio of G2 to G1 cells, as seen in the control sample (Fig. 3L). Data were collected as described in Materials and Methods and gated according to the normal flow cytometry procedure using FlowJo software (Tree Star Inc., Ashland, OR).
FIG. 3.
Recovery following cell cycle arrest in Giardia cultures. (A and B) Giardia cultures propagated under normal growth conditions (A) and exposed to 100 nM nocodazole (noc) for 2 h arrest in G2 (B). (C) Following the removal of nocodazole-containing medium and the addition of medium containing 6 μM aphidicolin (aph), cells arrest in G1. (D to F) After the removal of aphidicolin medium and replacement with fresh medium, the cells are allowed to recover under normal growth conditions for 3.0, 3.5, and 4.0 h. (G) By 4.5 h, the cells begin to go through mitosis and accumulate in G1. (H to J) After 5.0, 5.5, and 6.0 h of recovery, the cells continue to accumulate in G1. (L) After 12 h of recovery, the cells have returned to the normal 5:1 ratio of G2 to G1 cells as seen in the control sample.
In addition to the cytometry studies, cell viability was checked and growth curves were constructed for cultures prior to and following drug treatments. Cell viability before and after the treatments was assessed by staining the dead cells in cultures with phloxine B and tallying these cells relative to the number of live cells (Table 1). The number of dead cells in the starting culture decreased after pretreatment due to the dead cells' being decanted along with the detached cells prior to the addition of fresh nocodazole-containing medium. Following the 2-h nocodazole treatment, there was only a small increase in the number of dead cells, while following both the nocodazole and aphidocolin treatments, 90% of the cells remained viable to enter the recovery time course. Figure 4A shows two growth curves. The control curve represents the cultures from the time they were started until the drug treatments began at 36 h and shows normal log-phase growth. The recovery curve begins with time point zero as the removal of the final aphidicolin treatment and the addition of fresh growth medium. The release from cell cycle arrest was followed by a visible increase in cell division at approximately 6 h, which corresponded to the increase in G1 cells seen in Fig. 3. As recovery continued, the cells continued to divide, albeit more slowly, until lag phase was reached by 36 h after treatment. Figure 4B shows the two curves plotted as one continuous line to represent the data in terms of time, from 0 to 84 h.
TABLE 1.
Results of the viability assaya
| Culture status | % of viable cells |
|---|---|
| Starting culture | 94.06 ± 1.89 |
| Pretreated culture | 97.56 ± 1.51 |
| Culture treated with nocodazole for 2 h | 95.76 ± 3.76 |
| Culture treated with nocodazole for 2 h and aphidicolin for 6 h | 90.00 ± 3.11 |
Cell viability was documented using the adsorption dye phloxine B before the treatment began (starting culture), after the decanting of the growth medium prior to treatment (pretreated culture), following the nocodazole treatment, and following the nocodazole and aphidicolin treatments. Values are means ± standard deviations.
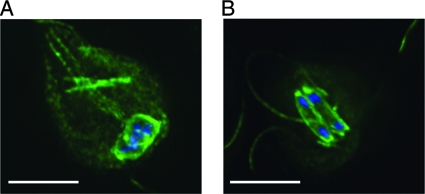
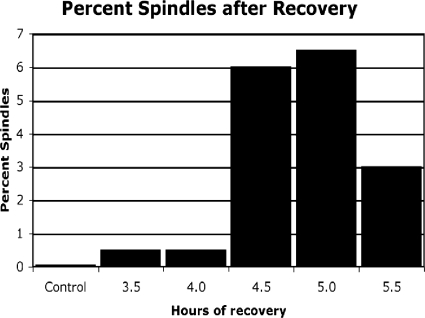
Light microscope evaluation at the 4.5-, 5.0-, and 5.5-h recovery time points demonstrated a visible increase in mitotic spindles compared to those in control cultures. Figure 5A and B shows mitotic spindles in Giardia cells undergoing metaphase and anaphase, respectively. Figure 6 shows that the number of spindle-containing cells relative to the number in control samples increased more than 100-fold between 4.5 and 5.0 h of recovery. These increases corresponded to the initial appearance of the G1 peak (Fig. 3G) and the increase in G1 peak height after 5.0 h of recovery (Fig. 3H and 4). The flow cytometry-determined DNA distributions indicate that there was still an increase in the number of cells entering G1 compared to the number of such cells in the control after 5.5 h of recovery. However, the number of spindles increased only 60-fold over that in the control. This result suggests that the wave of mitosis was complete and the cells were accumulating in G1.
FIG. 5.
Mitotic spindles in Giardia. Spindles were labeled with the TAT1 antitubulin antibody (26) and an Alexa 488-conjugated goat anti-mouse secondary antibody (Molecular Probes) in metaphase (A) and anaphase (B) after 4.5 (A) and 5.0 (B) hours of recovery from nocodazole and aphidicolin treatments. Nuclei were stained with DAPI (blue). Bars, 5 μm.
FIG. 6.
Percentages of mitotic spindles in Giardia cultures following recovery from cell cycle arrest. Light microscopy was used to count tubulin-labeled spindles from approximately 500 cells per Giardia culture after 3.5, 4.0, 4.5, 5.0, and 5.5 h of recovery from exposure to nocodazole and aphidicolin treatments. The number of spindles increases after 4.5 h and continues to increase after 5.0 h of recovery but decreases by 5.5 h of recovery, indicating that the wave of mitosis is complete.
Through the course of this work, we observed that previously published flow cytometry DNA distributions of Giardia trophozoites showed wide unresolved peaks which were difficult to interpret (7, 17, 21). Recent advances in Giardia flow cytometry protocols (4) greatly improved peak resolution but were not readily reproducible in our laboratory. Therefore, we developed a simple and reproducible flow cytometry protocol utilizing ethanol as a fixative and Sytox green as a fluorescent DNA dye. This protocol simplifies flow cytometry for Giardia cultures and enhances the resulting data by providing clean DNA distributions with well-differentiated peaks. As observed in Fig. 1 and 2, the locations of the G1 and G2 peaks shifted slightly along the x axis among the various experiments. This is due to differences not in the amounts of DNA but in the amounts of fluorescent dye available for incorporation into DNA and should not be considered a disadvantage of our protocol.
DISCUSSION
In the past, an inability to synchronize Giardia cell cultures has made it extremely difficult to study any aspects of cell biology related to the cell cycle. In this work, we developed an efficient method for attaining cell cycle synchrony in a two-step procedure using the drugs nocodazole and aphidicolin. The two-step procedure is necessary for Giardia because the parasitic protozoan does not respond as expected to drugs like hydroxyurea and colchicine (7), which are commonly used for cell synchronization for metazoans. This disparity may indicate that the cell cycle of Giardia is controlled in a manner different from that for mammalian cells and/or that the giardial targets of these drugs are highly divergent from their metazoan homologs. The use of aphidicolin with Trypanosoma brucei (19) previously proved successful as a means of inhibiting nuclear DNA synthesis and initiating cell cycle arrest in the G1/S stage (9, 19). However, aphidicolin treatment does not necessarily inhibit cytokinesis, indicating that a mitotic entry checkpoint is activated but that it does not prevent cytokinesis in the absence of mitosis (19). The work presented here provides the first published example of using aphidicolin to trigger cell cycle checkpoints in Giardia. Because exposure to aphidicolin causes cell cycle arrest in the G1/S stage for both T. brucei and Giardia, it can be assumed that aphidicolin has the same DNA polymerase target in these early-diverging eukaryotes as in other eukaryotic cells (24). In developing our protocol, we observed that concentrations from 30 to 60 μM, like those used for arrest for T. brucei (9, 19), caused cell death for Giardia.
Previous studies using nocodazole with Giardia investigated the direct and indirect effects of this drug on microtubule destabilization of the cytoskeleton. Exposure to high concentrations of nocodazole for prolonged periods of more than one cell cycle resulted in ventral disk fragmentation and abnormally shaped cells and ultimately led to cell death (13). Exposure to 10 μM nocodazole for 5 h had dramatic effects on flagellar length and the size of the median body (6) and on mitotic spindles (20). These results demonstrate that multiple giardial microtubule arrays are sensitive to nocodazole, and it is possible that many (if not all) of them are required for normal cell growth. By lowering the concentration of nocodazole to 100 nM and shortening the exposure time to 2 h, we were able to arrest cells in G2. However, upon the removal of the drug, the cells returned almost immediately to their original growth distribution. This result suggests that nocodazole may act by blocking cell cycle progression at multiple points in G2 or may have slowed cell growth throughout the cell cycle without necessarily triggering the spindle checkpoint, leading to asynchronous cell cycle progression after drug removal.
By combining short incubation times with low concentrations of nocodazole and aphidicolin, we have developed the first cell cycle synchrony protocol for Giardia that does not jeopardize cell viability. These data indicate that a G2/M boundary checkpoint is presumably activated by depolymerizing spindle microtubules, and upon drug washout, a wave of mitotic activity is observed, resulting in a high number of mitotic spindles compared to those in control samples. The presence of viable spindles during this transition signifies that microtubule organization in the trophozoite has not been irreversibly altered by the nocodazole. Previously, we were able to achieve a lesser degree of cell cycle synchrony by subjecting cells to bile starvation (20). While this method was sufficient to enhance the number of spindles, it may not be suitable for other biochemical studies.
The ability to arrest Giardia cultures in G1 and G2, followed by synchronous recovery spanning one to two life cycles, will enhance our ability to study cell cycle-related events. These techniques can be applied to studying not only mitotic spindles but also processes such as the cyclin-dependent kinase control of the cell cycle and the process of encystation.
Acknowledgments
We thank members of the Cande and Dawson labs for helpful discussions.
This research was supported by a grant from the NIH to W.Z.C. (A1054693).
Footnotes
Published ahead of print on 22 February 2008.
REFERENCES
- 1.Adam, R. D. 2001. Biology of Giardia lamblia. Clin. Microbiol. Rev. 14447-475. [DOI] [PMC free article] [PubMed] [Google Scholar]
- 2.Baldauf, S., A. J. Roger, I. Wenk-Siefert, and W. F. Doolittle. 2000. A kingdom-level phylogeny of eukaryotes based on combined protein data. Science 290972-977. [DOI] [PubMed] [Google Scholar]
- 3.Baldauf, S. L. 2003. The deep roots of eukaryotes. Science 3001703-1706. [DOI] [PubMed] [Google Scholar]
- 4.Bernander, R., J. E. D. Palm, and S. G. Svard. 2001. Genome ploidy in different stages of the Giardia lamblia life cycle. Cell. Microbiol. 355-62. [DOI] [PubMed] [Google Scholar]
- 5.Ciccarelli, F. D., T. Doerks, C. von Mering, C. J. Creevey, B. Snell, and P. Bork. 2006. Toward automatic reconstruction of a highly resolved tree of life. Science 3111283-1287. [DOI] [PubMed] [Google Scholar]
- 6.Dawson, S., M. S. Sagolla, J. J. Mancuso, D. J. Woessner, S. A. House, L. Fritz-Laylin, and W. Z. Cande. 2007. Kinesin-13 regulates flagellar, interphase, and mitotic microtubule dynamics in Giardia intestinalis. Eukaryot. Cell 62354-2364. [DOI] [PMC free article] [PubMed] [Google Scholar]
- 7.Hoyne, G., P. Boreham, P. Parsons, C. Ward, and B. Biggs. 1989. The effect of drugs on the cell cycle of Giardia intestinalis. Parasitology 99333-339. [DOI] [PubMed] [Google Scholar]
- 8.Inselburg, J., and H. Banyal. 1984. Plasmodium falciparum: synchronization of asexual development with aphidocolin, a DNA synthesis inhibitor. Exp. Parasitol. 5748-54. [DOI] [PubMed] [Google Scholar]
- 9.Kaminsky, R., B. Nickel, and A. Holy. 1998. Arrest of Trypanosoma brucei rhodesiense and T. brucei brucei in the S-phase of the cell cycle by (S)-9-(3-hydroxy-2-phosphonylmethoxypropyl)adenine ((S)-HPMPA). Mol. Biochem. Parasitol. 9391-100. [DOI] [PubMed] [Google Scholar]
- 10.Keister, D. B. 1983. Axenic culture of Giardia lamblia in TYI-S-33 medium supplemented with bile. Trans. R. Soc. Trop. Med. Hyg. 77487-488. [DOI] [PubMed] [Google Scholar]
- 11.Kulda, J., and E. Nohynkova. 1995. Giardia in humans and animals, p. 227-422. In J. P. Kreier (ed.), Parasitic protozoa, vol. 10. Academic Press, San Diego, CA. [Google Scholar]
- 12.Kumagai, M., A. Makioka, H. Ohtomo, S. Kobayashi, and T. Takeuchi. 1998. Entamoeba invadens: reversible effects of aphidocolin on the growth and encystation. Exp. Parasitol. 90294-297. [DOI] [PubMed] [Google Scholar]
- 13.Mariante, R. M., R. G. Vancini, A. L. Melo, and M. Benchimol. 2005. Giardia lamblia: evaluation of the in vitro effects of nocodazole and colchicine on trophozoites. Exp. Parasitol. 11062-67. [DOI] [PubMed] [Google Scholar]
- 14.Menges, M., and J. A. H. Murray. 2002. Synchronous Arabidopsis suspension cultures for analysis of cell-cycle gene activity. Plant J. 30203-212. [DOI] [PubMed] [Google Scholar]
- 15.Morrison, H., A. McArthur, F. Gillin, S. Aley, R. Adam, G. Olsen, A. Best, W. Cande, F. Chen, M. Cipriano, B. Davids, S. Dawson, H. Elmendorf, A. Hehl, M. Holder, S. Huse, U. Kim, E. Lasek-Nesselquist, G. Manning, A. Nigam, J. Nixon, D. Palm, N. Passamaneck, A. Prabhu, C. Reich, D. Reiner, J. Samuelson, S. Svard, and M. Sogin. 2007. Genomic minimalism in the early diverging intestinal parasite Giardia lamblia. Science 3171875-1876. [DOI] [PubMed] [Google Scholar]
- 16.Nohynkova, E., P. Draber, J. Reischig, and J. Kulda. 2000. Localization of gamma-tubulin in interphase and mitotic cells of a unicellular eukaryote, Giardia intestinalis. Eur. J. Cell Biol. 79438-445. [DOI] [PubMed] [Google Scholar]
- 17.Ortega-Barria, E., H. D. Ward, G. T. Keusch, and M. E. A. Pereira. 1994. Growth inhibition of the intestinal parasite Giardia lamblia by a dietary lectin is associated with arrest of the cell cycle. J. Clin. Investig. 942283-2288. [DOI] [PMC free article] [PubMed] [Google Scholar]
- 18.Pedrali-Noy, G., S. Spadari, A. Miller-Faures, A. O. Miller, J. Kruppa, and G. Koch. 1980. Synchronization of HeLa cell cultures by initiation of DNA polymerase alpha with aphidocolin. Nucleic Acids Res. 8377-387. [DOI] [PMC free article] [PubMed] [Google Scholar]
- 19.Plouvidou, A., D. R. Robinson, R. C. Docherty, E. O. Ogbadoyi, and K. Gull. 1999. Evidence for novel cell cycle checkpoints in trypanosomes: kinetoplast segregation and cytokinesis in the absence of mitosis. J. Cell Sci. 1124641-4650. [DOI] [PubMed] [Google Scholar]
- 20.Sagolla, M., S. C. Dawson, J. J. Mancuso, and W. Z. Cande. 2006. Three dimensional analysis of mitosis and cytokinesis in the binucleate parasite Giardia lamblia. J. Cell Sci. 1194889-4900. [DOI] [PubMed] [Google Scholar]
- 21.Sandhu, H., R. C. Mahajan, and N. K. Ganguly. 2004. Flowcytometric assessment of the effect of drugs on Giardia lamblia trophozoites in vitro. Mol. Cell. Biochem. 265151-160. [DOI] [PubMed] [Google Scholar]
- 22.Takenaka, K., T. Moriguchi, and E. Nishida. 1998. Activation of the protein kinase p38 in the spindle assembly checkpoint and mitotic arrest. Science 280599-602. [DOI] [PubMed] [Google Scholar]
- 23.Van de Peer, Y., S. L. Baldauf, W. F. Doolittle, and A. Meyer. 2000. An updated and comprehensive rRNA phylogeny of (crown) eukaryotes based on rate-calibrated evolutionary distances. J. Mol. Evol. 51565-576. [DOI] [PubMed] [Google Scholar]
- 24.Wang, T. 1991. Eukaryotic DNA polymerases. Annu. Rev. Biochem. 60513-552. [DOI] [PubMed] [Google Scholar]
- 25.Wood, R. D., and M. K. K. Shivji. 1997. Which DNA polymerases are used for DNA-repair in eukaryotes? Carcinogenesis 18605-610. [DOI] [PubMed] [Google Scholar]
- 26.Woods, A., T. Sherwin, R. Sasse, T. MacRae, A. J. Baines, and K. Gull. 1989. Definition of individual components within the cytoskeleton ofTrypanosoma brucei by a library of monoclonal antibodies. J. Cell Sci. 93491-500. [DOI] [PubMed] [Google Scholar]


