Abstract
The feasibility of off-line positron emission tomography/computed tomography (PET/CT) for routine three dimensional in-vivo treatment verification of proton radiation therapy is currently under investigation at Massachusetts General Hospital in Boston. In preparation for clinical trials, phantom experiments were carried out to investigate the sensitivity and accuracy of the method depending on irradiation and imaging parameters. Furthermore, they addressed the feasibility of PET/CT as a robust verification tool in the presence of metallic implants. These produce x-ray CT artifacts and fluence perturbations which may compromise the accuracy of treatment planning algorithms. Spread-out Bragg peak proton fields were delivered to different phantoms consisting of polymethylmethacrylate (PMMA), PMMA stacked with lung and bone equivalent materials, and PMMA with titanium rods to mimic implants in patients. PET data were acquired in list mode starting within 20 min after irradiation at a commercial luthetium-oxyorthosilicate (LSO)-based PET/CT scanner. The amount and spatial distribution of the measured activity could be well reproduced by calculations based on the GEANT4 and FLUKA Monte Carlo codes. This phantom study supports the potential of millimeter accuracy for range monitoring and lateral field position verification even after low therapeutic dose exposures of 2 Gy, despite the delay between irradiation and imaging. It also indicates the value of PET for treatment verification in the presence of metallic implants, demonstrating a higher sensitivity to fluence perturbations in comparison to a commercial analytical treatment planning system. Finally, it addresses the suitability of LSO-based PET detectors for hadron therapy monitoring. This unconventional application of PET involves countrates which are orders of magnitude lower than in diagnostic tracer imaging, i.e., the signal of interest is comparable to the noise originating from the intrinsic radioactivity of the detector itself. In addition to PET alone, PET/CT imaging provides accurate information on the position of the imaged object and may assess possible anatomical changes during fractionated radiotherapy in clinical applications.
Keywords: proton therapy, positron emission tomography, Monte Carlo
I. INTRODUCTION
One main clinical advantage of ion therapy over conventional radiation therapy is the excellent conformation of the delivered dose to the tumor while well sparing the surrounding healthy tissue. In order to exploit this advantage to its full extent and prevent unwanted exposure of nearby critical structures, verification of the beam delivery within the patient is strongly desirable. Since ions are completely stopped in the patient, no conventional methods like electronic portal imaging1 can be used for verification of the lateral field position. Furthermore, gaining insight into the beam penetration depth is an extremely important issue. Current treatment planning (TP) calculations are affected by 1%–3% range uncertainties which are intrinsic to the usage of calibration curves between computed tomography (CT) data and ion range.2-4 Such empirical conversion formalism is experimentally validated in tissue substitutes or samples, but cannot be directly verified within the patient. Additional sources of range uncertainties may arise from the presence of CT artifacts along the beam path, e.g., in patients having metallic implants. In these cases the incorrect CT number assignment in combination with the usage of CT-range calibration curves may lead to errors in the planning of the dose delivery.
Positron emission tomography (PET) has the potential to enable verification of the precision of ion irradiation in-vivo and noninvasively. The method is based on the detection of the β+ activity which is formed via nuclear fragmentation reactions between the projectiles and the target nuclei of the irradiated tissue. Verification of the actually delivered treatment and, in particular, of the beam range in the patient can be achieved by comparing the measured activity distributions with predictions based on the treatment plan, the patient anatomy and the time course of irradiation and imaging.5-7
In-beam (i.e., during the irradiation) PET monitoring has been demonstrated to provide useful clinical feedback after each treatment fraction and contribute to the improvement of the precision of tumor therapy with 12C ions at GSI Darmstadt, Germany.8,9 Extensive in-beam phantom experiments with proton beams in the same facility supported a similar potential for proton therapy, showing that for the same dose delivery the higher proton induced activation can provide sufficient accuracy for range verification in spite of its limitation to target (no projectile) fragmentation.10,11
In addition to preliminary phantom experiments of several groups,12-15 two recent but only qualitative clinical acquisitions16,17 have also suggested the applicability and usefulness of off-line (i.e., after the irradiation) PET monitoring for proton therapy. Although this approach is limited to the detection of long-lived isotopes (mostly 11C, half-life T1/2=20.39 min), it allows for the direct use of existent commercial detector systems without the effort to develop customized solutions.
The feasibility and value of off-line PET for proton therapy verification is currently under investigation at Massachusetts General Hospital, exploiting the availability of a newly installed PET/CT scanner within a 10 min walking distance from the proton therapy unit. In addition to information on lateral field position and proton range extracted from PET images alone, possibly fused with the planning CT, this first time use of the integrated PET/CT modality offers the advantage to explore simultaneously the possibility of anatomical modifications with respect to the planning situation during fractionated radiotherapy. Furthermore, the CT information in the imaging position enables the usage of sophisticated image registration tools for precise alignment of the measured PET distribution to the planning CT and its related CT-based PET calculation. Hence, off-line strategies using PET/CT instead of PET imaging alone should reduce the ±1 mm object position uncertainties quoted in Ref. 15 for phantom studies and offer the advantage of shorter acquisition time and better accuracy in comparison to the transmission scan approach of Ref. 17 for applications to patients.
In preparation of clinical trials, phantom experiments were performed to gather quantitative information on counting statistics and image quality depending on the irradiation and imaging parameters for assessment of feasibility and definition of imaging protocols. In particular, suitability and performances of a commercial PET scanner using intrinsically radioactive luthetium-oxyorthosilicate (LSO) detectors needed to be assessed for this first time application to ion therapy monitoring, which involves much lower count rates than conventional tracer imaging in nuclear medicine. Although phantom materials do not necessarily correspond to the composition of living tissue, they provide basic results under well defined conditions for extrapolation to clinical situations. Moreover, irradiation and imaging of objects of precisely known composition and geometry allows for validation and refinement of the models used for the prediction of proton induced β+ activity, which has to be compared with the measurement for treatment verification. In a similar way, phantom experiments enable a controlled study of the feasibility of PET/CT as a range monitoring tool insensitive to the corruption of the CT anatomical information due to artifacts, e.g., in the presence of metallic implants.
PET/CT images were acquired after high and low dose exposure of homogeneous and inhomogeneous phantoms. The spatial distribution of the measured activity has been compared qualitatively and quantitatively with Monte Carlo (MC) calculations. The data analysis specifically aimed to:
Quantify the produced activation for extrapolation to realistic clinical applications.
Quantify the signal degradation due to the intrinsic radioactivity of LSO detectors as a function of the imaged activity strength.
Investigate the achievable accuracy of range monitoring and lateral field position verification, and its dependence on the signal to noise ratio for both single and multifield irradiation of both homogeneous and inhomogeneous phantoms.
Address the accuracy and sensitivity of PET/CT against CT-based Monte Carlo and analytical treatment planning calculations in the presence of CT artifacts and fluence perturbations due to metallic implants.
The paper is organized as follows. Section II describes the experimental setup. Aim and methods of the data analysis are outlined in Sec. III. Results are shown in Sec. IV. A discussion follows in Sec. V. Section VI concludes the paper.
II. EXPERIMENTS
A. Phantom irradiation
Phantom irradiation was performed in the gantry treatment rooms for proton therapy at Massachusetts General Hospital. The proton beam is extracted from a 230 MeV fixed-energy cyclotron. The treatment fields are formed using passive energy degraders and beam shaping systems. In all our measurements we used spread-out Bragg-peak (SOBP) fields of either 15 or 16 cm water equivalent (WE) range and a modulation of 10 cm WE length, using an aperture of 8×8 cm2. The corresponding depth dose distributions were measured in a water tank by means of an ionization chamber (IC). The dose rate was approximately 1.0–1.4 Gy/min.
In two measurements a total high dose of 8 Gy was delivered to homogeneous phantoms of polymethylmethacrylate (PMMA), cf. Table I). The phantoms were cylinders of 8.9 cm radius and 20.4 cm height, e.g., comparable to head and neck (HN) cases. They were placed with the cylinder axis perpendicular to the treatment table. In the first irradiation a single field of 16 cm WE range was delivered to one cylinder from the top (gantry angle θ=0°). The second irradiation consisted of two orthogonal fields of 16 and 15 cm WE range entering the other phantom from the top (θ=0°) and the side (θ=270°), respectively. The overlapping region was chosen to reduce but not completely shadow the distal activation falloff of each individual field, which is of interest for range monitoring. In a third measurement a field of lower therapeutic dose of 2 Gy and 16 cm WE range was delivered to a more realistic inhomogeneous phantom assembled from large area slabs of {2.53, 2.00, 3.34, 4.00, 7.33} cm thickness consisting of PMMA, bone equivalent (tissue equivalence is based on photon attenuation), PMMA, lung equivalent (tissue equivalence is based on photon attenuation) and PMMA, respectively (cf. Table I). The beam direction was chosen from the top (θ=0°) perpendicular to the slabs. Finally, a 8 Gy SOBP of 16 cm WE range was delivered from the top (θ=0°) to a PMMA cylinder with two titanium rods of 6.35 mm diameter and 6 cm length. The rods were obtained from a commercial sample used for patient implants in the spine. They were positioned parallel to each other at a depth of 2 and 4 cm from the cylinder top surface and at a distance of ±1 cm from the cylinder axial plane parallel to the rods, respectively (Fig. 1). This choice corresponds to a realistic situation with the implants placed few centimeters outside the SOBP, i.e., the tumor region. Details about all measurements are summarized in Table II.
Table I.
Elemental composition (fraction by weight) and density of the plastic and tissue equivalent materials used in this study.
| Medium | H (%) | C (%) | N (%) | O (%) | Mg (%) | Cl (%) | Si (%) | Ca (%) | ρ (g cm−3) |
|---|---|---|---|---|---|---|---|---|---|
| PMMA | 8.05 | 59.99 | … | 31.96 | … | … | … | … | 1.18 |
| Bone eq. | 3.41 | 31.41 | 1.84 | 36.50 | … | 0.04 | … | 26.81 | 1.819 |
| Lung eq. | 8.46 | 59.38 | 1.96 | 18.14 | 11.19 | 0.10 | 0.78 | … | 0.30 |
Fig. 1.
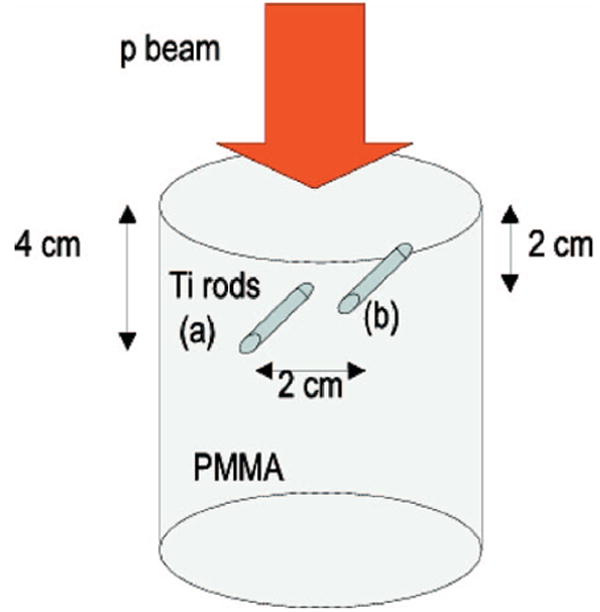
PMMA cylinder with insertion of two rods of titanium placed parallel to each other at a distance of ±1 cm from the cylinder center and at a depth of 4 cm (rod a) and 2 cm (rod b) from the cylinder top surface. The beam was delivered from the top.
Table II.
Parameters (ID, phantom, gantry angle, dose per field, irradiation time, delay to the beginning of imaging and PET acquisition time) of the experiments.
| ID | Phantom | θ (°) | Df (Gy) | tirr (min) | ΔT (min) | tmeas (min) |
|---|---|---|---|---|---|---|
| 1) | PMMA | 0 | 8 | 6.0±0.5 | 20±1 | 60 |
| 2a) | PMMA | 0 | 4 | 3.15±0.05 | 27.65±0.05 | 60 |
| 2b) | PMMA | 270 | 4 | 3.13±0.05 | 18.22±0.05 | 60 |
| 3) | Inhom. | 0 | 2 | 1.8±0.7 | 18.48±0.02 | 20 |
| 4) | PMMA+Ti | 0 | 8 | 6.25±0.20 | 13.98±0.02 | 61 |
B. PET/CT imaging
The activated phantoms were imaged starting from 14 to 20 min after the end of (the last) irradiation (cf. Table II) at the PET/CT scanner located in the Radiology Department of the hospital, nearby the proton therapy unit. The device (CPS/Siemens Biograph Sensation 16, pico electronics) integrates a 16 slice CT with the innovative fast, high resolution PET technology based on LSO scintillation material. The PET component of the tomograph has no septa and performs in three dimensions (3D) only. It features 24 crystal rings with 384 crystals per ring. Each crystal has a dimension of 6.45×6.45×25 mm3. The gantry crystal radius is 41.25 cm for a transaxial field of view (FOV) diameter of 58.3 cm. The axial field of view extension is 16.2 cm. For acquisition, the coincidence time window is set to 6 ns, taking full advantage of the short decay time and high light output of LSO. The energy discrimination window is set to 400–650 keV in order to allow an efficient reduction of the background due to the 2.6% radioactive component 176Lu of luthetium present in LSO.
The relative orientation of the phantoms within the scanner was chosen to be similar to the treatment position with respect to the table and the gantry. CT data were acquired prior to the PET imaging with the adjustable slice thickness set to 3.0 mm. The transaxial pixel size of the reconstructed images ranged from about 1.0 to 1.3 mm. These values result in voxel sizes comparable to those of the CT scans typically acquired for treatment planning purposes. PET data were acquired in list mode (with 1 ms time stamps) to allow off-line analysis in different time windows. The acquisitions following high total dose exposures of 8 Gy were taken for 60 min to investigate effects of counting statistics on image quality. Reconstruction of the last 20 min of the acquisition, i.e., after about two half lives of the dominant 11C activity component, basically corresponds to the imaging situation after one fourth of the dose exposure, i.e., the typical clinical value of 2 Gy. In the study with the lower dose exposure of 2 Gy the imaging time was limited to 20 min to mimic a more practicable protocol for clinical applications.
PET images were obtained after filtered backprojection (FBP) as well as iterative (ordered-subsets expectation maximization, OSEM, four iterations, eight subsets) reconstruction among the available tools provided by the manufacturer. In all cases, Fourier Rebinning was used to reduce the 3D datasets to two dimensions before reconstruction. A transaxial Gaussian filter of 4–5 mm full width at half maximum (FWHM) was applied to the images after reconstruction. The fixed axial slice thickness was 3.375 mm. The adjustable transaxial pixel size was limited to about 1.3 mm to allow a fine sampling of the activity distal edge, correlated with the proton range.
PET/CT images exported in digital imaging and communications in medicine (DICOM) format were finally fused using dedicated tools developed under MATLAB (The Math-Works Inc., Natick, MA) for further analysis. This image processing was validated against the fusion software provided by the manifacturer. Additionally, the CT of the phantom with the titanium inserts was transferred via the picture archiving and communication system (PACS) to the treatment planning system at the proton center.
C. Treatment planning
For the irradiation with the titanium inserts a corresponding dose calculation was done using the commercial treatment plan program FOCUS/XiO (Computerized Medical Systems Inc.) in clinical use at the proton center. For this purpose, a CT scan of the phantom was additionally taken using the same tomograph and acquisition settings as for the planning of patients. Furthermore, the import of the CT from the PET/CT scanner into the planning system allowed a rigid co-registration of the two CTs using the available commercial tool based on mutual information maximization. This provided the transformation matrix relating the measured PET/CT images to the coordinate system of the planning CT and its corresponding CT-based calculations.
III. DATA ANALYSIS
A. Quantification of the produced activity
Absolute quantification of the measured activity was obtained from the reconstructed images, including all correction factors for random coincidences, scattered and attenuated photons, detection efficiency and dead time. Although in our study both FBP and OSEM algorithms provided comparable results, filtered backprojection was preferred for accurate quantification.
Since the measured activity originated from a mixture of isotopes of different half lives (mainly 11C, 13N, and also 38K in the case of the bone equivalent insert), we had to eliminate the two decay correction factors D1 and D2
| (1) |
| (2) |
from the data. These factors are applied by the scanner for a single isotope only (in our choice 11C, with decay constant λ11C=5.67·10−4 s−1) in order to correct for the activity decay during the frame of duration tframe (D1) and the decay from the beginning of the acquisition, t0,acq, to the frame start time, t0,frame (D2) Undoing these corrections allows one to recover the real average activity A measured in a given time frame.
The individual isotope components contributing to A could be identified and separated by time analysis of the activity decay. This was independently done using the true count rate from the whole measured list mode data (for homogeneous phantoms only) as well as the activity distributions dynamically reconstructed in short time frames (i.e., D1≈1), corrected for D2 and evaluated in arbitrary regions of interest (ROIs). An example is given in Fig. 2. In PMMA the considered isotopes were restricted to 11C, 13N or 11C, 13N, and 15O (all with a similar β+ branching ratio).
Fig. 2.
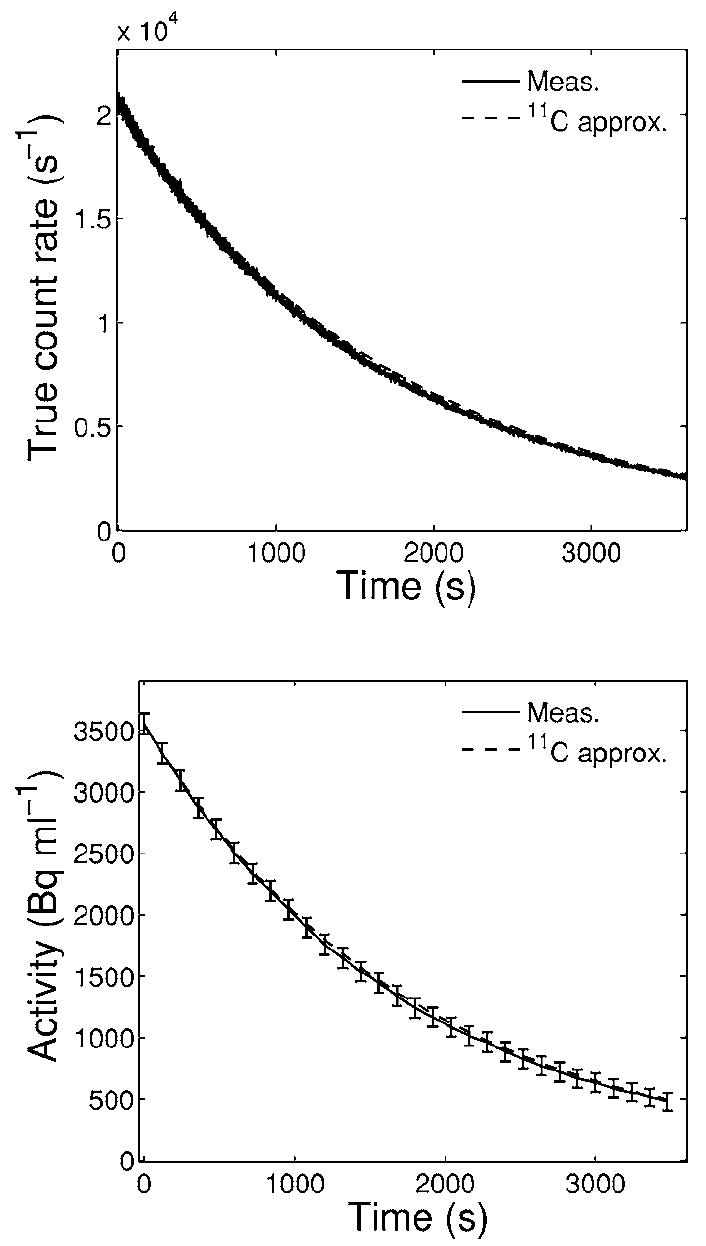
True count rate (top) as well as mean activity (bottom) reconstructed from 120 s long time frames and evaluated in a wide ROI (≈250 ml) within the irradiated volume for the 8 Gy single field irradiation of PMMA. Solid lines connect measured data. Dashed lines show the calculated exponential decay of the initial measured value when attributing the signal entirely to 11C. Error bars in the bottom panel are standard deviations of the shown mean values.
From the separation of the individual isotope contributions and the measured average activity A it was possible to quantify the activity produced at the end of irradiation for each considered isotope. Details are given in the Appendix. The method is very accurate only for the 11C component, dominating the signal (≥94%) already at the beginning of the imaging.
B. Quantification of the LSO background
A quantitative estimation of the LSO background was done by analyzing the time dependence of the measured true and random count rates extracted from the raw list mode data. The radioactive isotope 176Lu amounting to 2.6% of the natural luthetium present in LSO emits beta particles with mean energy of 420 keV.18,19 In addition, it emits three γ photons of 88, 202, and 307 keV simultaneously to the beta particles. Depending on the lower threshold of the acceptance energy window, the intrinsic radiation increases the singleevent counting rate of LSO detectors. This primarily generates a random coincidence rate background in a LSO-based PET system. Moreover, it also creates a small background of intrinsic true coincidences resulting from the production of a beta particle in one detector and the detection of the escaped photon by another detector.
In our study the true coincidence rate due to the natural radioactivity of LSO can be assumed to be negligible. This background is expected to be less than 1 kcps according to investigations by Yamamoto et al.19 at our same 400–650 keV energy threshold setting for the similar ACCEL (CPS Innovations) PET scanner, which uses the same LSO block detector configuration (but different electronics) as our PET/CT scanner. The counting rate should be even lower than 600 cps, according to the values reported for the ACCEL scanner as well as the previous generation of our CPS/ Siemens Biograph scanner, both operated with a less favorable lower energy threshold of 350 keV.20,21 Moreover, all these values refer to blank scans with no objects in the field of view of the scanner. The intrinsic true count rate is substantially reduced in our experimental condition due to the presence of a thick attenuating (up to 90% at the 509 keV sum peak of the 202 and 307 keV photons) material, the irradiated phantom, having a larger axial extent than the scanner FOV. Indeed, the intrinsic low level and the additional attenuation, typical also for objects such as patients, justifies the lack of explicit correction in current commercial LSO-based PET systems.20 Similarly, from the above quoted values the intrinsic trues are believed to have a negligible impact also at our low count rate levels (cf. Fig. 2, top).
On the contrary, the amount of random coincidences due to the LSO radioactivity is expected to be dominant in our study, according to the values of about 1.6–4.0 kcps reported for similar scanners and acquisition settings.19,20 Since the rate of random coincidences is approximately proportional to the square of the singles rate, it is evident that the relative contribution of the intrinsic randoms becomes greater and greater in the imaging of low activity levels as in our applications.
From all these considerations, the time dependence of the measured true count rate can be assumed to reflect primarily the decay of the activity source. Contrarily, the measured random count rate R(t) can be described as the superimposition of two contributions:
| (3) |
with a, b, and c positive constant. The first term depends on the singles count rate from the extrinsic activity source, and should therefore decrease approximately with the square of the exponential decay of the true count rate. The bias c originates from the intrinsic singles rate from the detector, which is stationary over our measuring time. Therefore, time analysis of the measured true and random coincidence rates gives an indication on the relative weight of the extrinsic and intrinsic random component. This allows to quantify the degradation of the signal to noise (i.e., true to random) ratio due to the LSO radioactivity in dependence on the strength of the imaged activity source.
C. Monte Carlo prediction
The predicted amount and spatial distribution of activity was obtained from calculations based on the FLUKA Monte Carlo code,22,23 internally combined with experimental cross sections as described elsewhere.10 In addition to the main (p,pn) reaction channels on C and O leading to 11C (T1/2=20.39 min) and 15O (T1/2=2.03 min), respectively,10,11 we included further proton interactions with O, N, and Ca yielding long-lived positron emitters such as 11C, 13N (T1/2=9.97 min), and 38K (T1/2=7.63 min). The cross sections for these additional reaction channels were interpolated from experimental and evaluated data.24-30
The proton beam phase-space input information for the two SOBP fields was obtained from a GEANT4 (Ref. 31) based calculation, which models the entire nozzle of the proton therapy facility.32 The resulting dose distributions in water were validated against the depth profiles measured in a water tank with an ionization chamber and those obtained from an entire GEANT4 calculation (Fig. 3, top). The range value extracted from the distal falloff at the physically most meaningful 80% level33 and the practically used 90% level was found to agree within 1 mm with the measurement, fulfilling the clinical requirement. A minor disagreement between the predictions of the two simulation codes and the measurement was observed in the shape of the distal region. In particular, FLUKA tends to underestimate the distal dose up to ≈4%, as opposed to an overestimation of GEANT4 up to ≈2%. Whereas the deviation from the measurement may include effects of the IC response in the steep dose falloff region, the discrepancies between the two MC calculations are attributed to differences in particle tracking and physics implementation between the two codes which are beyond the purposes of this study. The deviation involves a spatial region of no relevance for PET monitoring, i.e., at a penetration depth where positron emitters are no longer produced because of the beam energy falling below the thresholds for nuclear reactions. Since the PET signal is mostly sensitive to the proton fluence distribution, fluence depth profiles were additionally calculated and found to be in good agreement between the two codes (Fig. 3, bottom). Similar results were also obtained when validating the FLUKA range predictions (deduced from the known material composition) against measurements and GEANT4 calculations34 of depth dose distributions in water after transversal of the same bone and lung equivalent slabs used in this experiment. Although GEANT4 is successfully employed for clinical dose calculations at the proton center,35 the chosen approach using FLUKA was preferred for PET studies due to the traditional reliability of the FLUKA nuclear models36 and the good agreement with experimental in-beam PET data.10,11
Fig. 3.
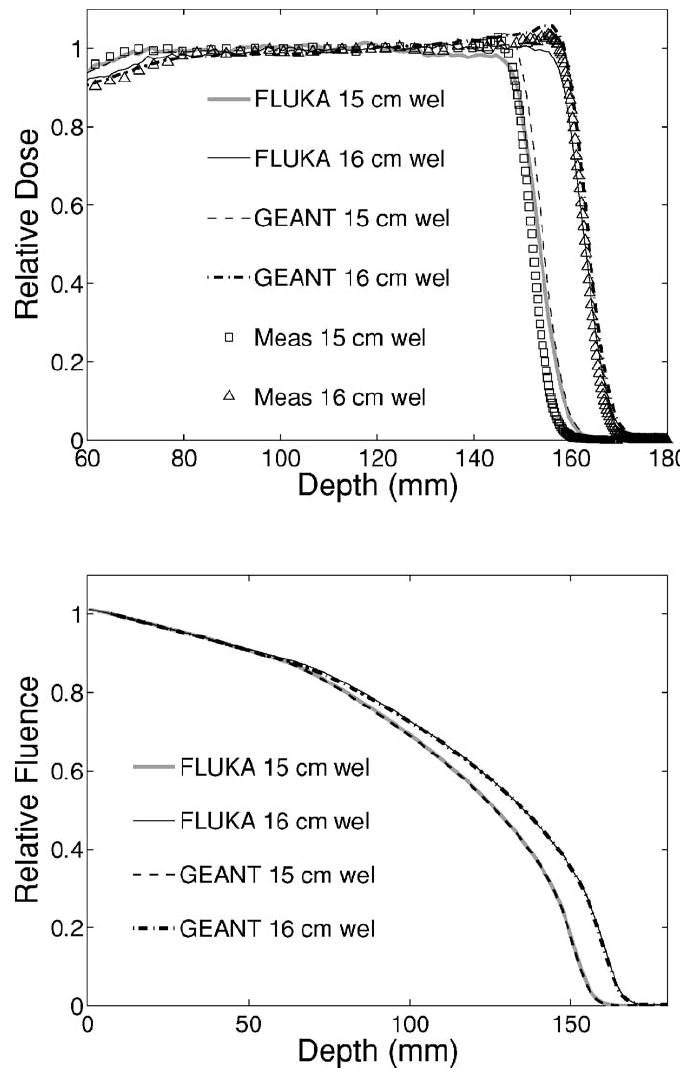
Top: Depth dose distributions in water calculated by means of the GEANT4 (broken lines) and FLUKA (solid) codes using the same phase-space input information in comparison to measured data points (open squares and triangles) acquired with a thin ionization chamber for two SOBPs of 10 cm modulation at 15 and 16 cm range, respectively. Bottom: Corresponding proton fluence distribution in depth calculated by the two simulation codes.
In the simulation, the irradiated phantoms were mostly modeled using combinatorial geometry, to avoid loss of accuracy, e.g., due to partial volume effects from the CT imaging. Only in the case of the phantom with the two titanium rods three different approaches were followed and compared. In addition to the combinatorial geometry description (I), two calculations based on the planning CT were performed with the primary aim to investigate the effects of CT artifacts on CT-based Monte Carlo and treatment planning calculations against the PET/CT measurement. They also allowed to address the accuracy of the treatment planning pencil beam algorithm37 versus Monte Carlo and PET in the presence of fluence perturbations due to small metallic implants.
The first CT-based calculation (II) was done with a coarse segmentation of the CT numbers or Hounsfield Units, HU, exclusively into air (HU3<−500), PMMA (−500≤HU<2600), and titanium (HU≥2600), to reproduce a reference result similar to the combinatorial “perfect” geometry description (I). The negative range of HU values for PMMA was necessary to eliminate CT artifacts. The second approach (III) tailored to future clinical applications implemented the CT conversion into mass density and elemental composition of Schneider, Bortfeld, and Schlegel.38 The original number of 24 intervals within −1000≤HU<1600 was extended with three more intervals [1600,2000), [2000,3060) and ≥3060 to include titanium (HU≈3070). The composition of the first two additional intervals different from Ti was taken from the [1500, 1600] interval,38 whereas the density was extrapolated from the treatment plan calibration curve. Beyond this main segmentation, HU-dependent adjustment of ionization and nuclear processes was done using scaling factors as proposed elsewhere.35 This accounts for the density variation within each HU interval, defined in the code as a unique material sharing the same elemental composition and a nominal average density (corresponding to the HU value in the center of the interval). The ionization scaling factor was furthermore adjusted to reproduce the same calibration curve, i.e., HU versus relative stopping power table as the treatment planning program (Fig. 4). For this specific implementation, an experimental version of the latest FLUKA code39,40 was kindly provided by the authors. Since the allowed scaling is restricted to the [2/3,3/2] range, the two original intervals for −10003≤HU<−120 (Ref. 38) had to be subdivided into nine smaller intervals of the same composition but different nominal density, to constrain the density variation and related scaling factors within each interval.
Fig. 4.
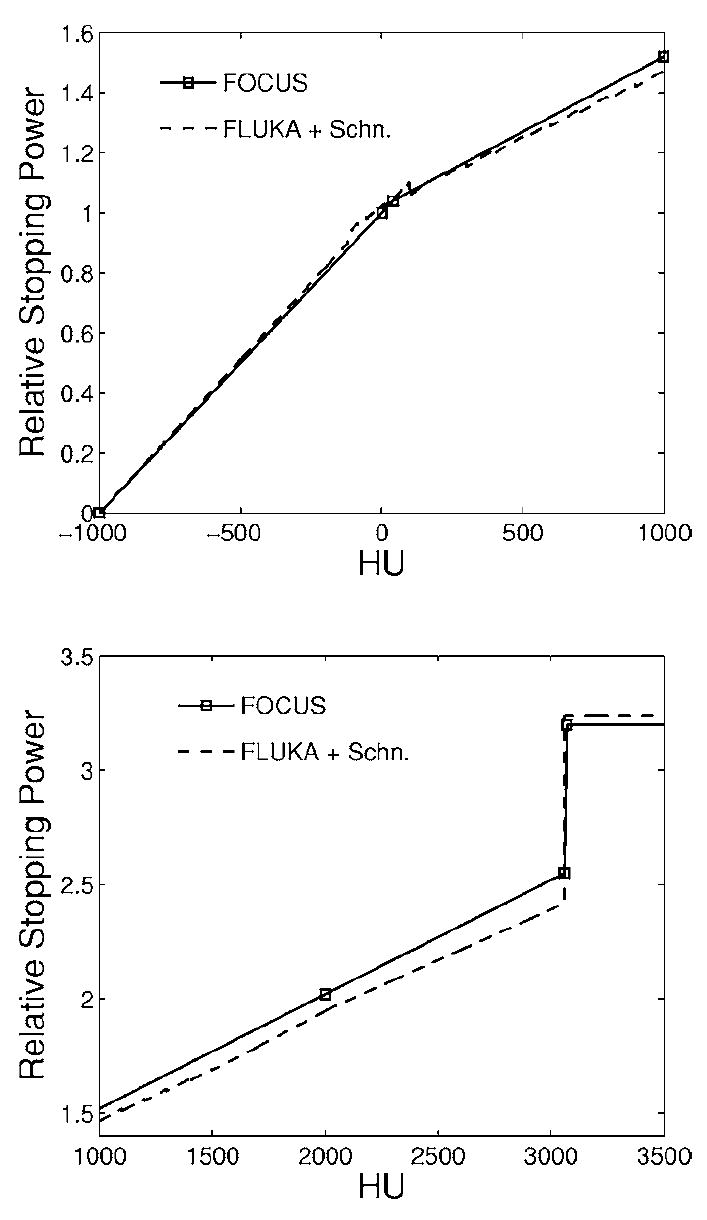
HU-dependent stopping power ratio to water used by the FOCUS/XiO treatment planning program (solid) and internally calculated by FLUKA (dashed) when implementing the segmentation from Ref. 38 and accounting for the HU-dependent density scaling only. The lower figure shows the extension up to higher HU values than those considered in Ref. 38.
For final comparison with the measured PET images, the simulated spatial distributions of positron emitters (stored in the same voxel grid of the PET/CT or planning CT) were convolved with a 3D Gaussian point spread function of 7 mm FWHM in the transaxial plane and 7.5 mm in the axial direction of the PET/CT scanner. This accounts for blurring effects due to the image formation (positron and photon propagation) and reconstruction. The resulting activity Asim,end produced at the end of irradiation and the average activity Asim expected in an arbitrary time frame of duration tframe starting at a time t0,frame were finally calculated as:
| (4) |
| (5) |
where i is the number of delivered fields and Pi,j is the (smoothed) distribution of positron emitters of species j for the given irradiation field i of duration tirr,i, ending at the time tend,i. The normalization factor Nnorm,i was introduced as the ratio of the prescribed to the simulated dose in water for the considered ith SOBP field. All simulations were performed using phase spaces of 4·106−1.4·107 primary protons (the largest amount for the CT-based calculations) as a good compromise between the conflicting goals of good statistics and low computation time. For the latter purpose, GEANT4 phase space generation and FLUKA particle transport were split in 2–10 independent runs requiring 6–20 h Central Processing Unit time on the existent LINUX computer cluster, mostly using 2.2 GHz Athlon processors.32
IV. RESULTS
A. Quantification of the produced activity
Time analysis of the three 60 min acquisitions following the high total dose exposures of 8 Gy indicated an initial (i.e., at the beginning of imaging) fraction of 11C activity between 94% and 97% in PMMA, depending on the irradiation time and the delay before imaging. The second major component, due to 13N, was found to be 3%–5%. Minor traces of 15O activity could be also identified in the first few minutes of the measurement. According to experimental production rate estimates10 and the Monte Carlo predictions, the expected 15O activity fraction should vary from 2% to 0.3% for about 6 min irradiation followed by 14–20 min delay, respectively. The results of our analysis do agree with these expectations.
For the dominant 11C component a maximum activity production of about 870 Bq/ml/Gy (when normalizing to the nominal dose to water) was quantified after about 6 min single field irradiation of PMMA. This estimate was obtained from measurements and MC predictions using Eq. (A2) from the Appendix and Eq. (4), respectively. Uncertainties were estimated to be within 4%. A comparison with other data from the literature and the consequence for clinical applications will be addressed in the discussion.
B. Quantification of the LSO background
Time analysis of the acquired list mode data indicated a stationary random background of about 930–1000 cps due to the LSO intrinsic radioactivity. An example is shown in Fig. 5 for the 60 and 20 min acquisitions following 8 Gy and 2 Gy single field exposure of pure PMMA and of the inhomogeneous phantom, respectively. The random component due to the extrinsic activity source was separated from the total one by fitting the measured data according to Eq. (3) (Fig. 5, top). The corresponding separation of the noise to signal (N/S) ratio is shown in Fig. 5 (bottom) as a function of the true count rate due to the extrinsic activity source. The considerable degradation (N/S≥0.2) due to LSO is clearly visible for true count rates below about 4.8–5.7 kcps, corresponding to a maximum average activity density of 1 kBq/ml (in the entrance PMMA channel) and a total actitity of about 1 MBq.
Fig. 5.
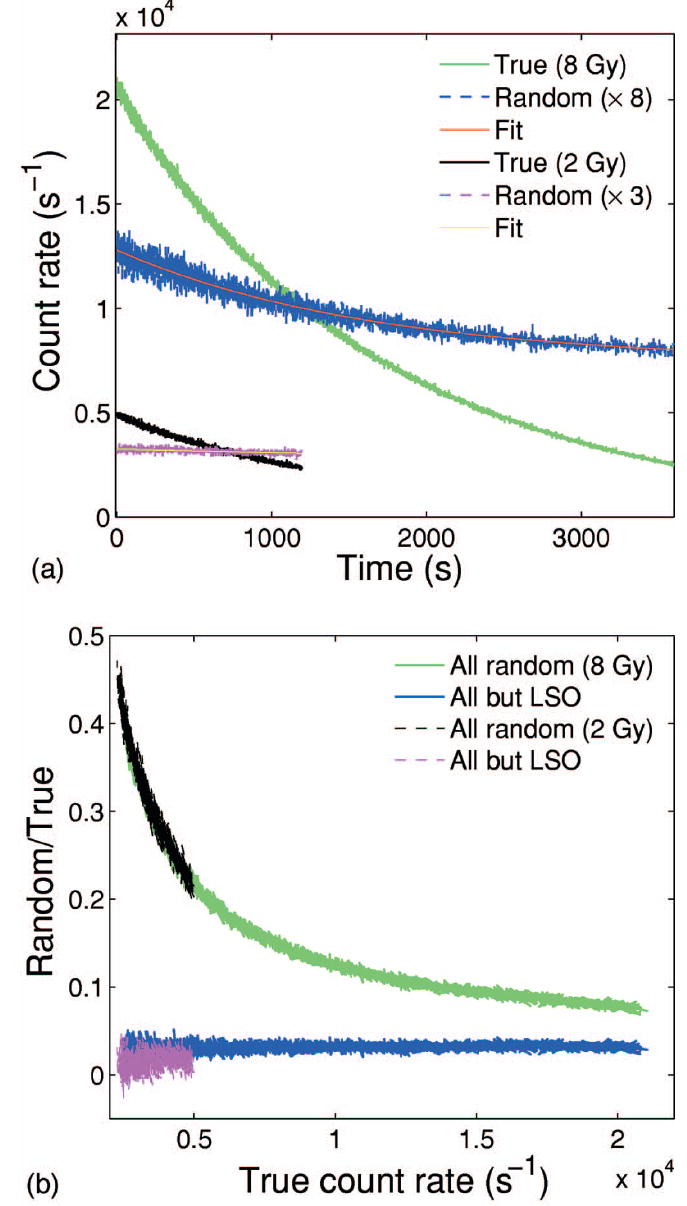
Top: Measured true (green, black) and random (blue, magenta) count rate and corresponding fit according to Eq. (3) (red, yellow) for 60 and 20 min acquisition after 8 Gy and 2 Gy single field exposure of pure PMMA and an inhomogeneous phantom, respectively. Bottom: Corresponding separation of the noise to signal ratio due to all the random components (green, black) from that exclusively due to the extrinsic activity source (blue, magenta) as a function of the measured true count rate.
C. Depth activity distributions: The accuracy for proton range monitoring
Range information is deduced from the distal falloff of measured and simulated activity distributions. For single fields we considered the 50% falloff position, similarly to Refs. 11 and 15. For overlapping fields the analysis was reduced to the positions within the 30%–10% falloff, to exclude the lateral contribution of the second beam. For the PET measurements and CT-based calculations, the entrance position in the phantom was accurately obtained from the corresponding CT images.
1. Homogeneous phantom
CT-fused FBP and OSEM reconstruction of the entire measured data are compared to the MC prediction in Fig. 6 for the 8 Gy single SOBP exposure of pure PMMA. The transaxial views are taken at the isocenter of the beam delivery, approximately coinciding with the center of the imaged distributions. The lines denote the positions of measured and predicted one-dimensional (1D) activity depth profiles shown together with the calculated depth dose distribution in PMMA in Fig. 7. As in the following, if not otherwise stated, the data are averaged over about ±6.5 mm from the central slice (axis).
Fig. 6.
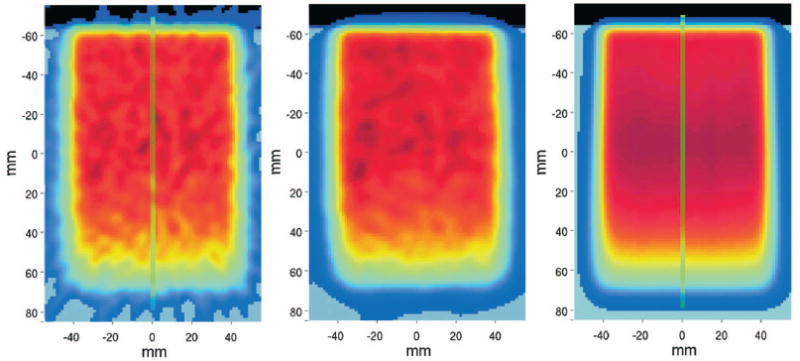
Transaxial views of CT-fused PET images obtained by FBP (left) and OSEM (middle) reconstruction of the entire acquisition in comparison to the simulation (right) for the single field 8 Gy exposure of a PMMA cylinder from top. The origin of the coordinate system indicates the isocenter of the delivered field. Vertical lines mark the position of the depth profiles of Fig. 7.
Fig. 7.
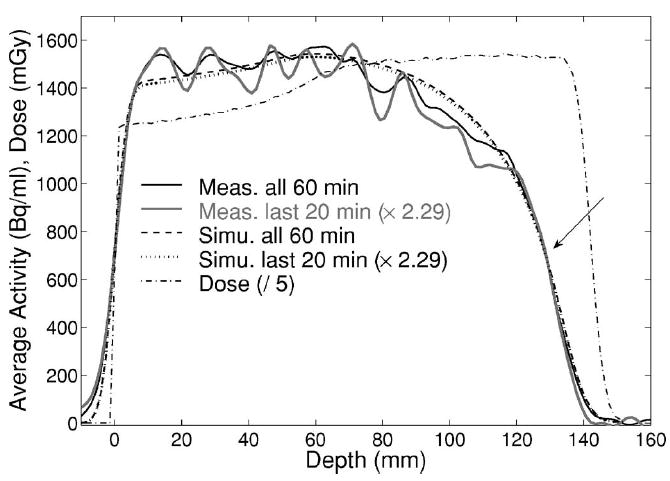
Measured (solid black, gray) and simulated (dashed, dotted) activity depth profiles for all 60 min or only last 20 min (scaled by 2.29) acquisition, respectively, after 8 Gy exposure of PMMA. The arrow indicates the 50% falloff position. The dash-dotted line shows the Monte Carlo calculated depth dose distribution, divided by a factor of 5 to allow for the same range scale of the activity (left axis).
The 50% falloff position of the measured activity depth profiles was found to agree with the simulation within 1 mm, even when reconstructing only the last 20 min of acquisition. The latter choice corresponds to the activity level in a more realistic clinical condition of about one fourth of the dose delivery and only one third of the total measuring time, i.e., 2 Gy exposure followed by 20 min acquisition after the same time delay ΔT. This results in a reduction of the average measured activity by a factor of about 2.29 (Fig. 7).
The 50% falloff position of the measured activity profiles was also found to be independent of the image reconstruction approach. However, the very distal part of measured and calculated activity profiles was observed to be more sensitive to statistical fluctuations (measurement), as well as to both the modeling of the PET system response function and the knowledge of the beam higher energy spectrum due to the beam energy spread (simulation). This challenges the achievable accuracy for range monitoring in the case of very shallow distal distributions, as in the selected example of multi-field irradiation (Fig. 8). But in spite of the long delay of 27.65 min after half the dose delivery (i.e., 4 Gy) of the same SOBP, measured and simulated distributions were still found to agree within 1 mm in the distal 10%, 20%, and 30% falloff positions (Fig. 9), when normalized to the maximum. A similar agreement was observed for the overlapping lateral field, although this comparison is more sensitive to the setup alignment because of the curvature of the target.
Fig. 8.
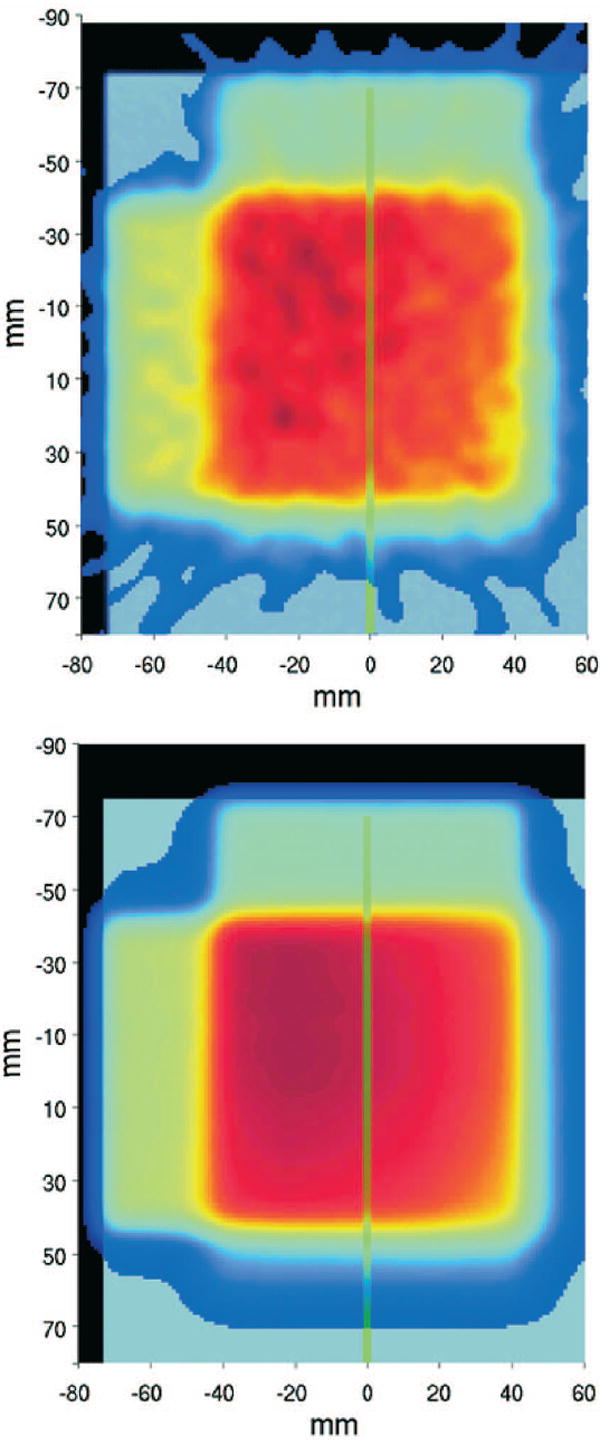
Measured (FBP, top) and MC predicted (bottom) images for the entire acquisition of the multifield exposure of a PMMA cylinder at 4 Gy/field. The first field enters the phantom from top and the second from the side. The green lines indicate the position of the one-dimensional profiles of Fig. 9.
Fig. 9.
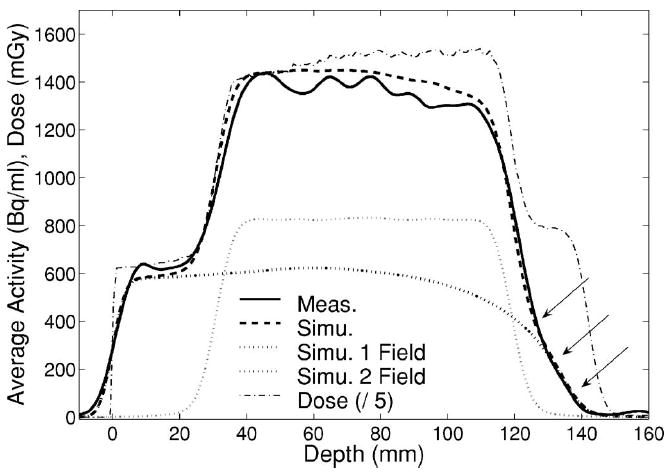
Measured (solid, FBP) and MC predicted (dashed) activity profiles along the penetration depth of the first (θ=0°) portal of a multifield irradiation of a PMMA cylinder. Arrows indicate the considered distal falloff positions. Thick and narrow dotted lines illustrate the separate simulated contributions of the first and second (θ=270°) field, respectively. The calculated total dose profile (divided by 5) is additionally shown by the dash-dotted line.
2. Inhomogeneous phantom
Measured and predicted activity depth profiles together with the calculated depth dose distribution are shown in Fig. 10 for the single field, 2 Gy exposure of the inhomogeneous phantom. Similar to the profiles corresponding to the last 20 min acquisition in Fig. 7, the large statistical fluctuations in the proximal part clearly indicate the increase of the noise due to the limited dose and measuring time in combination with the considerable background from the intrinsic LSO radioactivity (cf. Fig. 5). Nevertheless, the 50% falloff position was found to agree within 1 mm with the simulation, whether or not an additional median filter over 7-by-7 neighboring voxels was applied to the transaxial PET images to reduce statistical noise (Fig. 11). It should be finally noticed that in both measurement and prediction the density gradient between PMMA and bone does not lead to an appreciable variation of the activity level. This is due to the different composition in carbon (cf. Table I) and the partial compensation of the reduced 11C contribution by the production of 38K in the calcium rich bone equivalent insert.
Fig. 10.
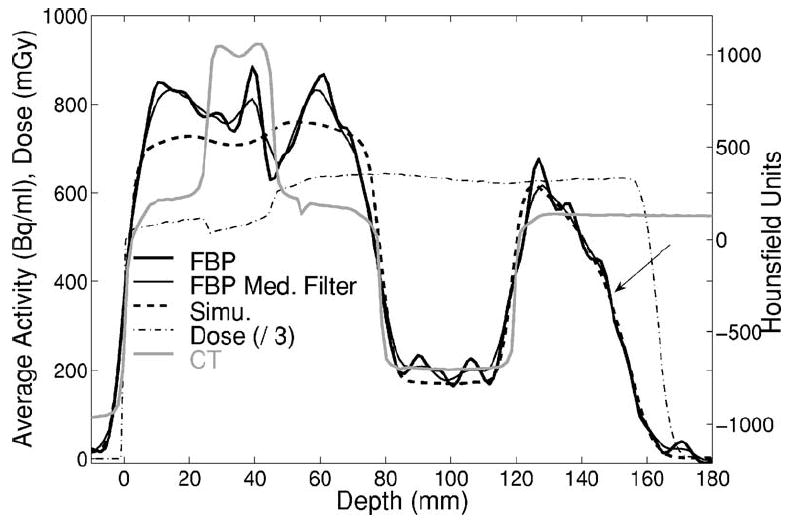
Measured (solid, thick without and narrow with additional median filter) and predicted (dashed) activity depth distributions in addition to the dose (dashed-dotted, divided by a factor 3) and CT (gray) profiles for the irradiation of the inhomogeneous phantom. The arrow indicates the 50% falloff.
Fig. 11.
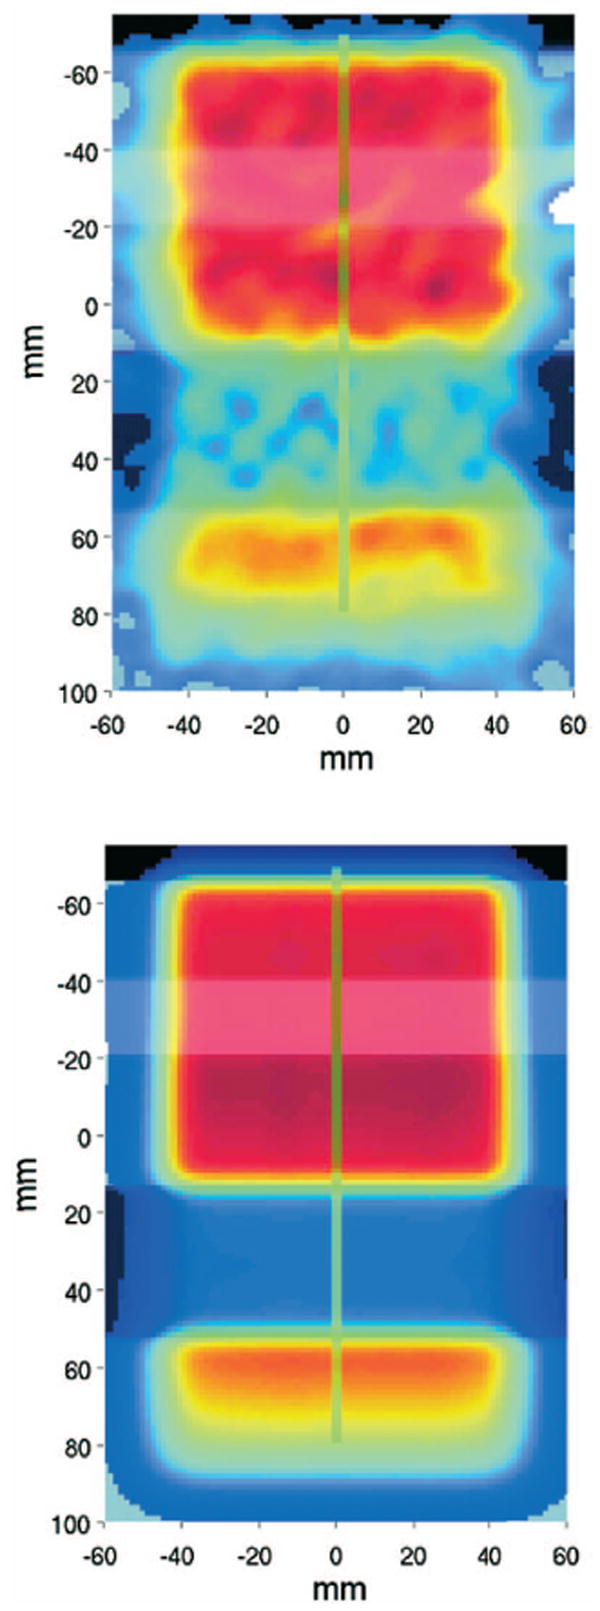
Top: Measured activity obtained from FBP of the entire data acquisition for the 2 Gy irradiation of the inhomogeneous phantom consisting of PMMA, bone equivalent, PMMA, lung equivalent and PMMA slabs along the beam path (from top to bottom). A median filter over 7-by-7 neighborhood voxels was applied to reduce statistical noise. Bottom: Corresponding MC prediction. Green lines mark the position of the depth profiles of Fig. 10.
3. Phantom with metallic implants
Measured activity depth profiles in the phantom with the titanium rods (Fig. 12) are compared with the perfect geometry MC simulation (I) in Fig. 13. The profiles were averaged over ±3 mm (transaxial) and ±9 mm (axial, parallel to the rods) as a compromise between reduced statistical fluctuations and small diameter of the rods. An agreement within 1 mm was observed for the depths of the 50% falloff, independent of the sampling position of the profiles. The comparison to the CT-based MC and analytical calculations will be separately addressed in Sec. IV E.
Fig. 12.
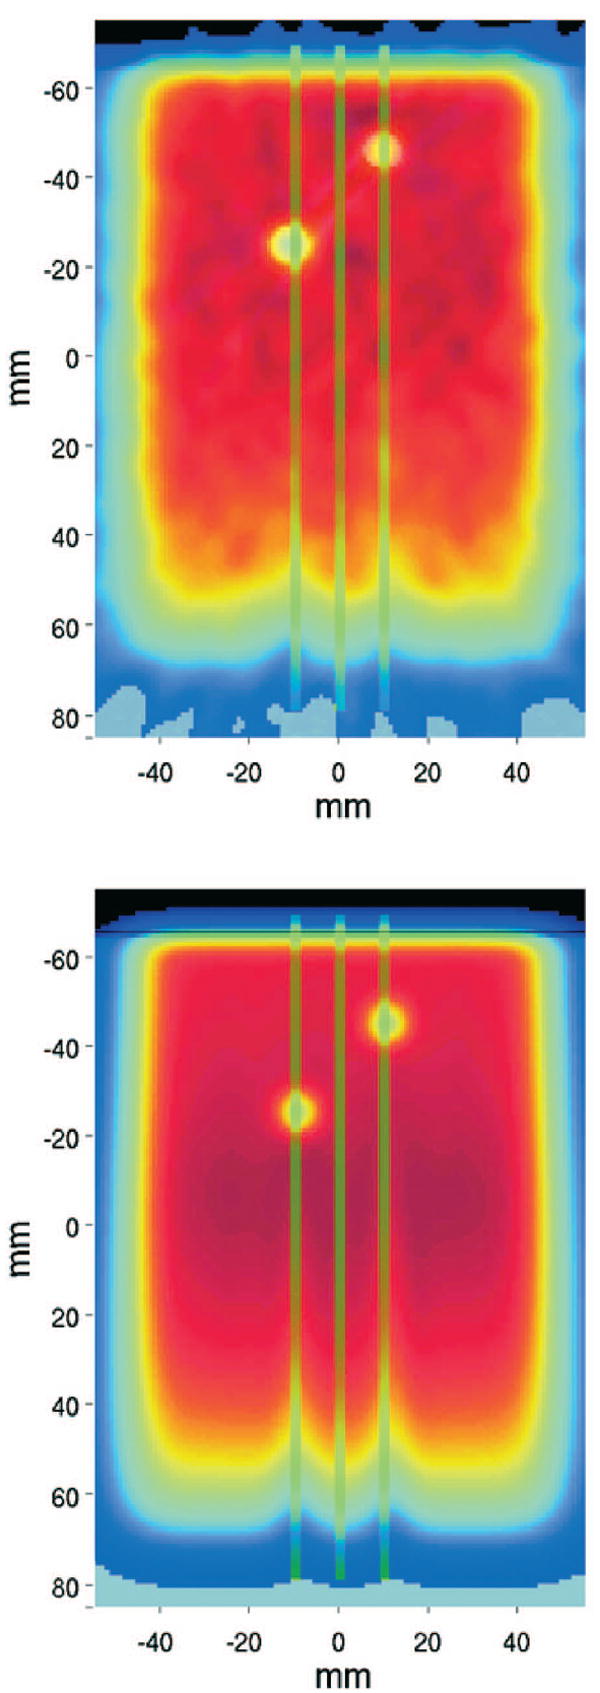
Top: Measured PET/CT image obtained from FBP of the entire data acquisition for the 8 Gy irradiation of the PMMA phantom with Ti implants. Bottom: Simulated activity distribution using the combinatorial geometry description of the target (I). Green lines mark the position of the depth profiles of Fig. 13. Left and right lines cross rod a and rod b of Fig. 1, respectively. The central line is in pure PMMA.
Fig. 13.
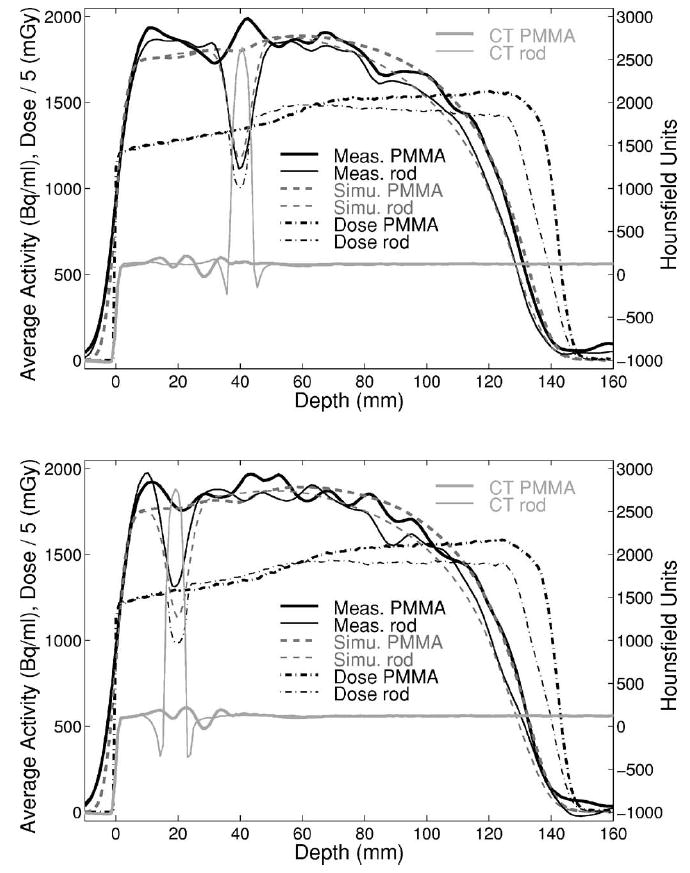
Measured activity (solid line) against the MC activity (dashed) and dose (dash-dotted, divided by a factor 5) perfect geometry predictions (I). Depth profiles crossing and not crossing the two rods at two different axial positions are shown by narrow and thick lines, respectively. Corresponding CT profiles are displayed in light gray.
D. Lateral activity distributions
The lateral extension of the delivered fields was deduced from the 50% falloff position of activity profiles perpendicular to the beam direction. The broadening in depth of the measured activity distribution due to the beam divergence and lateral scattering was found to agree with the MC prediction within better than 1 mm for the single field exposure of pure PMMA (Fig. 14). The data points show the average width of transaxial (with respect to the tomograph) lateral profiles taken at several axial positions but the same beam penetration depth. The uncertainties are clearly influenced by the counting statistics, which affect the search of the maximum as well as the shape and steepness of the falloff of the analyzed lateral profiles. Nevertheless, good agreement was also found for profiles reconstructed only from the last 20 min of the 60 min acquisition, as shown in Fig. 14, bottom. As already reported in previous works,14,15 the width of the measured and predicted activity agrees well with the calculated dose distribution.
Fig. 14.
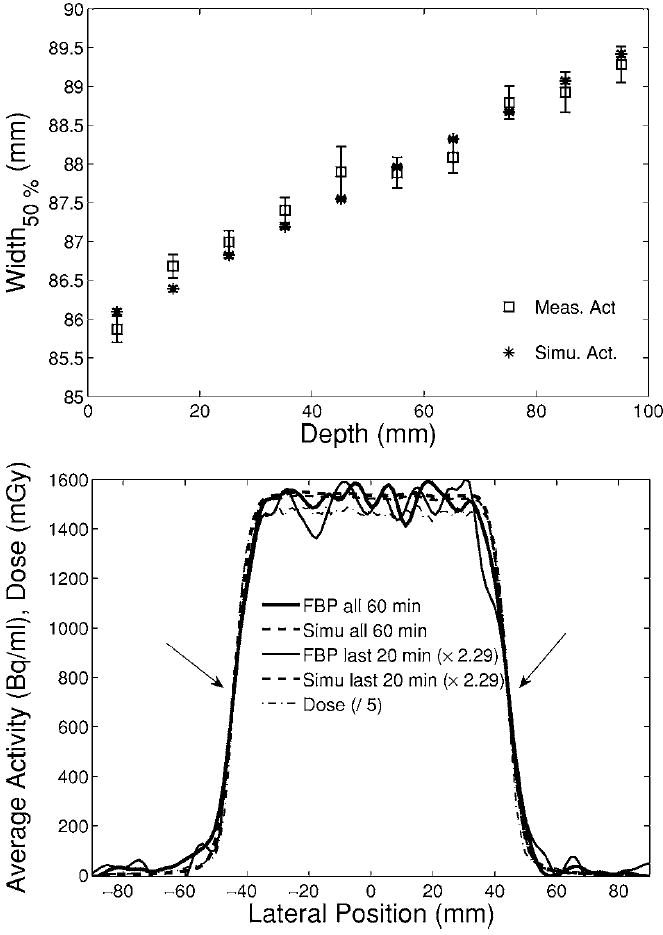
Top: Broadening in depth of the average width (squares: measurement, stars: simulation) of lateral profiles axially sampled in the interval [−15, 15] mm from the center of the distributions at each depth. Bottom: Example of measured (solid) and simulated (dashed) activity profile at the isocenter (65 mm depth) for the entire 60 min (thick) or only the last 20 min (thin, scaled by 2.29) acquistion. The arrows mark the 50% falloff position. The dash-dotted line shows the predicted dose profile (divided by 5).
E. PET versus CT-based MC and TP calculations with metallic implants
For the experiment with the titanium implants, measured activity depth and lateral profiles were additionally compared to CT-based MC and analytical activity and dose calculations, respectively, to address (i) the influence of CT artifacts on PET measurements using CT-based attenuation corrections versus CT-based MC and TP calculations as well as (ii) the sensitivity of all methods to fluence perturbations beyond the rods. Both topics are clinically relevant in terms of correct coverage of the target volume.
For the CT-based Monte Carlo approach (III) implementing the same calibration curve of the treatment planning program as for future clinical application, a direct comparison with the PET measurement was, however, found to be unfeasible. The used calibration curve is based upon measurements in real tissue and tissue substitutes for applications to therapy. Because of the differences between PMMA and real tissue, the curve assigns to the HU value of PMMA (HU≈130) a stopping power about 5% lower than the correct value, causing a range overestimation in the calculation. However, we did not attempt to establish a new calibration curve, since the aim of this work is neither the validation of the treatment plan calibration curve nor its extension to phantom materials. Similar considerations apply to the usage of the CT conversion into elemental composition from Ref. 38. This was also deduced from real tissue samples and therefore leads to a different stoichiometry than PMMA, causing an erroneous activity quantification. Nevertheless, the two questions above could be answered by analysis of the relative variations of calculated activity and dose depth and lateral profiles taken in different artifact regions and at different depths beyond the rods in comparison to the PET measurements.
1. Influence of CT artifacts
Activity and depth dose profiles were selected in the central transaxial imaging plane at different lateral positions so that they crossed different artifact regions in PMMA, but not the rods themselves (Fig. 15). In this choice we exploited the symmetry of the problem in the axial direction that resulted from the chosen orientation of the rods parallel to the tomograph axis (as for typical stabilization implants in the spine) in both acquisitions at the PET/CT and at the CT scanner used for treatment planning purposes. Since the artifacts of both CT data sets were found to be almost indistinguishable (cf. CT of the PET/CT measurement in Fig. 12 versus the planning CT in Fig. 15), only the planning CT is shown in Fig. 16. Similar to Fig. 13, the profiles were averaged over ±3 mm (transaxial) and ±7.5 mm (axial).
Fig. 15.
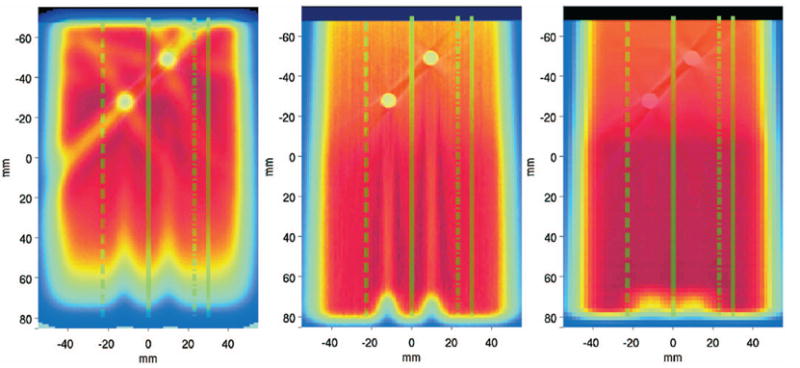
Transaxial views of CT-fused activity (left) and dose (middle) distributions calculated by Monte Carlo (III) against the planned dose delivery (right) for the exposure of PMMA with metallic implants. All calculations were based on the shown planning CT and should be compared to the corresponding PET/CT measurement shown in Fig. 12, top. The lines denote the position of the considered depth profiles shown in Fig. 16, crossing different artifact regions.
Fig. 16.
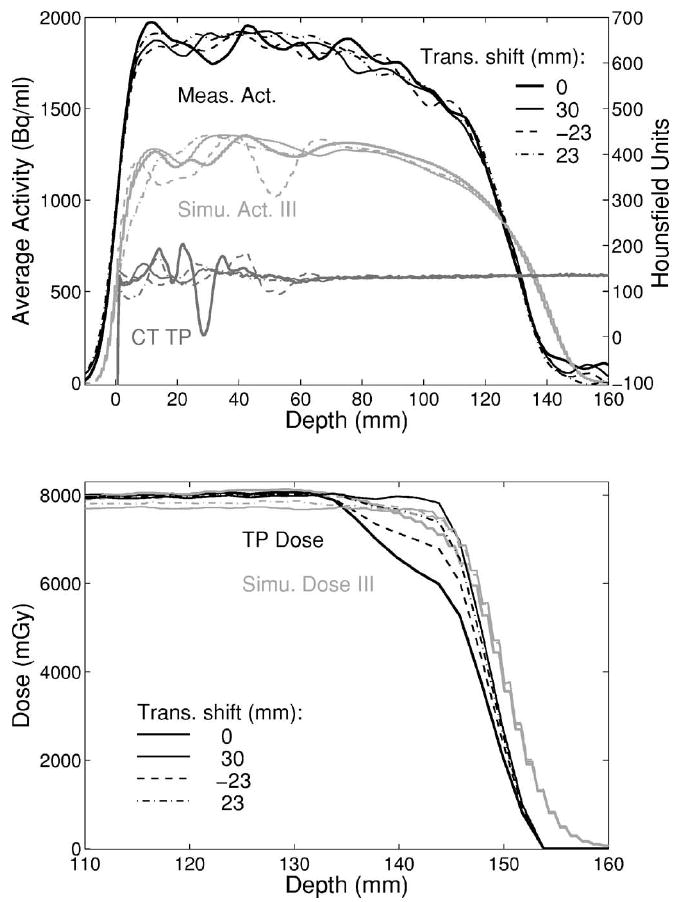
Top: Measured (black) and simulated (light gray) activity for profiles in PMMA crossing CT artifacts (gray, from planning CT). The shown Monte Carlo (III) implements the same CT calibration curve as the treatment planning program, leading to the discussed over range (cf. text). Bottom: Corresponding simulated dose profiles (light gray) against the treatment plan calculations (black) in the distal region of the delivered field.
No remarkable differences were found between the distal falloffs of the measured activity profiles. The same applies to the activity and the dose distributions predicted using the CT-based Monte Carlo approach (III), apart from a slight change of the SOBP slope for central dose profiles due to the influence of the two nearby rods (Fig. 16). On the contrary, differences are clearly observed in the distal position and shape of the planned dose profiles. The effect is more pronounced in the inner part of the field and almost disappears in the marginal part, although artifacts are still present (cf. profile at 0 and 30 mm shift in Fig. 16). A general interpretation of these findings will be addressed in the discussion.
The proximal part of the measured activity distributions indicates that the erroneous CT-based attenuation correction only marginally influences the accuracy of the quantification in the PET measurement. On the other hand, the artifacts and even small fluctuations of the CT numbers outside the artifact region may considerably affect the MC predicted amount of produced activity in homogeneous PMMA (Figs. 15 and 17, top). A larger variation is particularly visible when the HU values drop from the 120≤HU<200 to the 83≤HU<120 interval,38 because of the remarkable difference in the carbon relative density (i.e., medium mass density times carbon fraction by weight), as shown in Fig. 17, bottom.
Fig. 17.
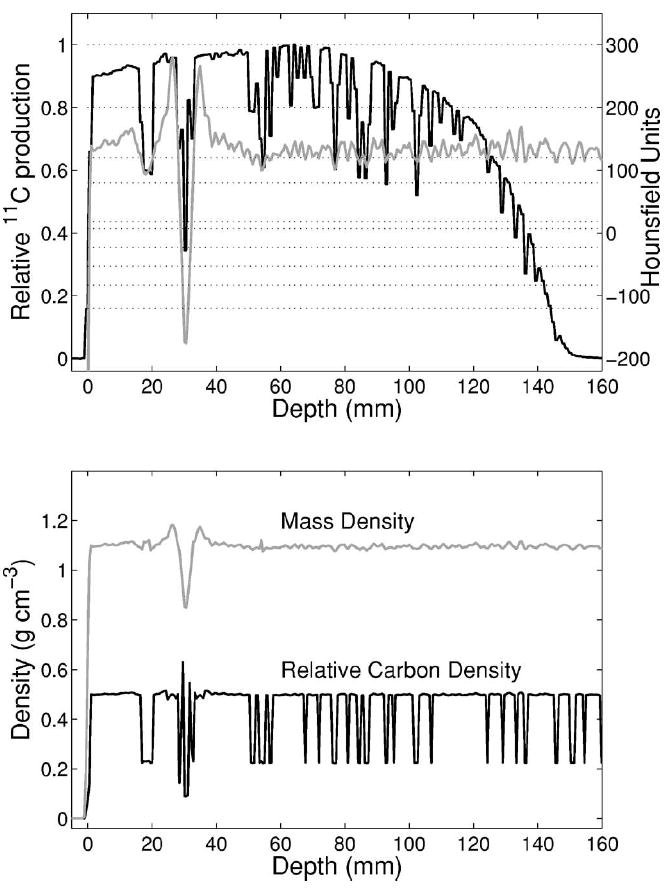
Top: Monte Carlo predicted (III) 11C production (black, no smoothing) along the depth corresponding to the shown CT profile (light gray) in PMMA when using the CT conversion to density and elemental composition of Ref. 38. The considered HU intervals (Ref. 38) are separated by the dotted lines. Bottom: Corresponding variation of the mass and relative carbon density along the penetration depth. A considerable drop of carbon density appears for the HU transition below 120 due to artifacts or statistical fluctuations of the measured CT values.
2. Shadowing effect
Measured lateral activity profiles taken at different beam penetration depths from the isocenter in the transaxial imaging plane of Fig. 12 are compared to the corresponding Monte Carlo activity and dose predictions as well as treatment plan dose calculations (cf. Fig. 15) in Fig. 18. The integration region of the shown profiles is less than 1 mm along the depth and up to 12 mm in the axial direction.
Fig. 18.
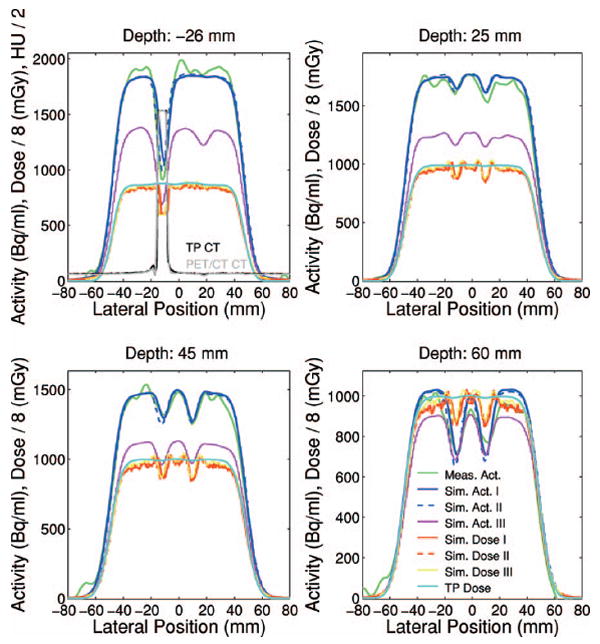
Measured (green) and Monte Carlo calculated (blue solid: combinatorial geometry I, blue dashed: coarse CT segmentation II, magenta: CT-based III using the segmentation of Ref. 38 and the TP calibration curve) activity lateral profiles together with Monte Carlo (red solid: I, red dashed: II, yellow: III) and analytical (celeste) dose calculations (divided by a factor 8) at different depths from the isocenter (cf. origin of coordinate system in Figs. 12 and 15) for the irradiation of PMMA with metallic inserts. The first panel additionally shows the co-registered CTs from the PET/CT (gray) and treatment planning (black).
Despite the statistical fluctuations, the measured profiles clearly show deeper valleys at larger penetration depths due to the fluence perturbation beyond the titanium rods. The peak to valley amplitudes are in good agreement with the Monte Carlo predictions (I) and (II), utilizing the ideal description of the phantom. The Monte Carlo calculation (III) is shown for reference comparison to the treatment plan. In fact it exhibits a reduction of the peak to valley amplitudes in comparison to the perfect geometry predictions at a given depth, because of the discussed over range resulting from the usage of the calibration curve. Nevertheless, the planned dose distribution is found to be almost insensitive to the shadowing effect, in addition to a constant overestimation versus Monte Carlo because of the differences between dose to water and dose to tissue. Indeed, a dose reduction due to the presence of the metallic implants starts to appear only in the very distal part (depth ≥70 mm from the isocenter) of the planned dose distribution, corresponding to an almost zero signal of the PET measurement (cf. Figs. 12 and 15).
The lateral widths of all considered measured and calculated profiles were found in submillimeter agreement with each other. With respect to the irradiation of pure PMMA, the larger air gap (i.e., distance between the distal edge of the beam aperture and the entrance surface of the phantom) of 30.8 cm as opposed to 14.0 cm resulted in about 8 mm increased lateral width at the isocenter (cf. Fig. 14).
V. DISCUSSION
A. Quantification of the produced activity
Our quantitative estimation of 11C activity production in PMMA is comparable to an earlier finding,15 quoting a 11C activation of about 3 kBq/ml in polyethylene (CH2, PE) after 2 min delivery of a 2.5 GyE SOBP (50 mm wide) at 191 MeV maximum energy. Neglecting the dependence on the SOBP energy and extension, the 11C isotope production from the main (p,pn) reaction channel is directly proportional to the carbon relative density of the irradiated material. Rescaling the value of Ref. 15 to the PMMA composition leads to about 1 kBq/ml/Gy activity produced after 6 min irradiation, if using a conversion factor of 1.1 between Gy and GyE and correcting for the different irradiation time.
In a similar way, our estimate of 11C activity production in PMMA might be rescaled to real tissue by using the ratio of carbon relative density, which varies from 0.16 in skeletal muscle up to 0.73 in compact bone and 0.83 in adipose tissue.41 For the same irradiation time of 6 min, this would correspond to about 0.3 up to 1.4 kBq/ml activity to be produced after 2 Gy treatment of a patient and be available for detection, within the limitations of the physical and biological42 half life. Besides the possible formation of other long-lived isotopes such as 13N and 38K, additional 11C activation can be produced via other minor reaction channels on isotopes different than carbon. For example, the 16O(p,3p3n)11C reaction becomes more relevant in tissues like muscle, poor in carbon but much richer in oxygen than PMMA. In combination with the shown images for the 2 Gy irradiation of the inhomogeneous phantom, these values and considerations support the clinical feasibility of the proposed off-line imaging approach. Clearly, counting statistics and image quality greatly benefit from the ready availability of the detector after irradiation.
B. Quantification of the LSO background
Despite the quantified considerable background noise due to the intrinsic LSO radioactivity, the low counting statistics images acquired for only 20 min starting about 20 min after low dose exposures were found to be usable. From the previous quantitative estimation and the chosen thickness of the phantoms (corresponding to a mean attenuation of the annihilation photons by about 90%), the presented low statistics data can be already considered representative of clinical situations, especially for head and neck cases. Hence these results support the applicability of the latest generation LSO-based PET scanner used in this study to off-line proton therapy monitoring. It should be noticed that the block detectors of this system already use pico electronics, which translates into more efficient random suppression and better image quality. However, considering the further reduction of the measurable signal due to the biological decay or larger attenuation in extra-cranial sites, improved noise suppressing reconstruction techniques are desirable for clinical applications. Very recent advances exploting time-of-flight information might serve this purpose and considerably improve the image quality.43
C. Range monitoring
As in previous works11,15 we have focused our range analysis on the position of the 50% falloff for single portals. Although for extended fields the 50% falloff value is mostly affected by the width of the SOBP rather than the maximum range of interest,11 the analysis of the very distal edge (≤10% falloff) of the profiles was found to be problematic due to noise and statistical fluctuations at the very low distal activity levels (e.g., cf. Fig. 10). Moreover, we observed that the very distal part of the activity profile is more sensitive to the knowledge of both the beam energy spread after the transversal of the modifier devices as well as the modeling of the PET system response function. Nevertheless, for overlapping fields our analysis had to be reduced to the positions within the 30%–10% falloff, to exclude the lateral contribution of the second beam. An optimal robust strategy insensitive to the statistical noise and to the modeling uncertainties is necessary for clinical applications.
D. PET versus CT-based MC and TP calculations with metallic implants
The absence of observable differences in the distal falloff positions of measured and Monte Carlo predicted activity profiles in the presence of CT artifacts was as expected for the PET measurements, because of the artifacts location far away from the distal region. However, the chosen configuration is realistic and enforces the potential of PET/CT as a range monitoring tool insensitive to the presence of CT artifacts. For the CT-based MC prediction (III) the finding is ascribed to the compensation of the HU numbers in the artifact region to the average HU value measured in PMMA, in combination with the piecewise linearity of the calibration curve. However, this compensation to the correct average value of the underlying medium may not be as accurate in patients. Hence, further studies under more realistic conditions are desirable. These should also explore the validity of available algorithms for correction of CT artifacts and could greatly profit from the increasing availability of clinical data with reduced artifacts from megavoltage CT.44
For the depth dose distributions, systematic discrepancies between the treatment planning and Monte Carlo calculations were observed, with larger deviations for profiles taken in the central part of the field. In combination with the results presented for the lateral dose profiles, the reason appears to be a general limitation of the pencil beam algorithm in handling the perturbation due to the metallic inserts rather than a pure CT-artifact effect. This finding deserves a more detailed dosimetric analysis which is beyond the purpose of this paper and which is the subject of ongoing work.
Monte Carlo calculations validated against experimental depth dose curves in water and combined with the same calibration curve of the treatment planning system are generally found in good correspondence with the treatment planning dose calculations in the absence of metallic implants.35,45 However, the discrepancies observed in this work suggest the importance of using the same Monte Carlo engine also to re-calculate the dose deposition instead of the solely expected activation5,6 for clinical applications of PET. Only in this way can the comparison between measured and Monte Carlo calculated PET images give a true feedback on the correct deposition of the intended (i.e., planned) dose, separating possible effects coming from the different dose calculation models of the treatment planning and Monte Carlo algorithms. Alternative analytical approaches directly using the treatment planning dose are currently under investigation.7
In view of clinical applications of CT-based PET Monte Carlo calculations, these data also point out issues related to the conversion formalism from CT numbers to tissue elemental composition. Special care is required in real inhomogeneous tissues to separate true stoichiometric variation from mere fluctuations of the measured HU values. In combination with uncertainties in the knowledge of the chemical composition and biological parameters influencing the kinetics of the activated isotopes, this might represent an important limitation to the achievable accuracy for quantification of the predicted activity in patients. However, this is not expected to affect the accuracy of the range prediction especially in the case of off-line imaging. In this latter application, the limited number of reaction channels yielding detectable long-lived emitters reduces the time dependent influence of tissue elemental composition and reaction cross sections on the activity profiles pointed out by online measurements.10,11
VI. CONCLUSION
The presented experimental phantom investigation supports the potential of off-line PET/CT for millimeter accuracy in verification of the range and the lateral position of the dose delivery in proton irradiation. The quantitative estimation of the activity production supports the applicability to clinical cases (especially for HN), despite the relatively long delay between irradiation and imaging. High resolution, fast LSO technology has been demonstrated to provide usable images even at low counting statistics after low dose exposure and limited acquisition time, despite the considerable background noise due to the intrinsic radioactivity. However, improved noise suppressing reconstruction techniques are desirable and might benefit from the latest advances, e.g., exploiting time-of-flight information.
PET/CT monitoring has been applied for the first time to proton irradiation in the presence of metallic implants. The results indicate the potential of the method for range verification even in the presence of CT artifacts, despite the usage of CT-based attenuation corrections. Furthermore, they demonstrate a sensitivity to the shadowing effect higher than a commercial treatment planning program.
Accuracy and limitations of off-line PET/CT imaging and CT-based Monte Carlo calculations (III) in applications to patients are currently under investigation in a clinical trial which will be reported separately.
Acknowledgments
The authors wish to thank C. Watson from CPS Innovation (now Siemens Molecular Imaging) for answering many questions on the CPS/Siements Biograph Sensation 16. From Massachusetts General Hospital they acknowledge G. Multon and Z. Levin for support in the PACS transfer of the data between the departments of Radiology and Radiation Oncology, J. Sisterson for providing data on nuclear cross sections, N. Liebsch for supplying the Ti rods and giving advice on the experimental configuration, J. Wolfgang for organizing the CT scan of the Ti phantom and S. Kollipara for performing the FOCUS/XiO treatment plan and helping with the rigid image co-registration. Finally, they are grateful to A. Ferrari and F. Sommerer from CERN, Switzerland, for developing and providing the experimental FLUKA version with the adjustable scaling factors. This work was supported by NCI Grant No. 5 P01 CA21239-25 for Proton Radiation Therapy Research.
APPENDIX: THE SEPARATION OF ISOTOPE CONTRIBUTIONS
The measured decay curves were fitted over the time t≥t0,acq by a linear superimposition of exponential functions ΣjNfj exp[−λj(t−t0,acq)], where N is a normalization constant to the initial (i.e., at the start of acquisition t0,acq) activity or count rate and f j is the unknown initial fraction of activity or count rate from the isotope j of known decay constant λj(Σjf j=1). As an alternative approach, the 11C component was identified as the unique contribution to the signal at the end of the acquisition. The minor amount of unknown shorter-lived isotopes was recovered by analyzing the slope of the initial part of the decay after subtraction of the dominant 11C signal. Both methods are particularly feasible and accurate for the longest 60 min acquisitions following the highest 8 Gy dose exposures. However, uncertainties remain for the separation of the shorter-lived components, due to their minor contribution to the activity signal, which is clearly dominated by 11C.
From the knowledge of the initial fraction f j of each isotope j and the average activity A measured in a given time frame it was possible to quantify the initial activity A0,acq. To improve the accuracy of the estimation we exploited several average activities Ai measured in the same ROI at different arbitrary time frames i of duration tframei starting at t0,framei:
| (A1) |
where σi is the standard deviation of Ai. From the estimate of A0,acq and the relative fractions f j, the amount of activity Aend,j produced at the end of irradiation tend for each isotope j in the selected ROI could be finally extrapolated to
| (A2) |
References
- 1.Antonuk LE. Electronic portal imaging devices: A review and historical perspective of contemporary technologies and research. Phys Med Biol. 2002;47:R31–65. [PubMed] [Google Scholar]
- 2.Chen GTY, Singh RP, Castro JR, Lyman JT, Quivey JM. Treatment planning for heavy ion radiotherapy. Int J Radiat Oncol Biol Phys. 1979;5:1809–1819. doi: 10.1016/0360-3016(79)90564-9. [DOI] [PubMed] [Google Scholar]
- 3.Schaffner B, Pedroni E. The precision of proton range calculations in proton radiotherapy treatment planning: Experimental verification of the relation between CT-HU and proton stopping power. Phys Med Biol. 1998;43:1579–1592. doi: 10.1088/0031-9155/43/6/016. [DOI] [PubMed] [Google Scholar]
- 4.Jäkel O, Jakob C, Schardt D, Karger CP, Hartmann GH. Relation between carbon ion ranges and x-ray CT numbers. Med Phys. 2001;28:701–703. doi: 10.1118/1.1357455. [DOI] [PubMed] [Google Scholar]
- 5.Enghardt W, Debus J, Haberer T, Hasch BG, Hinz R, Jäkel O, Krämer M, Lauckner K, Pawelke J, Pönisch F. Positron emission tomography for quality assurance of cancer therapy with light ion beams. Nucl Phys A. 1999;654:1047–1050. [Google Scholar]
- 6.Pönisch F, Parodi K, Hasch BG, Enghardt W. The description of positron emitter production and PET imaging during carbon ion therapy. Phys Med Biol. 2004;49:5217–5232. doi: 10.1088/0031-9155/49/23/002. [DOI] [PubMed] [Google Scholar]
- 7.Parodi K, Bortfeld T. A filtering approach based on Gaussian-power law convolutions for local PET verification of proton radiotherapy. Phys Med Biol. 2006;51:1991–2009. doi: 10.1088/0031-9155/51/8/003. [DOI] [PubMed] [Google Scholar]
- 8.Enghardt W, Crespo P, Fiedler F, Hinz R, Parodi K, Pawelke J, Pönisch F. Charged hadron tumor therapy monitoring by means of PET. Nucl Instrum Methods Phys Res A. 2004;525:284–288. [Google Scholar]
- 9.Enghardt W, Parodi K, Crespo P, Fiedler F, Pawelke J, Pönisch F. Dose quantification from in-beam positron emission tomography. Radiother Oncol. 2004;73:S96–S98. doi: 10.1016/s0167-8140(04)80024-0. [DOI] [PubMed] [Google Scholar]
- 10.Parodi K, Enghardt W, Haberer T. In-beam PET measurements of β+-radioactivity induced by proton beams. Phys Med Biol. 2002;47:21–36. doi: 10.1088/0031-9155/47/1/302. [DOI] [PubMed] [Google Scholar]
- 11.Parodi K, Pönisch F, Enghardt W. Experimental study on the feasibility of in-beam PET for accurate monitoring of proton therapy. IEEE Trans Nucl Sci. 2005;52:778–786. [Google Scholar]
- 12.Litzenberg DW, Bajema JF, Becchetti FD, Brown JA, Roberts DA, Caraher J, Hutchins G, Ronningen R, Smith R, Abbot M. On-line monitoring and PET imaging of proton radiotherapy beams. Conference Records from IEEE Medical Imaging Conference; Orlando, FL. 1992; pp. 954–956. [Google Scholar]
- 13.Paans AMJ, Schippers JM. Proton therapy in combination with PET as monitor: A feasibility study. IEEE Trans Nucl Sci. 1993;40:1041–1044. [Google Scholar]
- 14.Oelfke U, Lam GKY, Atkins MS. Proton dose monitoring with PET: Quantitative studies in Lucite. Phys Med Biol. 1996;41:177–196. doi: 10.1088/0031-9155/41/1/013. [DOI] [PubMed] [Google Scholar]
- 15.Nishio T, Sato T, Kitamura H, Murakami K, Ogino T. Distributions of β+ decayed nuclei generated in the CH2 and H2O targets by target nuclear fragment reaction using therapeutic MONO and SOBP proton beam. Med Phys. 2005;32:1070–1082. doi: 10.1118/1.1879692. [DOI] [PubMed] [Google Scholar]
- 16.Vynckier S, Derreumaux S, Richard F, Bol A, Michel C, Wambersie A. Is it possible to verify directly a proton-treatment plan using positron emission tomography? Radiother Oncol. 1993;26:275–277. doi: 10.1016/0167-8140(93)90271-9. [DOI] [PubMed] [Google Scholar]
- 17.Hishikawa Y, Kagawa K, Murakami M, Sakai H, Akagi T, Abe M. Usefulness of positron-emission tomographic images after proton therapy. Int J Radiat Oncol Biol Phys. 2002;53:1388–1391. doi: 10.1016/s0360-3016(02)02887-0. [DOI] [PubMed] [Google Scholar]
- 18.Ludziejewski T, Moszynska K, Moszynski M, Wolski D, Klamra W, Norlin LO, Devitsin E, Kozlov V. Advantages and limitations of LSO scintillator in nuclear physics experiments. IEEE Trans Nucl Sci. 1995;42:328–336. [Google Scholar]
- 19.Yamamoto S, Hitoshi H, Hurutani M, Matsumoto K, Senda M. Investigation of single, random and true counts from natural radioactivity in LSO-based clinical PET. Ann Nucl Med. 2005;19:109–114. doi: 10.1007/BF03027389. [DOI] [PubMed] [Google Scholar]
- 20.Watson CC, Casey M, Eriksson L, Mulnix T, Adams D, Bendriem B. NEMA NU 2 performance tests for scanners with intrinsic radioactivity. J Nucl Med. 2004;45:822–826. [PubMed] [Google Scholar]
- 21.Erdi YE, Nehmeh SA, Mulnix T, Humm JL, Watson CC. PET performance measurements for an LSO-based combined PET/CT scanner using National Electrical Manufacturers Association NU 2-2001 standard. J Nucl Med. 2004;45:813–821. [PubMed] [Google Scholar]
- 22.Fassò A, Ferrari A, Sala PR. In: Kling A, Barao F, Nakagawa M, Tavora L, Vaz P, editors. Electron-photon transport in FLUKA: status; Proc Monte Carlo 2000 Conference; Lisbon. Berlin: Springer-Verlag; 2001. pp. 159–164. [Google Scholar]
- 23.Fassò A, Ferrari A, Ranft J, Sala PR. In: Kling A, Barao F, Nakagawa M, Tavora L, Vaz P, editors. FLUKA: Status and prospective for hadronic applications; Proc Monte Carlo 2000 Conference; Lisbon. Berlin: Springer-Verlag; 2001. pp. 955–960. [Google Scholar]
- 24.Iljinov AS, Semenov VG, Semenova MP, Sobolevsky NM, Udovenko LV. Landolt-Börnstein New Series Group I. 13a. Springer-Verlag; Berlin: 1991. Production of radionuclides at intermediate energies. [Google Scholar]
- 25.Kitwanga SW, Leleux P, Lipnik P, Vanhorenbeeck J. Production of 13N radioactive nuclei from 13C(p,n) or 16O(p,α) reactions. Phys Rev C. 1989;40:35–83. doi: 10.1103/physrevc.40.35. [DOI] [PubMed] [Google Scholar]
- 26.Albouy G, Cohen JP, Gusakow M, Poffe N, Sergolle H, Valentin L. Spallation de l’oxygene par des protons de 20 a 150 MeV. Phys Lett. 1962;2:306–307. [Google Scholar]
- 27.Kettern K, Shubin YuN, Steyn GF, van der Walt TN, Coenen HH, Qaim SM. Formation of short-lived positron emitters in reactions of protons of energies up to 200 MeV with the target elements carbon, nitrogen and oxygen. Appl Radiat Isot. 2004;60:939–945. doi: 10.1016/j.apradiso.2004.02.007. [DOI] [PubMed] [Google Scholar]
- 28.Sisterson J, Koehler AM, Eilbert RF. 40Ca(p,2pn)38K total nuclear cross section. Phys Rev C. 1978;18:582–583. [Google Scholar]
- 29.IAEA International atomic energy agency. Charged particle cross-section database for medical radioisotope production: Diagnostic radioisotopes and monitor reactions. IAEA-TECDOC-1211; Vienna. May 2001; 2001. [Google Scholar]
- 30.EXFOR/CSISRS. Experimental nuclear reaction data. 2005 http://www.nndc.bnl.gov/nndc/exfor/
- 31.Agostinelli S, et al. GEANT4—a simulation toolkit. Nucl Instrum Methods Phys Res A. 2003;506:250–303. [Google Scholar]
- 32.Paganetti H, Jiang H, Lee S-Y, Kooy H. Accurate Monte Carlo simulations for nozzle design, commissioning and quality assurance for a proton radiation therapy facility. Med Phys. 2004;31:2107–2118. doi: 10.1118/1.1762792. [DOI] [PubMed] [Google Scholar]
- 33.Berger MJ. Report NISTIR No. 5226. National Institute of Standards and Technology, Physics Laboratory; Gaithersburg, MD: 1993. Penetration of proton beams through water I. Depth-dose distribution, spectra and LET distribution. [Google Scholar]
- 34.Knopf A. Master’s thesis. RuprechtKarls University; Heidelberg, Germany: 2005. Analysis of dose distributions: A comparison between the calculation programs GEANT4 and KONRAD. [Google Scholar]
- 35.Jiang H, Paganetti H. Adaption of GEANT4 to Monte Carlo dose calculations based on CT data. Med Phys. 2004;31:2811–2818. doi: 10.1118/1.1796952. [DOI] [PubMed] [Google Scholar]
- 36.Paganetti H, Gottschalk B. Test of GEANT3 and GEANT4 nuclear models for 160 MeV protons stopping in CH2. Med Phys. 2003;30:1926–1931. doi: 10.1118/1.1586454. [DOI] [PubMed] [Google Scholar]
- 37.Hong L, Goitein M, Bucciolini M, Comiskey R, Gottschalk B, Rosenthal S, Serago C, Urie M. A pencil beam algorithm for proton dose calculations. Phys Med Biol. 1996;41:1305–1330. doi: 10.1088/0031-9155/41/8/005. [DOI] [PubMed] [Google Scholar]
- 38.Schneider W, Bortfeld T, Schlegel W. Correlation between CT numbers and tissue parameters needed for Monte Carlo simulations of clinical dose distributions. Phys Med Biol. 2000;45:459–478. doi: 10.1088/0031-9155/45/2/314. [DOI] [PubMed] [Google Scholar]
- 39.Fassò A, et al. The physics models of FLUKA: status and recent developments. Proc Computing in High Energy and Nuclear Physics 2003 Conference; La Jolla, CA. 2003; paper MOMT005 eConf C0303241 arXiv:hep-ph/0306267. [Google Scholar]
- 40.Ferrari A, Sala PR, Fassò A, Ranft J. CERN Yellow Report No INFN/TC_05/11, SLAC-R-773. Geneva: 2005. FLUKA: A multi-particle transport code. [Google Scholar]
- 41.ICRU International Commission on Radiation Units and Measurements. Report No. 49. 1993. Stopping powers and ranges for protons and alpha particles; p. 198. [Google Scholar]
- 42.Tomitani T, et al. Washout studies of 11C in rabbit thigh muscle implanted by secondary beams of HIMAC. Phys Med Biol. 2003;48:875–889. doi: 10.1088/0031-9155/48/7/305. [DOI] [PubMed] [Google Scholar]
- 43.Conti M, Bendriem B, Casey M, Chen M, Kehren F, Michel C, Panin V. First experimental results of time-of-flight reconstruction on an LSO PET scanner. Phys Med Biol. 2005;50:4507–4526. doi: 10.1088/0031-9155/50/19/006. [DOI] [PubMed] [Google Scholar]
- 44.Albertini F, Bolsi A, Ares C, Broggi S, Cattaneo GM, Lomax T. Advantage of using a MVCT for proton planning. Abstracts from Particle Therapy Co-Operative Group 44 Meeting; Zurich, Switzerland. 2006; p. 61. [Google Scholar]
- 45.Ferrari A, et al. Update on the status of the FLUKA Monte Carlo transport code. Proc Computing in High Energy and Nuclear Physics 2006 Conference; Mumbai, India. 2006. [Google Scholar]


