

Abstract
We describe the first direct testing of the antimicrobial susceptibilities of bacterial pathogens in human clinical fluid samples by the use of ATP bioluminescence. We developed an ATP bioluminescence assay that eliminates somatic sources of ATP to selectively quantify the bacterial load in clinical urine specimens with a sensitivity of <1,000 CFU per milliliter. There was a log-log relationship between light emission and the numbers of CFU in clinical urine specimens. A clinical study was performed to evaluate the accuracy of the ATP bioluminescence assay for determination of the antimicrobial susceptibilities of uropathogens in clinical urine specimens tested in a blinded manner. ATP bioluminescent bacterial density quantitation was used to determine the inoculation volume in growth medium with and without antibiotics. After incubation at 37°C for 120 min, the ATP bioluminescence assay was repeated to evaluate the uropathogen response to antibiotics. The ability of the ATP bioluminescence assay to discriminate between antimicrobial susceptibility and resistance was determined by comparison of the results obtained by the ATP bioluminescence assay with the results obtained by standard clinical microbiology methods. Receiver operator characteristic curves were used to determine the optimal threshold for discriminating between susceptibility and resistance. Susceptibility and resistance were correctly predicted in 87% and 95% of cases, respectively, for an overall unweighted accuracy of 91%, when the results were stratified by antibiotic. For samples in which the pathogen was susceptible, the accuracy improved to 95% when the results for samples with less than a 25-fold increase in the amount of bacterial ATP in the medium without antibiotics were excluded. These data indicate that a rapid bioluminescent antimicrobial susceptibility assay may be useful for the management of urinary tract infections.
The urinary tract is the most common organ system to experience bacterial infections (17). As a major cause of patient morbidity and health care expenditures for men and women of all age groups, urinary tract infections (UTIs) account for 7 million office visits, more than 1 million emergency room visits, and 100,000 hospitalizations each year (20). The estimated annual cost to the U.S. health care system is approximately $1.6 billion (8). Patients with nosocomial and/or complicated UTIs due to abnormal urinary tract anatomy, the presence of indwelling foreign bodies, and obstructed kidney stones are at risk for life-threatening systemic infections and permanently reduced kidney function. Patients with recurrent community-acquired, simple UTIs may incur significant treatment costs and substantial morbidity due to bothersome symptoms, such as painful urination, frequency, and urgency.
The traditional basis for the evaluation of urinary tract pathogens (uropathogens) is urine culture and antibiotic susceptibility testing (13). The major drawback of the current microbiology approach is the time lapse of 2 to 3 days between specimen collection and the availability of objective evidence for treatment selection. Several days may pass before a definitive diagnosis is made and an objective treatment strategy can be implemented. In the absence of an expeditious laboratory diagnosis, clinicians usually initiate empirical antibiotic treatments without supportive laboratory evidence, even though up to 80% of the urine specimens sent to the clinical microbiology laboratories are negative for growth.
The injudicious, empirical use of antibiotics has contributed to the emergence of resistant uropathogens. Antibiotic resistance is a significant problem not only among nosocomial, complicated UTIs, where it has traditionally been recognized, but also in community-acquired, simple UTIs, where it has traditionally been absent (9). An example of the growing problem is the rapid emergence of trimethoprim-sulfamethoxazole (TMP-SMX)-resistant Escherichia coli in community-acquired UTIs. E. coli accounts for 85 to 90% of the UTIs in the community setting. Prior to the 1990s, β-lactams such as ampicillin were the standard antimicrobial regimen for acute uncomplicated UTIs but were replaced when the rate of E. coli resistance to β-lactams surpassed 25%. Since the early 1990s, TMP-SMX has become the standard regimen (28). With its increased use, however, resistance to TMP-SMX has increased substantially in the last 10 years, approaching a rate of 20% across the United States and a rate as high as 32% in Los Angeles, CA (7). Consequently, clinicians are now increasingly using quinolones such as ciprofloxacin empirically as the antibiotic of choice. At this time, community-acquired E. coli remains largely sensitive to quinolones, although there is a growing concern regarding the emergence of quinolone-resistant uropathogens (24), for which no satisfactory oral antibiotic is currently available.
A rapid diagnostic tool that can identify the presence of pathogens and their antibiotic sensitivity profile at the point of care would provide an urgently needed evidence-based approach to the clinical management of UTIs. First, only patients with a significant number of pathogens in the urine will be considered for treatment, obviating the unnecessary use of antibiotics for patients with urinary tract symptoms due to a noninfectious etiology. Second, the choice of antibiotics may be individually tailored. For example, patients infected with ampicillin-sensitive E. coli may be treated with ampicillin, even though 60% of the E. coli isolates in the community may be ampicillin resistant. A strategy of individualized treatment with wider choices of antibiotics will help to reduce the selection pressure toward the propagation of resistant pathogens. Lastly, with fewer negative urine cultures sent to the clinical microbiology laboratory and the reduced use of the more expensive, newer antibiotics (quinolones are five times more expensive than TMP-SMX), a rapid pathogen antimicrobial sensitivity test will decrease overall health care expenditures for UTIs.
Firefly lantern bioluminescence is produced by a biochemical reaction in which the luciferase enzyme utilizes ATP in the oxidation of luciferin to adenyloxyluciferin, with the concurrent release of photons in proportion to the amount of ATP that is converted to AMP. Application of the luciferase enzyme and its substrate, luciferin, to the detection and quantitation of bacteria was originally described by Chappelle and Levin, who used a luminometer to measure bioluminescence (as relative light units [RLU]) (1). Initial attempts to apply this methodology to the enumeration of bacteria in clinical urine specimens were hampered by a number of problems not encountered when cultured isolates were quantified (4, 12, 16, 25, 26). These problems included the presence in urine of free nonbacterial ATP, the intracellular ATP contained in somatic cells, and luciferase inhibitory substances and the variation in ATP content among bacterial species, all of which compromised the quantitative aspect of the assay. The quantitation of bacteria was greatly improved by using buffers and reagents for the release and destruction of nonbacterial ATP in clinical urine specimens. The reported threshold for positivity was 105 CFU/ml, with a sensitivity of 86 to 95%, a specificity of 75 to 82%, a positive predictive value of 36 to 77%, and a negative predictive value of 88 to 95% (6, 14, 21, 22, 29, 30).
The bacterial ATP bioluminescence methodology has been shown to be useful for the rapid (2- to 4-h) determination of the antibiotic susceptibilities of cultured clinical isolates (15, 27, 31, 32). In this study, we evaluated the analytic validity of bioluminescent antibiotic susceptibility testing of uropathogens in clinical urine specimens. A bacterium-specific ATP bioluminescence assay was used to estimate the bacterial density in clinical urine specimens from patients with UTIs to achieve a urine inoculum of 104 to 105 CFU/ml in growth medium with and without antibiotics. At the end of a 120-min incubation period, the bioluminescence assay was repeated to predict the susceptibilities of the uropathogens to antibiotics. We found an excellent correlation between the results obtained by the rapid bioluminescent antibiotic susceptibility technique and the results obtained by standard clinical microbiology methods. To our knowledge, this is the first report of the use of bacterial ATP bioluminescence to determine the antibiotic susceptibilities of bacterial pathogens in clinical specimens.
MATERIALS AND METHODS
Clinical urine specimens.
Clinical urine specimens were obtained from the University of California-Los Angeles (UCLA) Clinical Microbiology Laboratory with approval from the UCLA and the U.S. Department of Veterans Affairs Institutional Review Boards and appropriate Health Insurance Portability and Accountability Act exemptions. Routine plating on Trypticase soy agar with 5% sheep blood and MacConkey agar was performed with each specimen for colony counting and phenotypic identification tests. Antimicrobial susceptibility testing was performed by a CLSI broth dilution MIC reference method with panels prepared in-house (2, 3), while an aliquot of each specimen was held at 4°C overnight. On the day after they were plated, specimens were selected for inclusion in the study on the basis of the results of a rapid indole test for the purpose of including specimens containing uropathogens other than Escherichia coli in approximately one-half of the specimens. Because most UTIs involve a single uropathogen, specimens determined by the Clinical Microbiology Laboratory to have more than one organism were excluded. Blinded specimens selected for inclusion in the study were stripped of patient identifiers before delivery to the research laboratory for testing.
Bacterium-specific bioluminescence assay.
The strategy used for the selective determination of bacterial ATP by eliminating human sources of ATP from the bioluminescence assay was as follows: host cell ATP and free ATP were hydrolyzed by incubating 25 μl of urine with 50 μl of 0.1 U/ml ATPase in a buffered somatic extractant (Somase 3; Hygiena, Camarillo, CA) for 15 min at room temperature. Bacterial ATP was released by addition of 100 μl of the microbial extractant (Luminex; Hygiena), immediately followed by addition of 200 μl of the liquid-stable bioluminescence reagent (Hygiena). RLUs were measured with a Pi-102 luminometer (Hygiena) by use of a 1-s integration time. Background RLU levels, determined by using Trypticase soy broth (TSB), were subtracted from the specimen-derived RLU measurements.
Bioluminescent antimicrobial susceptibility testing.
The bacterial ATP bioluminescence assay was performed with clinical urine specimens received from the UCLA Clinical Microbiology Laboratory to estimate the density of bacteria in the specimen. Urine specimens were diluted 10-, 100-, or 1,000-fold to achieve a starting concentration of 104 to 105 CFU/ml in 100 ml of TSB. The inoculated TSB was divided into 5-ml aliquots to which ampicillin (32 μg/ml), cephalothin (32 μg/ml), ciprofloxacin (2 μg/ml), gentamicin (8 μg/ml), nitrofurantoin (128 μg/ml), TMP (3.2 μg/ml)-SMX (16 μg/ml), or vancomycin (32 μg/ml) was added. An eighth sample without antibiotics was included as a positive control for growth. The cultures were incubated at 37°C with agitation for 120 min. At the conclusion of the incubation period, the bioluminescence assay was repeated with each culture. The bioluminescent antimicrobial susceptibility testing results were compared with the clinical microbiology data after the experiment was completed.
Specimens excluded from the analysis were those containing multiple bacterial species, outpatient specimens containing Enterococcus spp. (because the Clinical Microbiology Laboratory does not perform antimicrobial susceptibility testing for these species), and specimens with insufficient bacteria to achieve a starting concentration of 104 to 105 CFU/ml. In addition, nine results that were classified as “intermediate” susceptibility by the Clinical Microbiology Laboratory were also excluded from the analysis because there were too few for a statistically meaningful analysis. For each specimen and antibiotic, background RLU values were first subtracted from the time zero and time 120 min RLU values. The log10-corrected RLU at time zero was subtracted from the log10-corrected RLU at time 120 min to estimate the change due to growth. The change value for the control was subtracted from the corresponding change value for each antibiotic, creating an antibiotic-minus-control difference. The antibiotic-minus-control difference should be more negative for antibiotic-resistant specimens than for antibiotic-susceptible specimens. The antilog of this difference is the ratio of the time 120 min RLU/time zero RLU for the antibiotic-containing specimens relative to that for the control specimen. Finally, a receiver operating characteristic curve analysis was carried out by using these log10-scale differences. For the difference threshold value T, if the difference was less than or equal to T, we classified the specimen as susceptible. If the difference was greater than T, we classified the specimen as resistant. The value of T was chosen to maximize the unweighted classification accuracy. For a given antibiotic, this unweighted classification accuracy is defined as the simple average of the percentage of susceptible specimens correctly classified and the percentage of resistant specimens correctly classified.
To examine whether accuracy (correctly classified as susceptible or resistant) was related to growth in the control aliquot, we compared the mean and the median control growth for correctly classified samples versus the mean and the median control growth for incorrectly classified samples. To quantify the direction and degree of association, we also carried out a logistic regression analysis of the accuracy versus the control log RLU change. A separate analysis was carried out for each antibiotic for susceptible and resistant samples, since the relationship is not necessarily the same in susceptible and resistant samples or across antibiotics. We then used binary recursive partitioning (classification tree) methods to determine the control growth cutoff points where the accuracy may change.
RESULTS
Development of a bacterial ATP bioluminescence assay.
We developed a bioluminescence assay designed to measure exclusively intracellular bacterial ATP. The assay consists of three steps. Step 1 involves addition of a buffered somatic extractant and ATPase. The pH of urine specimens can vary widely, depending on dietary factors, medication use, and patients' disease states. For this reason, use of the Somase buffer is essential to bring the sample pH to within the working range of the ATPase. The Somase extractant selectively lyses host cells and releases host cell ATP so that it may be hydrolyzed by ATPase. The ATP hydrolysis step was the most time-consuming step in the assay. We found that up to 15 min was required to reduce the levels of ATP from somatic sources to background levels (data not shown). Step 2 involves the extraction of bacterial ATP. A variety of compounds were tested to identify a universal bacterial extractant able to release ATP efficiently from a variety of potential uropathogens. Finally, in step 3, the bioluminescent reaction was catalyzed by luciferase in the presence of an excess of luciferin substrate.
Bioluminescent quantitation of uropathogens.
The bacterial ATP bioluminescence assay was performed with serial 10-fold dilutions of various uropathogen isolates grown in TSB. A linear relationship between the log of the RLU measurements and the log of the number of CFU was observed over a 7-log-unit range (<103 to >1010 CFU/ml).
We next examined the performance of the bacterial ATP bioluminescence assay for the quantitation of uropathogens in clinical urine specimens from patients with UTIs. The urine specimens tested contained a broad range of uropathogen species, including 1 specimen containing Citrobacter freundii, 1 specimen containing Citrobacter koseri, 1 specimen containing Enterobacter cloacae, 1 specimen containing Enterobacter aerogenes, 25 specimens containing Escherichia coli, 1 specimen containing an Enterococcus species, 8 specimens containing Klebsiella pneumoniae, 1 specimen containing Pseudomonas aeruginosa, 4 specimens containing Proteus mirabilis, 2 specimens containing Staphylococcus aureus, and 1 specimen containing S. saprophyticus. A total of 7 gram-negative species and 4 gram-positive species were included in this phase of the study. Despite the real-world variability of clinical urine specimens (by pH, osmolarity, etc.) and the uropathogens (by species, growth phase, etc.) that they contain, the linear log RLU-log CFU relationship was relatively well preserved (Fig. 1). We used the best-fit line in Fig. 1 to describe the relationship between RLU and the estimated number of CFU, that is, the RLU-to-predicted CFU conversion formula: CFU = 43.45·RLU1.12.
FIG. 1.

Relationship between bioluminescence and the concentration of uropathogens in clinical urine cultures. The bioluminescence assay results for 50 clinical urine specimens from patients with UTIs show the relationship between the log of the RLU measurements and the log of the number of CFU present in the specimen. The roughly linear log RLU-log CFU relationship was maintained, despite the inclusion of specimens containing 11 different species of uropathogens.
Time course of bioluminescent response to antibiotics.
To determine the optimal time for measurement of the response to antibiotics and the optimal antibiotic concentrations that should be tested, we examined the bioluminescent time course of the uropathogens in clinical urine specimens after inoculation into TSB with and without antibiotics. The bacterial ATP bioluminescence assay was performed to estimate the density of bacteria in each clinical urine specimen by using the RLU-to-predicted CFU conversion formula. Urine specimens were diluted 10-, 100-, or 1,000-fold in TSB with and without antibiotics to achieve starting concentrations of 104 to 105 CFU/ml. The bioluminescence assay was performed at 0, 15, 60, 90, and 150 min. Despite specimen storage at 4°C overnight, the log RLU plots indicated that the bacteria routinely entered log phase within 15 min after inoculation (data not shown). As shown in Fig. 2, the differences in bioluminescence between susceptible and resistant strains were reliably observed beginning at 90 min after inoculation.
FIG. 2.
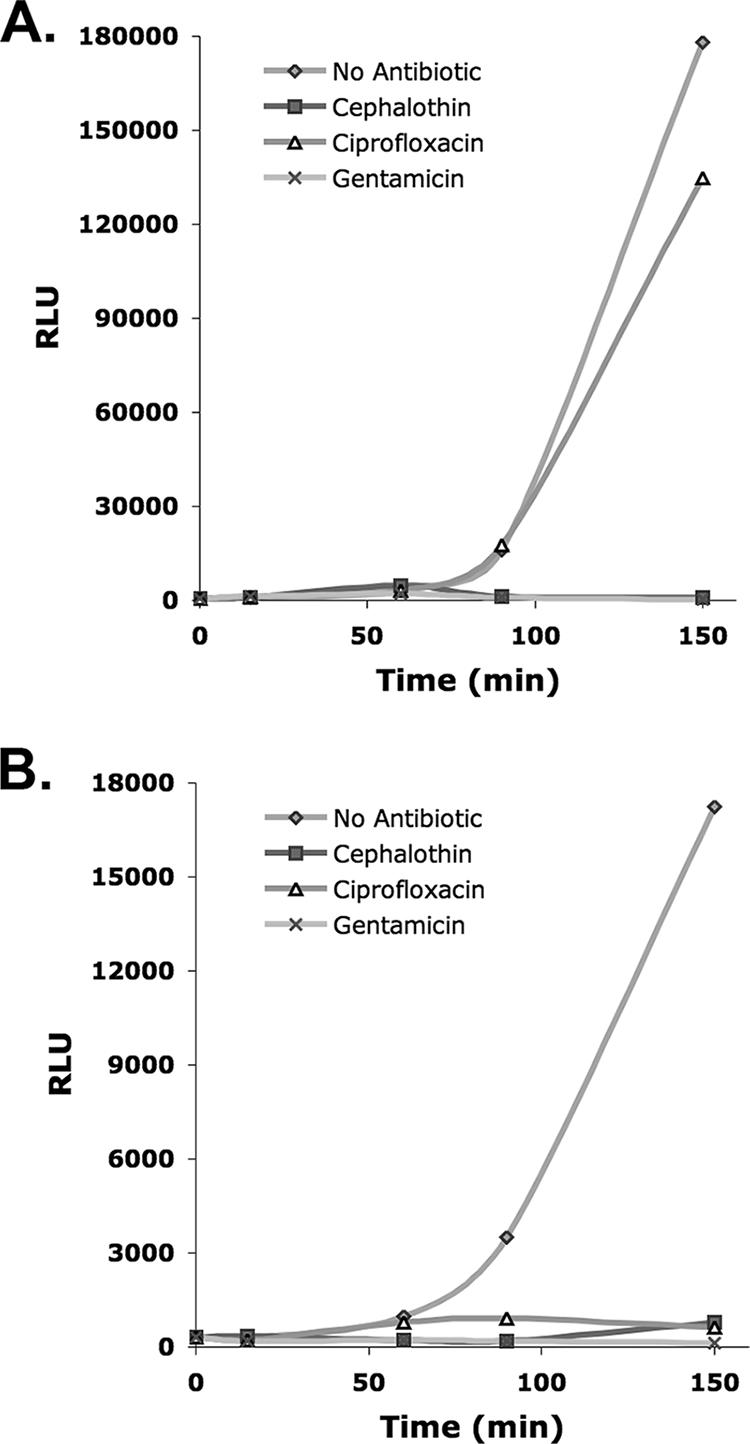
Bioluminescent response to antibiotics of pathogens in clinical urine specimens. The time course of two representative clinical urine specimens from patients with UTIs after inoculation in TSB with and without antibiotics is shown. (A) A urine specimen containing an E. coli isolate sensitive to cephalothin and gentamicin but resistant to ciprofloxacin. (B) A urine specimen containing a Klebsiella oxytoca isolate sensitive to cephalothin, ciprofloxacin, and gentamicin. In each case (A and B), susceptibility could be differentiated from resistance at 150 and 90 min after inoculation, respectively.
Clinical validity study involving blinded clinical urine specimens.
A total of 104 clinical urine samples were received from the Clinical Microbiology Laboratory between 29 March 2006 and 7 June 2006; of these samples, 85 were eligible for analysis. Of the 104 samples (104 × 8 = 832 observations) received, 19 samples (19 × 8 = 152 observations) were omitted since they contained multiple bacterial species or the Clinical Microbiology Laboratory did not perform antibiotic susceptibility studies (the outpatient specimens contained Enterococcus spp.). Another 10 observations were omitted from the remaining 85 specimens and 680 observations since the Clinical Microbiology Laboratory result was intermediate and not susceptible or resistant.
The specimens included in the analysis contained a total of 17 different species, including 11 specimens containing gram-positive bacteria and 27 specimens containing gram-negative bacteria other than E. coli. Each specimen was tested with seven antibiotics; however, the results eligible for inclusion in our statistical analysis were limited to those observations for which we had Clinical Microbiology Laboratory results for comparison. For example, the vancomycin results were not included for gram-negative bacteria, so the total number of noncontrol observations was 492, not 85 × 7 = 595. In the rare instances (10 of 577 observations, excluding those for the controls) in which the time 120 min RLU was actually less than the baseline RLU, making a negative time 120 min-corrected RLU, the uncorrected time 120 min RLU and the time zero RLU were used.
Table 1 shows the accuracy of the receiver operating characteristic curve analysis results by antibiotic and overall. Excluding vancomycin, due to the small sample size of the Clinical Microbiology Laboratory comparison data, the unweighted accuracy ranged from 81% to 97%. For example, for ampicillin, the T value that provided maximum accuracy was −1.231 log units, which corresponded to growth in the presence of antibiotic being 5.9% of the control growth (10−1.231 = 0.0587). The log difference from the control was less than −1.231 for 24/32 (75%) of the susceptible specimens and was greater than −1.231 for 50/52 (96%) of the resistant specimens. The overall unweighted accuracy is (87% + 95%)/2 (91%) when a separate threshold for each antibiotic was used. If the threshold was not individualized for each antibiotic, the accuracy was only 58%. Table 2 gives similar results by uropathogen species, pooled over all antibiotics. Each specimen can contribute up to seven observations in this analysis.
TABLE 1.
Accuracy of bioluminescent antimicrobial susceptibility assay by antibiotic
| Antibiotic | No. of specimensa
|
% Correctb
|
Accuracy (%) | Tc | ||
|---|---|---|---|---|---|---|
| S | R | S | R | |||
| Ampicillin | 32 | 52 | 75 | 96 | 86 | −1.231 |
| Gentamicin | 70 | 10 | 94 | 90 | 92 | −0.773 |
| Cephalothin | 62 | 11 | 81 | 100 | 90 | −1.372 |
| Ciprofloxacin | 62 | 21 | 98 | 95 | 97 | −0.300 |
| Nitrofurantoin | 70 | 9 | 84 | 78 | 81 | −1.447 |
| TMP-SMX | 56 | 27 | 84 | 96 | 90 | −0.455 |
| Vancomycin | 9 | 1 | 67 | 100 | 83 | −0.929 |
| Overalld | 361 | 131 | 87 | 95 | 91 | Aboved |
| Naïve overalle | 361 | 131 | 95 | 21 | 58 | −0.455e |
Number of specimens containing antibiotic-susceptible (S) and antibiotic-resistant (R) organisms.
Calculated by dividing the number of specimens predicted correctly by the number tested.
T, threshold log RLU difference from control result without antibiotics.
Across all antibiotics by the use individual thresholds for each antibiotic.
By the use of one common threshold for all antibiotics.
TABLE 2.
Accuracy of bioluminescent antimicrobial susceptibility assay by species
| Species | No. of isolates | No. of observationsa
|
% Correctb
|
Accuracy | Tc | ||
|---|---|---|---|---|---|---|---|
| S | R | S | R | ||||
| Citrobacter freundii | 2 | 7 | 5 | 100 | 100 | 100 | −0.679 |
| Citrobacter koseri | 1 | 4 | 1 | 100 | 100 | 100 | −0.762 |
| Coagulase-negative Staphylococcus | 2 | 6 | 3 | 100 | 67 | 83 | −0.392 |
| E. coli | 48 | 227 | 59 | 98 | 95 | 97 | −0.451 |
| Enterobacter cloacae | 3 | 9 | 8 | 78 | 100 | 89 | −1.350 |
| Enterococcus spp. | 6 | 16 | 14 | 88 | 79 | 83 | −0.316 |
| Klebsiella oxytoca | 2 | 10 | 2 | 100 | 100 | 100 | −0.534 |
| Klebsiella pneumoniae | 14 | 55 | 19 | 87 | 68 | 78 | −0.455 |
| Proteus mirabilis | 3 | 12 | 6 | 83 | 50 | 67 | −0.278 |
| Providentia stuartii | 1 | 0 | 5 | ||||
| Staphylococcus aureus | 3 | 12 | 6 | 92 | 33 | 63 | −0.011 |
| Serratia marcescens | 1 | 3 | 3 | 100 | 67 | 83 | −0.928 |
Number of observations containing antibiotic-susceptible (S) or antibiotic-resistant (R) organisms.
Calculated by dividing the number of specimens predicted correctly by the number tested.
T, threshold log RLU different from control result without antibiotics.
The accuracy of bioluminescent antimicrobial susceptibility testing was dependent on the increase in bacterial ATP in growth medium without antibiotics. As shown in Table 1, most of the errors involving the bioluminescent approach were for predictions of susceptibility and not resistance. Therefore, there were insufficient data with which to investigate the relationship between accuracy and growth in resistant samples. Among the tests with samples and antibiotics to which the bacteria were susceptible, we found that the mean growth and the median control growth were higher in the correctly classified samples than in the incorrectly classified samples (data not shown). As shown in Table 3, the corresponding logistic regressions show that there is a positive relation (positive slope) between increasing control growth and the probability of a correct test result for all antibiotics. While the slopes are not identical, they are all positive and their differences are not statistically significant. Therefore, data were pooled across all antibiotics in order to determine the overall growth cutoff points where accuracy may change. The classification tree analysis was carried out by using the combined 361 true-susceptible observations only and by using the change in the log RLU change for no-antibiotic (control) conditions as the only predictor. We found that as the growth without antibiotic (control growth) increases, the accuracy increases. The two log RLU change (growth) cutoff points are 1.04 log units and 1.40 log units. A total of 42.9% of 35 observations involving specimens with a control growth log RLU change of <1.04 were correct, and 67.4% of 46 observations involving specimens with a control growth log RLU change of 1.04 to 1.40 were correct, while 95.4% of 280 observations involving specimens with a control growth log RLU change of >1.40 were correct. Therefore, a preliminary rule might be that accuracy is high if the RLU change without antibiotics is observed to be larger than 1.40 log units (or 101.40 = 25-fold) per 120 min. Specimens containing gram-positive bacteria were more likely to exhibit a lower increase in control growth RLU than those containing gram-negative bacteria: 38% of 21 specimens with a control growth log RLU change of <1.40 contained gram-positive bacteria, while only 1.6% of 63 specimens with a control growth log RLU change of ≥1.40 contained gram-positive bacteria.
TABLE 3.
Logistic regression analysis of sample accuracy against control growth result for true-susceptible samples
| Antibiotic | No. of samples susceptible | No. of samples with correct result | Slope (log odds ratio) | SE | P value |
|---|---|---|---|---|---|
| Ampicillin | 32 | 24 | 4.38 | 1.86 | 0.0186 |
| Gentamicin | 70 | 66 | 3.78 | 1.22 | 0.0020 |
| Cephalothin | 62 | 50 | 5.61 | 1.67 | 0.0008 |
| Ciprofloxacin | 62 | 61 | 1.57 | 1.71 | 0.3604 |
| Nitrofurantoin | 70 | 59 | 2.39 | 0.77 | 0.0018 |
| TMP-SMX | 56 | 47 | 1.89 | 0.75 | 0.0115 |
| Vancomycin | 9 | 6 | 2.00 | 1.64 | 0.2238 |
| Total | 361 | 313 | 2.50a | 0.35a | <0.001 |
The results were obtained by ignoring the antibiotic and pooling all data.
DISCUSSION
In this study, we describe a bioluminescent approach to the rapid determination of the antimicrobial susceptibility profiles of uropathogens in clinical urine specimens. A bacterial ATP bioluminescence assay that selectively quantifies the intracellular ATP of bacteria after the free ATP and the host cell-derived ATP in the specimen are hydrolyzed was developed. The correlation between the log of the bacterial density and the log of the light output was found to be linear over a 7-log-unit dynamic range, with a sensitivity of less than 1,000 bacteria per milliliter. The assay was found to be accurate in estimating the density of a wide range of bacterial species in clinical urine specimens, including both gram-negative and gram-positive organisms. Bioluminescent quantitation was used in two steps of the bioluminescent antimicrobial susceptibility assay: first, to determine the appropriate inoculum in the growth medium with and without antibiotics and, second, to measure the responses of uropathogens to antibiotics at the end of a 120-min incubation period. By comparing the increase in bacterial ATP in antibiotic-free growth medium to that in medium containing antibiotics, we were able to determine the antibiotic susceptibility profiles of pathogens in a study of clinical urine specimens with a reasonably high degree of accuracy. This is the first report that we are aware of to have described the rapid determination of the antibiotic susceptibilities of bacterial pathogens in clinical specimens by the use of ATP bioluminesence.
Our study is an extension of prior research on the development of ATP bioluminescence for the detection bacteria. Pioneered by NASA scientists seeking a rapid and sensitive assay for the detection of water contamination, bacterial detection by bioluminescence has been possible since the 1960s. It did not take long to apply this technology to urine samples, with the technology demonstrated to have a sensitivity compatible with clinically accepted cutoffs for UTIs (105 CFU/ml). Bioluminescence assays used to predict bacteriuria were initially limited by high rates of false-positive results due to the incomplete destruction of nonbacterial ATP and, more importantly for a screening test, high rates of false-negative results, thought to be due to unknown inhibitors of the luciferase reaction. With the development of accepted techniques for isolating bacterial ATP and the acceptance that some variation in ATP content across bacterial species can be tolerated, we sought to evaluate the accuracy of a 2-h bioluminescence assay in predicting the susceptibility profiles of uropathogens sampled directly from inpatient and outpatient urine specimens.
Our research also builds upon previous work done to apply ATP bioluminescence to antimicrobial susceptibility testing of bacteria. Bioluminescence methods have been shown to be useful for the rapid (2- to 4-h) determination of the antibiotic susceptibilities of cultured clinical isolates (15, 27, 31, 32). The cutoff for susceptibility was determined to be <40% of the RLU measurement obtained for bacteria in the absence of antibiotic (15). These initial studies noted that in some cases, bacteria that were susceptible to beta-lactam antibiotics appeared to be resistant by measurement of intracellular ATP levels by the use of bioluminescence. Microscopic examination revealed that the cause of the discrepancies was the formation of bacterial filaments or spheroplasts (10, 18). Filamentation may account in part for the relatively low percentage of correct predictions of susceptibility to ampicillin and cephalothin of 75% and 81%, respectively, in our study (Table 1). Recently, a simple method for the resolution of these discrepancies was developed and involved the release of ATP from filamentous bacterial cells prior to the bioluminescence measurement (11). Adoption of this approach could potentially improve the performance of our assay in future studies. Another potential cause of the discrepancies between the bioluminescence assay results and the results reported by the Clinical Microbiology Laboratory is the growth of contaminating bacteria during the overnight incubation at 4°C or the 120-min incubation in growth medium. For this reason, we confirmed that the identities and the antibiotic susceptibility profiles of the organisms in samples with multiple discrepancies collected at the end of the 120-min incubation period were the same as those of the organisms in the original samples (data not shown).
We found that bioluminescent prediction of antibiotic resistance was generally more accurate than bioluminescent prediction of antibiotic susceptibility. Resistance and susceptibility were correctly predicted in 95% and 87% of cases, respectively. In the selection of antibiotics, the correct prediction of resistance would be relatively more important than the correct prediction of susceptibility. In the treatment of UTIs, the correct prediction of resistance would allow the clinician to avoid prescribing an antibiotic to which the uropathogen is truly resistant. The major exception to the generally high percentage of correct antibiotic resistance predictions was nitrofurantoin. Nitrofurantoin resistance was correctly predicted in only 78% (seven of nine) cases, and as expected, the incorrect results were for organisms other than E. coli. Despite the availability of nitrofurantoin for over 50 years, the rate of susceptibility to this drug remains >99% among E. coli isolates. Because a far greater percentage of UTIs than were represented in our study are due to E. coli, the overall probability of encountering false-negative nitrofurantoin resistance in actual clinical practice would likely be lower than that observed here.
Most of the errors in the prediction of antibiotic susceptibility were for samples producing a relatively low or moderate increase in bacterial ATP in the control growth medium without antibiotics. The accuracies of antibiotic susceptibility predictions were 43%, 67%, and 95% for samples in which the increases in bacterial ATP in the control were less than 10-fold, between 10- and 25-fold, and at least 25-fold, respectively. That is, when the increase in bacterial ATP was high in the control experiment, it was easier to differentiate antibiotic susceptibility from resistance. An incubation time of 120 min may not be the optimal incubation time for all urine specimens. Specimens containing gram-positive bacteria were more likely to produce inaccurate results and a <25-fold RLU increase after inoculation into medium without antibiotics. To address this problem, bioluminescence could be measured over time to determine when the increase in bacterial ATP in the antibiotic-free control sample reaches or exceeds 25-fold, at which point the results of the bioluminescence antibiotic susceptibility assay are much more likely to be accurate. We acknowledge that the log RLU change from the control result thresholds (Table 1) that we selected may not be optimal for all uropathogens in all clinical settings. Further studies with larger numbers of urine specimens from multiple health care centers are needed to validate this approach and to further refine the bioluminescence thresholds for differentiating antibiotic-susceptible from antibiotic-resistant uropathogens.
The emerging crisis in antibiotic resistance, the current emphasis on evidence-based clinical practice, and the lack of new drugs in the antibiotic pipeline combine to highlight the inappropriateness of empirical antibiotic use in the management of UTIs (23). The most recent Infectious Diseases Society of America guidelines for the treatment of UTIs recommend the use of TMP-SMX for the treatment of cystitis (28). However, the rate of resistance to TMP-SMX among E. coli uropathogens exceeds 20% in many settings. Consequently, many clinicians have abandoned the Infectious Diseases Society of America recommendations and prescribe quinolones for the treatment of routine cystitis. As a result, quinolone use has increased dramatically in recent years, accompanied by the inevitable emergence of quinolone resistance in community-acquired UTIs (5). Rapid laboratory methods for the detection of uropathogens and determination of their antimicrobial susceptibility profiles would make it possible for clinicians to avoid antibiotic use when bacteria are not present in the urine or to use first-line antibiotics in the vast majority of cases. The availability of a rapid, bioluminescent antimicrobial susceptibility assay would go a long way toward avoiding the inappropriate overuse of antibiotics, which is threatening to undermine the antibiotic miracle (19).
Acknowledgments
We gratefully acknowledge the support and expert assistance of Sandra Saeki and the UCLA Clinical Microbiology Laboratory. We thank Medical Packaging Corporation for their generosity in providing bioluminescence assay reagents.
This study was supported by Bioengineering Research Partnership grant EB00127 (to B.M.C.) from the National Institute of Biomedical Imaging and Bioengineering, Cooperative Agreement Award AI075565 (to D.A.H.) from the National Institute of Allergy and Infectious Diseases, and the Wendy and Ken Ruby Fund for Excellence in Pediatric Urology Research. Bernard M. Churchill is the Judith and Robert Winston Chair in Pediatric Urology.
Footnotes
Published ahead of print on 13 February 2008.
REFERENCES
- 1.Chappelle, E. W., and G. V. Levin. 1968. Use of the firefly bioluminescent reaction for rapid detection and counting of bacteria. Biochem. Med. 241-52. [Google Scholar]
- 2.Clinical and Laboratory Standards Institute. 2006. Methods for dilution antimicrobial susceptibility tests for bacteria that grow aerobically; approved standard, seventh edition. Clinical and Laboratory Standards Institute, Wayne, PA.
- 3.Clinical and Laboratory Standards Institute. 2007. Performance standards for antimicrobial susceptibility testing; seventeenth informational supplement. Clinical and Laboratory Standards Institute, Wayne, PA.
- 4.Conn, R. B., P. Charache, and E. W. Chappelle. 1975. Limits of applicability of the firefly luminescence ATP assay for the detection of bacteria in clinical specimens. Am. J. Clin. Pathol. 63493-501. [DOI] [PubMed] [Google Scholar]
- 5.Czaja, C. A., D. Scholes, T. M. Hooton, and W. E. Stamm. 2007. Population-based epidemiologic analysis of acute pyelonephritis. Clin. Infect. Dis. 45273-280. [DOI] [PubMed] [Google Scholar]
- 6.Drow, D. L., C. H. Baum, and G. Hirschfield. 1984. Comparison of the Lumac and Monolight systems for detection of bacteriuria by bioluminescence. J. Clin. Microbiol. 20797-801. [DOI] [PMC free article] [PubMed] [Google Scholar]
- 7.Dyer, I. E., T. M. Sankary, and J. A. Dawson. 1998. Antibiotic resistance in bacterial urinary tract infections, 1991 to 1997. West. J. Med. 169265-268. [PMC free article] [PubMed] [Google Scholar]
- 8.Foxman, B., R. Barlow, H. D'Arcy, B. Gillespie, and J. D. Sobel. 2000. Urinary tract infection: self-reported incidence and associated costs. Ann. Epidemiol. 10509-515. [DOI] [PubMed] [Google Scholar]
- 9.Gupta, K. 2003. Emerging antibiotic resistance in urinary tract pathogens. Infect. Dis. Clin. N. Am. 17243-259. [DOI] [PubMed] [Google Scholar]
- 10.Hanberger, H., L. E. Nilsson, E. Kihlstrom, and R. Maller. 1990. Postantibiotic effect of beta-lactam antibiotics on Escherichia coli evaluated by bioluminescence assay of bacterial ATP. Antimicrob. Agents Chemother. 34102-106. [DOI] [PMC free article] [PubMed] [Google Scholar]
- 11.Hattori, N., M. O. Nakajima, K. O'Hara, and T. Sawai. 1998. Novel antibiotic susceptibility tests by the ATP-bioluminescence method using filamentous cell treatment. Antimicrob. Agents Chemother. 421406-1411. [DOI] [PMC free article] [PubMed] [Google Scholar]
- 12.Kolbeck, J. C., R. A. Padgett, E. G. Estevez, and L. J. Harrell. 1985. Bioluminescence screening for bacteriuria. J. Clin. Microbiol. 21527-530. [DOI] [PMC free article] [PubMed] [Google Scholar]
- 13.Kunin, C. 1997. Diagnostic methods, p. 42-77. In Urinary tract infections: detection, prevention, and management, 5th ed. The Williams & Wilkins Co., Baltimore, MD.
- 14.Mackett, D., S. Kessock-Philip, S. Bascomb, and C. S. Easmon. 1982. Evaluation of the Lumac kit for the detection of bacteriuria by bioluminescence. J. Clin. Pathol. 35107-110. [DOI] [PMC free article] [PubMed] [Google Scholar]
- 15.McWalter, P. W. 1984. Determination of susceptibility of Staphylococcus aureus to methicillin by luciferin-luciferase assay of bacterial adenosine triphosphate. J. Appl. Bacteriol. 56145-150. [DOI] [PubMed] [Google Scholar]
- 16.Nichols, W. W., G. D. Curtis, and H. H. Johnston. 1982. Analysis of the disagreement between automated bioluminescence-based and culture methods for detecting significant bacteriuria, with proposals for standardizing evaluations of bacteriuria detection methods. J. Clin. Microbiol. 15802-809. [DOI] [PMC free article] [PubMed] [Google Scholar]
- 17.Nicolle, L. 2001. Epidemiology of urinary tract infection. Infect. Med. 18153-162. [Google Scholar]
- 18.Odenholt, I., B. Isaksson, L. Nilsson, and O. Cars. 1989. Postantibiotic and bactericidal effect of imipenem against Pseudomonas aeruginosa. Eur. J. Clin. Microbiol. Infect. Dis. 8136-141. [DOI] [PubMed] [Google Scholar]
- 19.Salyers, A. A., and D. D. Whitt. 2005. Revenge of the microbes: how bacterial resistance is undermining the antibiotic miracle. American Society for Microbiology Press, Washington, DC.
- 20.Schappert, S. M. 1999. Ambulatory care visits to physician offices, hospital outpatient departments, and emergency departments: United States. 1997. Vital Health Stat. 13i-iv, 1-39. [PubMed] [Google Scholar]
- 21.Selan, L., F. Berlutti, C. Passariello, M. C. Thaller, and G. Renzini. 1992. Reliability of a bioluminescence ATP assay for detection of bacteria. J. Clin. Microbiol. 301739-1742. [DOI] [PMC free article] [PubMed] [Google Scholar]
- 22.Semeniuk, H., J. Noonan, H. Gill, and D. Church. 2002. Evaluation of the Coral UTI Screen system for rapid automated screening of significant bacteriuria in a regional centralized laboratory. Diagn. Microbiol. Infect. Dis. 447-10. [DOI] [PubMed] [Google Scholar]
- 23.Spellberg, B., J. H. Powers, E. P. Brass, L. G. Miller, and J. E. Edwards, Jr. 2004. Trends in antimicrobial drug development: implications for the future. Clin. Infect. Dis. 381279-1286. [DOI] [PubMed] [Google Scholar]
- 24.Talan, D. A., W. E. Stamm, T. M. Hooton, G. J. Moran, T. Burke, A. Iravani, J. Reuning-Scherer, and D. A. Church. 2000. Comparison of ciprofloxacin (7 days) and trimethoprim-sulfamethoxazole (14 days) for acute uncomplicated pyelonephritis in women: a randomized trial. JAMA 2831583-1590. [DOI] [PubMed] [Google Scholar]
- 25.Thore, A., S. Ansehn, A. Lundin, and S. Bergman. 1975. Detection of bacteriuria by luciferase assay of adenosine triphosphate. J. Clin. Microbiol. 11-8. [DOI] [PMC free article] [PubMed] [Google Scholar]
- 26.Thore, A., A. Lundin, and S. Ansehn. 1983. Firefly luciferase ATP assay as a screening method for bacteriuria. J. Clin. Microbiol. 17218-224. [DOI] [PMC free article] [PubMed] [Google Scholar]
- 27.Thore, A., L. Nilsson, H. Hojer, S. Ansehn, and L. Brote. 1977. Effects of ampicillin on intracellular levels of adenosine triphosphate in bacterial cultures related to antibiotic susceptibility. Acta Pathol. Microbiol. Scand. Sect. B 85161-166. [DOI] [PubMed] [Google Scholar]
- 28.Warren, J. W., E. Abrutyn, J. R. Hebel, J. R. Johnson, A. J. Schaeffer, W. E. Stamm, et al. 1999. Guidelines for antimicrobial treatment of uncomplicated acute bacterial cystitis and acute pyelonephritis in women. Clin. Infect. Dis. 29745-758. [DOI] [PubMed] [Google Scholar]
- 29.Welch, W. D., M. A. Layman, and P. M. Southern, Jr. 1984. Evaluation of the MS-2 and Lumac systems for the rapid screening of urine specimens. Am. J. Clin. Pathol. 81629-633. [DOI] [PubMed] [Google Scholar]
- 30.Welch, W. D., L. Thompson, M. Layman, and P. M. Southern, Jr. 1984. Evaluation of two bioluminescence-measuring instruments, the Turner design and Lumac systems, for the rapid screening of urine specimens. J. Clin. Microbiol. 201165-1170. [DOI] [PMC free article] [PubMed] [Google Scholar]
- 31.Wheat, P. F., J. G. Hastings, and R. C. Spencer. 1988. Rapid antibiotic susceptibility tests on Enterobacteriaceae by ATP bioluminescence. J. Med. Microbiol. 2595-99. [DOI] [PubMed] [Google Scholar]
- 32.Wheat, P. F., R. C. Spencer, and J. G. Hastings. 1989. A novel luminometer for rapid antimicrobial susceptibility tests on gram-positive cocci by ATP bioluminescence. J. Med. Microbiol. 29277-282. [DOI] [PubMed] [Google Scholar]