

Abstract
We have calibrated five different molecular clocks for circulating poliovirus based upon the rates of fixation of total substitutions (Kt), synonymous substitutions (Ks), synonymous transitions (As), synonymous transversions (Bs), and nonsynonymous substitutions (Ka) into the P1/capsid region (2,643 nucleotides). Rates were determined over a 10-year period by analysis of sequences of 31 wild poliovirus type 1 isolates representing a well-defined phylogeny derived from a common imported ancestor. Similar rates were obtained by linear regression, the maximum likelihood/single-rate dated-tip method, and Bayesian inference. The very rapid Kt [(1.03 ± 0.10) × 10−2 substitutions/site/year] and Ks [(1.00 ± 0.08) × 10−2] clocks were driven primarily by the As clock [(0.96 ± 0.09) × 10−2], the Bs clock was ∼10-fold slower [(0.10 ± 0.03) × 10−2], and the more stochastic Ka clock was ∼30-fold slower [(0.03 ± 0.01) × 10−2]. Nonsynonymous substitutions at all P1/capsid sites, including the neutralizing antigenic sites, appeared to be constrained by purifying selection. Simulation of the evolution of third-codon positions suggested that saturation of synonymous transitions would be evident at 10 years and complete at ∼65 years of independent transmission. Saturation of synonymous transversions was predicted to be minimal at 20 years and incomplete at 100 years. The rapid evolution of the Kt, Ks, and As clocks can be used to estimate the dates of divergence of closely related viruses, whereas the slower Bs and Ka clocks may be used to explore deeper evolutionary relationships within and across poliovirus genotypes.
Poliovirus is one of the most rapidly evolving viruses known (17, 31, 38, 52, 58). Estimates of the rates of total nucleotide substitution into poliovirus capsid regions average ∼10−2 substitutions per site per year (31, 39, 52-54, 89, 90). The rates appear to be similar across the three poliovirus serotypes and for both circulating polioviruses and polioviruses associated with chronic infections. This very rapid rate of genomic evolution has facilitated high-resolution molecular epidemiologic studies, permitting the unambiguous identification of the sources of imported viruses (10, 41) and the resolution of separate lineages during outbreaks (39, 43, 74, 75), during endemic transmission (23, 52, 90), during prolonged poliovirus replication in immunodeficient patients (9, 31, 53, 89), and from environmental surveillance (23). However, the rapid accumulation of nucleotide substitutions, most of which are synonymous transitions, obscures deeper evolutionary relationships (46, 70).
Underlying the rapid pace of poliovirus genomic evolution are the high rates of base misincorporation (in the range of 10−5 to 10−3 per base per replication) by the poliovirus RNA-dependent RNA polymerase (2, 15, 19, 81, 82, 84). These high mutation rates are attributable to the absence of 3′→5′ exonuclease proofreading mechanisms for the viral RNA polymerases (19), although other mechanisms may also be involved (17, 18). The strong transition bias of the poliovirus polymerase (2, 46) is reflected in the pattern of fixation nucleotide substitutions into poliovirus genomes.
In this report, we have calibrated five different molecular clocks based upon the rates of fixation of total substitutions (Kt), synonymous substitutions (Ks), synonymous transitions (As), synonymous transversions (Bs), and nonsynonymous substitutions (Ka) into the P1/capsid regions of circulating wild poliovirus type 1. Our analyses were facilitated by a chance epidemiologic event when type 1 polioviruses previously indigenous to the northern Andean region (Venezuela to Peru) were displaced by a genotype imported around 1980 from the Middle East (40). The imported virus circulated widely in the northern Andean region until elimination in 1991. Poliovirus surveillance yielded isolates that were closely related to the true imported founder and isolates representing two major diverging lineages. Analysis of the Andean isolate sequences permitted robust estimates of the fixation rates for different categories of nucleotide substitution. The closely related Kt, Ks, and As clocks can be used routinely by poliovirus surveillance to establish recent epidemiologic links. Resolving the Bs clock from the noisy Kt and Ks signals (32) opens a way to explore the broader patterns of poliovirus transmission. The poliovirus Ka clock, constrained by purifying selection at all nonsynonymous P1/capsid sites, was the slowest and most variable of all.
MATERIALS AND METHODS
Virus isolates.
Poliovirus isolates sequenced in this study were kindly sent by Jorge Boshell (Instituto Nacional de Salud, Bogotá, Colombia), Rosalba Salas (Instituto Nacional de Higiene, Caracas, Venezuela), and Edson da Silva (Instituto Oswaldo Cruz, Rio de Janeiro, Brazil), with the assistance of Gina Tambini (Pan American Health Organization, Washington, DC). The isolates were initially characterized by neutralization with hyperimmune equine sera and RNA probe hybridization (14). Viruses were propagated in monolayers of RD cells (a human rhabdomyosarcoma cell line; ATCC CCL136) to produce high-titer stocks (maximum number of passages from the original stool specimen = 5).
P1/capsid region sequencing.
Conditions for reverse transcription-PCR amplification and cycle sequencing of the P1/capsid region (nucleotides [nt] 743 to 3385) were essentially the same as those described previously (52). Reverse transcription used primer 3503A (5′-AAGAGGTCTCTRTTCCACAT-3′; targets nt 3485 to 3504) (numbering of nucleotide positions followed that described for Sabin 1 [57]), followed by 35 PCR cycles using primers 3503A and S48 (5′-GGGGACAAGTTTGTACAAAAAAGCAGGCTTTAAAACAGCTCTGGGGTT-3′; targeting nt 0001 to 0019) to generate an ∼3,533-bp amplicon spanning the entire P1/capsid region. Sequencing was performed in both directions, using several primers, and every nucleotide position was sequenced at least once from each strand.
Estimation of numbers of synonymous and nonsynonymous sites.
Multiple alignments among the homologous P1/capsid sequences were obtained after partitioning total P1/capsid sites (LT; 2,643 nt) into four subalignments comprising the following positions: synonymous sites for all synonymous substitutions (LS; ∼909 nt), synonymous sites for synonymous transitions (LS-A), synonymous sites for synonymous transversions (LS-B), and nonsynonymous sites for all nonsynonymous substitutions (LN). Consensus LS-A (∼865 nt) positions were obtained by alignment of twofold degenerate sites for transitions only and of fourfold degenerate sites, consensus LS-B (∼512 nt) positions were obtained by alignment of twofold degenerate sites for tranversions only and of fourfold degenerate sites, and consensus LN (∼1,734 nt) positions were obtained by alignment of nondegenerate sites (L0) (12). Assignment of fourfold, twofold, and zerofold degenerate sites followed the method of Li et al. (50). Positions bearing more than one class of degenerate sites were discarded. Alignment editing was performed by using the SEAVIEW (30) and MEGA (47) software packages. All alignments were subsequently used to calculate the absolute rates of evolution by both maximum likelihood and Bayesian approaches.
P1/capsid phylogeny estimation.
Phylogenetic trees were estimated from P1/capsid sequence alignments by using maximum parsimony, distance methods, likelihood functions (77), and Bayesian inference (72). Maximum parsimony and distance-based (minimum evolution) trees were inferred in heuristic searches using the PAUP software package (76). The topology of the maximum likelihood (ML) tree was reconstructed in a majority-rule consensus tree after 1,000 bootstrap replicates were performed in the fastDNAml program (25, 59), and the corresponding branch lengths were evaluated following model selection approaches (37, 65) among nested models of evolution implemented in the program MODELTEST (66). ML estimations of branch lengths were calculated by using the PAML software package (93). The most preferred model of evolution, the REV (general time reversible process) model with variable rates among sites (91), assigned different probabilities to each of the six pairs of substitutions and assumed unequal base frequencies. Variability of rates among sites was selected using the discrete gamma distribution (Γ8), with a shape parameter (α) of 0.3 and eight categories of discrete sites (92). A majority-rule consensus Bayesian tree was also inferred under the REV+Γ8 model after two independent Markov chain Monte Carlo runs of 10,000,000 steps were performed using the program MrBayes 3.1 (72).
Phylogenetic trees, rooted to sequence 3216/VEN81, were visualized in TreeExplorer (http://evolgen.biol.metro-u.ac.jp/TE/TE_man.html).
Pattern and distribution of substitutions.
P1/capsid nucleotide substitutions along the 60 branches of the estimated REV+Γ8 ML tree were calculated using marginal reconstruction of ancestral states as implemented in PAML (45, 94). The list of total inferred substitutions was imported into and manually edited in a Microsoft Excel spreadsheet and used to calculate the substitution pattern. Directional substitutions were also calculated with DAMBE software (87) by incorporating PAML inferred ancestral sequences. Relative substitution frequencies were obtained from the substitution pattern after substitutions were scaled to the proportion of mutant nucleotides (78). The proportion (Pn) of inferred synonymous transitions and synonymous transversions at each of the 881 P1/capsid codons and the expected proportions assuming a Poisson distribution were compared and plotted using statistical applications included in MATLAB (MathWorks, Natick, MA).
Estimation of relative rates of fixation of synonymous and nonsynonymous substitutions into antigenic and nonantigenic sites.
The numbers of synonymous substitutions per synonymous site (Ks) and nonsynonymous substitutions per nonsynonymous site (Ka) between pairwise sequences were estimated using the correction method of Li (49), as modified by Pamilo and Bianchi (62) and implemented in the program MEGA (47). The estimated parameter ω (defined as the dN/dS [equivalent to Ka/Ks] ratio) evaluates the selective constraints on or selective pressure for amino acid replacement among homologous proteins.
Linear regression analysis of absolute rates of synonymous and nonsynonymous substitution.
The number of Ks and Ka P1/capsid substitutions that accumulated from the root sequence, 3216/VEN81, were computed using the program K-Estimator (11). Ks values were estimated as the sum of estimated As and Bs substitutions in corrected synonymous sites (12). Finally, Kt was calculated as the expected number of nucleotide substitutions per site, as implemented in PAML (93). The different categories of substitutions from the root sequence were plotted as a function of the time of sample collection. When the exact dates of sample collection were unknown, collection dates were assumed to be 10 days after the onset of paralysis (when the dates of onset were known) or 1 July of the year of isolation when only the year of onset was known. The rates of accumulation of each category of substitution were estimated by linear regression, using statistical applications within the SAS system, version 9 (SAS Institute, Inc., Cary, NC). Rates of fixation of Ks, As, Bs, and Ka substitutions from the regression analysis were normalized to total P1/capsid sites from the LT, LS, and LN values and expressed as K′s (Ks × LS/LT), A′s (As × LS/LT), B′s (Bs × LS/LT), and K′a (Ka × LN/LT) substitutions per site per year, respectively.
ML and Bayesian inference of absolute rates of synonymous and nonsynonymous substitution.
The global molecular clock model (single-rate dated-tip model [ML/SRDT]) (69), which assigns a unique rate of substitution (an ML estimate) among lineages, was compared to the different-rate model, which does not assume rate constancy among lineages. The simpler, constrained ML/SRDT model (with likelihood L0) was compared to the unconstrained different-rate model (with likelihood L1) in likelihood ratio tests (LRTs), with the difference in free parameters (n) equal to 3 (n = number of sequences) (80). The LRT statistic, 2Δℓ, is twice the ratio of log(L1/L0), and if the simpler rate constancy hypothesis is true, the statistic 2Δℓ is approximately χ2 distributed. The corrected significance level for rejection (α) of the Kt, K′s, A′s, B′s, and K′a molecular clocks was set to an overall value of 0.05. Test statistics were obtained using MODELTEST. Rates of substitution and their corresponding 95% confidence intervals (CI) were calculated in PAML. Reliability of the CIs was investigated by tuning the iteration algorithm in PAML.
The Bayesian approach for the same types of molecular clocks was performed in the program BEAST v1.4 (22). Two independent chains of 5,000,000 steps were run under a model of constant population size. The models of evolution used for each molecular clock were the same as those used for the ML/SRDT clocks.
Analysis of differential rates of saturation of transition and transversion substitutions.
We compared the numbers of corrected and uncorrected transitions and transversions at third-codon positions (3CPs) between each sequence pair of the P1/capsid alignment against the cognate branch length (patristic distance) inferred by the ML/SRDT tree. Patristic distances under the clock model represented total evolutionary time, in years. Corrected and uncorrected distances were calculated in PAUP (76). The application PATRISTIC (29) was used to calculate patristic distances (ML/SRDT estimates) and match them with observed distances between each sequence pair.
Modeling of long-term patterns of transitions and transversions.
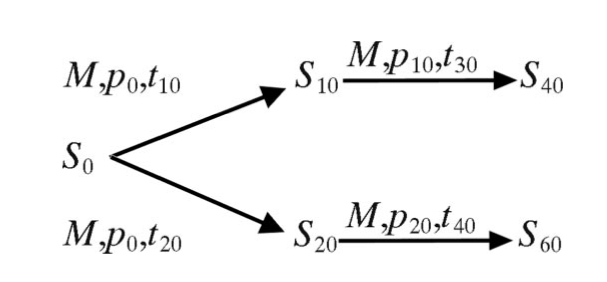
The long-term (∼100 year) evolution of 3CPs within the P1/capsid region (881 nt) of the Andean viruses was simulated by computer, using the MATLAB program mutate as described by Allman and Rhodes (1). Successive mutation runs obtained by computer simulation extended the evolution from the 3216/VEN81 founder sequence (S0) by several decades. Phylogenetic analysis of the simulated sequences produced an ML tree similar in topology to that obtained with the natural sequences. Serially sampled simulated sequences (St) were obtained by application of a 4 × 4 Markov matrix (M) based on the substitution pattern inferred from the ML/SRDT Andean phylogeny. The probabilities for transversions were increased 1.8-fold in the matrix to correct for the observation that only ∼56% of P1/capsid 3CPs were fourfold degenerate sites (as determined by back translation of sequence 3216/VEN81-1). Each mutation run applied an arbitrary number of time steps (t) and assumed a rate of fixation (α) of ∼0.01 3CP substitutions/3CP site/time step, starting with the 3CP base distribution vector for VEN81-1 [p0 = 0.241 for A, 0.243 for G, 0.288 for C, and 0.228 for U)]. For example:
 |
The phylogenetic relationships between the simulated sequences were obtained by ML following the methods applied to the natural sequences. Briefly, we inferred an ML/SRDT tree under the REV model of evolution after obtaining an initial topology by using the fastDNAml program and estimating the branch lengths in PAML. The ML estimate of the average transition/transversion ratio was ∼6. The differential saturation rate of 3CP transitions and transversions was calculated as described above for the natural sequences.
Nucleotide sequence accession numbers.
Sequences of the 31 wild Andean poliovirus type 1 isolates described in this study were submitted to the GenBank library under accession numbers EF374000 to EF374030.
RESULTS
Phylogenetic relationships among Andean type 1 poliovirus isolates.
Nucleotide sequence relationships in the P1/capsid region (nt 743 to 3385; 2,643 nt) among the 31 Andean type 1 poliovirus isolates were summarized in an ML tree scaled to time using the SRDT model (Fig. 1). Trees constructed using ML, maximum parsimony, distance methods (77), and Bayesian inference (72) had very similar topologies. ML trees of individual capsid protein regions (VP0 [VP4 + VP2], VP3, and VP1) were nearly congruent with the P1/capsid tree (see Fig. S1 in the supplemental material), but statistical support (bootstrap and Bayesian posterior density values) was highest for the P1/capsid tree, and the number of significantly positive interior branches was maximized. In contrast, the tree comparing the complete open reading frames of the 31 isolates was not congruent with the capsid protein region trees because of the contribution of heterologous noncapsid sequences acquired by multiple recombinations between the Andean polioviruses and other species C enteroviruses (data not shown).
FIG. 1.

ML/SRDT tree of P1/capsid region sequence relationships among 31 wild poliovirus type 1 isolates from cases in the period 1981-1991 in the northern Andean region. The tree was rooted to the sequence of isolate VEN81-1, with branch lengths scaled under the SRDT model (69) to the date of specimen collection, as described in Materials and Methods. Statistical support for the tree topology (bootstrap values or Bayesian posterior density values [in parentheses]) is given at the nodes. The sequence of the last indigenous wild poliovirus isolate from the Americas (PER91) is marked by an asterisk. Italicized letters in parentheses identify clusters of isolates (A, VEN81-1, VEN81-2, VEN82, PER83, COL86, VEN88-1, COL89, and COL91-5; B, VEN84; C, VEN88-2, COL90-2, COL90-3, COL90-4, COL91-2, and COL91-3; D, COL91-1, COL91-4, COL91-6, COL91-7, and COL91-8; E, PER88-4; F, PER88-1; G, PER88-3; H, PER88-2; I, ECU89, ECU90-1, COL90-1, PER90-1, and PER91; J, ECU90-2; and K, PER90-2) having identical sequences in the NAg sites shown in Fig. 4.
The tree was rooted to the sequence of VEN81-1. Previous studies based upon VP1 sequence comparisons had established that VEN81-1 is closely related to a virus imported into the Andean region from the Middle East, the hypothetical common ancestor to all subsequent wild Andean poliovirus type 1 isolates (40). The P1/capsid tree split into two major branches, representing clusters of lineages that evolved independently during local circulation in the northern (Venezuela and northern Colombia) and southern (southern Colombia, Ecuador, and Peru) parts of the north Andean region (40).
Pattern of nucleotide substitution.
The ML algorithm used to construct the tree (Fig. 1) estimated that a total of 1,247 nucleotide substitutions were cumulatively fixed into the P1/capsid regions of the 31 isolates during their divergence from the VEN81-1 root sequence (Table 1). In accord with previous reports (2, 15, 31, 46, 52, 70), most (93%) substitutions generated synonymous codons and most (92%) substitutions were transitions. Synonymous transitions were the most common (87%) and nonsynonymous transversions the least common (1.8%) substitutions. A higher proportion of transitions (95%) than transversions (78%) were synonymous. The large majority (89%) of nucleotide changes occurred in 3CPs, and >99% of these were synonymous (Table 1). However, the majority of codon positions (91% of 1CPs, 97% of 2CPs, and 32% of 3CPs) were calculated by ML to have been invariant during the 10-year period of observation. Multiple substitutions were estimated to have occurred at ∼13% of sites (and at nearly half of all variable sites); superimposed substitutions (primarily back substitutions) occurred at ∼8% of sites. Despite the large number of substitutions, the P1/capsid region RNA base composition (A, 28.1% ± 0.15%; G, 22.7% ± 0.19%; C, 25.4% ± 0.26%; and U, 23.8% ± 0.26% [n = 31]) and effective codon usage (Nc = 56 ± 0.5; n = 31) (86) were strongly conserved.
TABLE 1.
Nucleotide substitutions fixed into P1/capsid region of Andean lineages, 1981 to 1991a
| Lineage | No. of substitutions at codon position
|
Total no. of substitutions | |||||||||||
|---|---|---|---|---|---|---|---|---|---|---|---|---|---|
| Synonymous (Ks)a
|
Nonsynonymous (Ka)a
|
||||||||||||
| Transitions (As)
|
Transversions (Bs)
|
Transitions (Aa)
|
Transversions (Ba)
|
||||||||||
| 1 | 2 | 3 | 1 | 2 | 3 | 1 | 2 | 3 | 1 | 2 | 3 | ||
| Northern | 27 | 522 | 1 | 42 | 20 | 9 | 1 | 11 | 1 | 4 | 638 | ||
| Southern | 33 | 523 | 0 | 38 | 13 | 17 | 0 | 6 | 1 | 1 | 632 | ||
| Sharedb | 1 | 20 | 1 | 1 | 23 | ||||||||
| Complete phylogeny | 1,247 | ||||||||||||
Nucleotide substitutions were estimated by ML as described in Materials and Methods.
Nucleotide substitutions were estimated separately for the northern and southern lineages from the VEN81-1 root. Shared substitutions that were fixed before divergence of the two observed major branches were counted twice, and the duplicate counts were subtracted out.
Distribution of nucleotide substitutions in the P1/capsid region.
Although estimated Kt substitutions were widely distributed along the P1/capsid region (Fig. 2), the average density of substitutions was slightly higher for VP1 (0.51 substitutions/site) than for VP0 (0.47) and VP3 (0.41). The nearly uniform distribution of total substitutions across the P1/capsid region reflects the predominating contributions of As and Bs substitutions to Kt, as both were nearly evenly distributed along the P1/capsid region (Fig. 2). In contrast, Ka substitutions were distributed in a more irregular pattern, appearing as discrete “jumps” along the P1/capsid region (Fig. 2).
FIG. 2.

Distribution by category of nucleotide substitutions across the P1/capsid region along all observed Andean lineages, based upon the ML/SRDT tree in Fig. 1 and the assignments summarized in Table 1. The reference sequence (set at zero substitutions) was that of VEN81-1. Symbols: Kt, total nucleotide substitutions; Ks, synonymous substitutions; Ka, nonsynonymous substitutions; As, synonymous transitions; Aa, nonsynonymous transitions; Bs, synonymous transversions; Ba, nonsynonymous transversions. NAg sites are shown in gray, and the highly variable (79) and structurally disordered (35) 32 amino-terminal residues of VP1 are represented as a gradient of gray shades.
The distribution of the estimated numbers of As and Bs substitutions per site, estimated by ML, was in good agreement with the frequencies expected from Poisson distributions (Fig. 3, solid lines) calculated from the estimated rates of fixation of (2.80 ± 0.13) × 10−2 synonymous transitions/synonymous site/year and (0.30 ± 0.04) × 10−2 synonymous transversions/synonymous site/year. Very limited saturation of Bs substitutions in the poliovirus P1/capsid region was evident after 10 years of circulation.
FIG. 3.

ML estimates of distributions of numbers of As (unfilled bars) and Bs (hatched bars) substitutions fixed per site into the P1/capsid regions of all 31 Andean isolates during 10 years of divergence from the VEN81-1 root sequence. The distributions expected for a Poisson model of nucleotide substitution are shown as thin (As) and thick (Bs) lines.
Location of capsid amino acid replacements.
A total of 82 nonsynonymous substitutions (including multiple substitutions at the same codon) mapped to 64 variable amino acid sites (Fig. 2). Most of the amino acid variability mapped to VP1 (the number of variable sites was 34 for VP1, 15 for VP2, 12 for VP3, and 3 for VP4), and nearly half (14 of 34) of the substitutions mapped to the highly variable (79) and structurally disordered (35) 32 amino-terminal residues of VP1. Amino acid replacements generally clustered in loops connecting the beta strands, and most replacements were conservative (88).
Only a small proportion (17%) of the variable sites mapped within or near the neutralizing antigenic (NAg) sites (Fig. 2 and 4). None of the P1/capsid region sites appeared to be under positive selection during circulation of the Andean lineages. A measure of the intensity of selection at a site is the ratio (ω) of nonsynonymous to synonymous substitutions (Ka/Ks or dN/dS). When ω is >1, the site is inferred to be under positive selection; when ω is 1, the site is inferred to be under no selection; and when ω is <1, the site is inferred to be under negative (purifying) selection. No positively selected sites were found under six different models of codon evolution (95), and the models with the highest estimated likelihoods all yielded ω values of <1 (see Table S1 in the supplemental material). When codons for three different P1/capsid domains (NAg sites, non-NAg sites, and highly variable sites) were considered separately, all were found to be under purifying selection, and there was little fluctuation of ω values along lineages (Table 2). Interestingly, average ω values from root to descendant lineages were lowest for non-NAg sites, higher for the highly variable sites, and highest for the NAg sites. These findings suggest that selection for amino acid conservation was strong throughout the P1/capsid region, but stronger for the non-NAg sites than for the highly variable and NAg sites.
FIG. 4.

Sequences of amino acid residues within or bounding NAg sites 1 (VP1 amino acids 95 to 106), 2 (VP2 amino acids 164 to 173, VP2 amino acids 269 to 271, and VP1 amino acids 221 to 226), 3a (VP3 amino acids 56 to 62; VP3 amino acids 70 to 74, and VP1 amino acids 287 to 292), and 3b (VP2 amino acids 71 to 73 and VP3 amino acids 75 to 79). The reference sequence is that of VEN81-1. Residues defining the type 1 poliovirus NAg sites by mutations conferring resistance to neutralization by monoclonal antibodies (4, 56, 60, 83) are indicated in bold. Isolates having identical sequences in the NAg sites are grouped and identified by italicized capital letters, described in the legend to Fig. 1.
TABLE 2.
Relative rates of fixation (ω) of Ka (dN) and Ks (ds) substitutions into NAg and non-NAg sites from root to descendant lineages
| P1/capsid domain | ω (dN/ds) value from root lineage A to descendant lineage
|
Avg ω value | |||||||||
|---|---|---|---|---|---|---|---|---|---|---|---|
| B | C | D | E | F | G | H | I | J | K | ||
| NAg sitesa | 0.070 | 0.040 | 0.046 | 0.066 | 0.061 | 0.033 | 0.077 | 0.074 | 0.148 | 0.109 | 0.066 |
| Non-NAg sitesb | 0.021 | 0.020 | 0.018 | 0.025 | 0.017 | 0.017 | 0.020 | 0.015 | 0.012 | 0.013 | 0.018 |
| Highly variable sitesc | 0.056 | 0.089 | 0.062 | 0.032 | 0.056 | 0.033 | 0.030 | 0.022 | 0.026 | 0.021 | 0.040 |
Although evolution of the NAg sites appears to have occurred primarily by genetic drift, several independent pathways of antigenic evolution from the VEN81-1 root could be inferred from comparison of the tree (Fig. 1) with the alignment of the NAg sites (Fig. 4). The pathways of NAg changes included progressive fixation (A→G→ I→J), diverging pathways (I→J and I→K), and fluctuating patterns (A→C→A) (Fig. 1 and 4).
Relative frequencies of specific base changes.
The frequency of transitions between pyrimidines (C↔U) in the P1/capsid region was ∼1.4 times higher than that of transitions between purines (G↔A) (Fig. 5), consistent with the approximately equimolar base composition of the P1/capsid sequences and a slight bias toward C+U nucleotide bases at degenerate 3CPs. The unequal rates between the eight types of transversions were more pronounced. For example, U→A substitutions accounted for ∼30% of all transversions and the U→A frequency was about 30 times higher than that of the most infrequent transversion, C→G. Direct C→G transversions appear to be rare in poliovirus (39, 46, 52, 75, 89, 90) and other picornaviruses (24), and most C→G substitutions in poliovirus probably occur via two steps, C→A→G, as inferred several times for the Andean lineages.
FIG. 5.

ML estimates of relative frequencies of specific base changes (10−2) (black arrows, transitions; gray arrows, transversions) at all codon positions within the P1/capsid regions of the Andean isolates during divergence from the VEN81-1 root sequence.
The relative frequencies of purine→pyrimidine (0.039) and pyrimidine→purine (0.044) transversions were nearly equivalent (Fig. 5). These frequencies reflect in part the estimated ∼10-fold ratio of transition/transversion misincorporations by the poliovirus RNA-dependent RNA polymerase (2). Fixation of transversions in the P1/capsid region is further constrained by purifying selection at nonsynonymous sites and by the poliovirus codon usage bias (68, 73, 79). When transition frequencies in the VEN81-1 P1/capsid sequence were normalized to all degenerate 3CP sites (n = 834) and transversion frequencies were normalized to the number of threefold (n = 39) and fourfold (n = 496) degenerate 3CP sites, the transition/transversion frequency ratio was ∼8. Notably, a lower transition/transversion frequency ratio of 4.4 was obtained for the highly variable (51, 79) 5′-untranslated region (5′-UTR) sequences (nt 640 to 742) immediately preceding the start codon, an interval where base substitution is not constrained by amino acid conservation, RNA secondary structure (61), or codon usage bias.
Rates of fixation of different categories of nucleotide substitutions.
Three basic approaches are used to determine rates of nucleotide substitution, including linear regression (44), ML (69), and Bayesian inference (20, 22). The three approaches yielded very similar results for the rates of fixation of Kt, K′s, A′s, and B′s substitutions (the “prime” symbol indicates normalization of substitution categories to total sites) into the P1/capsid region (Table 3; see Table S2 in the supplemental material).
TABLE 3.
Substitution rates for P1/capsid sequences (2,643 nt)
| Substitution categorya | Rate (no. of substitutions/site/yr, 10−2)
|
||
|---|---|---|---|
| Regression rate (R2)b | SRDT rate | Bayesian rate (95% HPD)c | |
| Kt | 1.04 ± 0.08 (0.96) | 1.03 ± 0.10 | 1.01 (0.90-1.13) |
| K′s | 1.10 ± 0.09 (0.94) | 1.00 ± 0.08 | 0.98 (0.89-1.07) |
| K′a | 0.03 ± 0.01 (0.63) | 0.03 ± 0.01 | 0.04 (0.02-0.06) |
| A′s | 0.99 ± 0.08 (0.84) | 0.96 ± 0.09 | 0.86 (0.78-0.95) |
| B′s | 0.11 ± 0.02 (0.95) | 0.10 ± 0.03 | 0.09 (0.06-0.12) |
Substitution categories were normalized to total sites by using the following relationships: K′s = Ks × Ls/LT, K′a = Ka × LN/LT, A′s = As × Ls/LT, and B′s = Bs × Ls/LT. Estimates of the numbers of each site were calculated by implementation of the program K-Estimator (11) (number of LT sites = 2,643, number of Ls sites ≈ 909, and number of LN sites ≈ 1,734). Regression and SRDT data are point estimates ± the range of 95% confidence intervals.
Linear regression lines were estimated without intercepts forced through the origin.
HPD, highest posterior density (22).
Linear regression could be applied in this study because the phylogeny was well defined. The rates of fixation of Kt, K′s, A′s, and B′s substitutions were approximately linear over the 10-year period of circulation (Fig. 6; Table 3). The rates of fixation of K′a substitutions were also approximately linear, but with a lower R2 value and proportionately wider confidence intervals. K′s substitutions were fixed at an ∼10-fold higher rate than B′s substitutions and at an ∼30-fold overall higher rate than K′a substitutions. The rates of fixation for each category of substitution were similar between the northern and southern lineages (see Table S3 in the supplemental material), consistent with a molecular clock.
FIG. 6.

Estimation by linear regression of the rates of fixation of different categories of nucleotide substitutions into the P1/capsid regions of 31 Andean isolates. (A to C) For the abscissa, the time the sample was taken for each isolate (zero time, time of sampling for isolate VEN81-1, assumed to be 1 July 1981) is given. For the ordinate, corrected P1/capsid nucleotide substitution differences were normalized to total sites (Kt) (A), total synonymous (Ks) or nonsynonymous (Ka) sites (B), and total synonymous sites (As and Bs) (C) (zero substitutions, sequence of VEN81-1). Rates were calculated as described in Materials and Methods. (D) Relative rates of fixation of As and Bs substitutions (slope = 0.109; R2 = 0.86).
Overall rates of Kt, K′s, A′s, and B′s substitutions calculated by the ML/SRDT method for the individual capsid proteins (VP0, VP3, and VP1) were similar to the P1/capsid estimates (see Table S4 in the supplemental material), but the corresponding rates of K′a substitutions (not shown) were more variable because of the relatively small number of nonsynonymous substitutions among the closely related Andean isolates (Fig. 2).
Testing the molecular clocks.
The hypothesis that the rates of fixation of Kt, K′s, A′s, B′s, and K′a substitutions were consistent with molecular clocks was tested in LRTs (26, 65). The probability values for all five molecular clocks in the LRTs were well above the rejection threshold (α = 0.05) (Table 4). P values were highest for the B′s (0.65), Kt (0.59), and K′s (0.49) clocks and lower for the A′s (0.42) and K′a (0.14) clocks and were inversely proportional to the estimated 95% CI for the Kt, K′s, and A′s rates. In contrast, the CI for the B′s clock represents ∼40% of the estimated rate, despite scoring the highest P value, and the CI for the more variable K′a clock represents ∼70% of the estimated rate.
TABLE 4.
SRDT rates for consensus alignments of P1/capsid sequences
| Substitution category | Rate (10−2)a | 2Δℓ | P value |
|---|---|---|---|
| Kt | 1.03 ± 0.10 | 25.5 | 0.59 |
| K′s | 1.00 ± 0.08 | 27.3 | 0.49 |
| K′a | 0.03 ± 0.01 | 31.2 | 0.14 |
| A′s | 0.96 ± 0.09 | 28.7 | 0.42 |
| B′s | 0.10 ± 0.03 | 24.5 | 0.65 |
Rates (substitutions/site/year) were determined for each category of nucleotide substitution according to the substitution models selected by MODELTEST, as described in Materials and Methods and in Table S2 in the supplemental material.
Differential rates of saturation of transitions and transversions.
The total time between specimen collection for the earliest (VEN81-1 and VEN81-2) and latest (COL91-8 and PER91) isolates is approximately 10 years (Fig. 1). However, because the northern and southern lineages apparently diverged within ∼6 months of the earliest recognized cases, the most divergent pair of isolates, COL91-8 and PER91, had been separated by a total of ∼19 years of independent evolution. Under the assumption that nucleotide substitution occurred via time-reversible Markov chains (26), saturation of variable sites was analyzed beyond the actual 10-year period of observation, for up to nearly 20 years, by rerooting of the tree (Fig. 7A and B). Although it is evident from the pattern of nucleotide substitution (Fig. 5) that the assumption of reversibility of specific base changes does not strictly hold, the most frequent base substitutions (A↔G, C↔U, and A↔U; 95% of total) and the overall purine↔pyrimidine substitutions were approximately time reversible, such that the assumption of time reversibility was not rejected by the MODELTEST program (66). When the ML/SRDT tree was rerooted to the sequence of COL91-8 or PER91, we were able to estimate the kinetics of saturation of transition and transversion substitutions over a period of nearly 20 years.
FIG. 7.

Saturation of 3CP transitions (closed circles), 3CP transversions (open circles), and total 3CP substitutions (triangles) in the P1/capsid region over the total period of independent evolution of the northern and southern lineages. (A) Uncorrected pairwise 3CP differences between all 31 isolates (ordinate) were plotted as a function of time of evolutionary separation (estimated from branch lengths of the ML/SRDT tree [Fig. 1]). (B) Pairwise 3CP differences corrected by use of the REV model of nucleotide substitution. (C) Simulation of saturation of 3CP transitions (closed circles), 3CP transversions (open circles), and total 3CP substitutions (triangles) in the P1/capsid region over a 100-year period, calculated by using the mutate program in MATLAB as described in Materials and Methods. The boxed area represents the time interval shown in panels A and B.
We restricted our analyses to 3CP substitutions, which represented 89% of all substitutions and >99% of which were synonymous (see the previous section). When all uncorrected pairwise 3CP transition (As + Aa), transversion (Bs + Ba), and total (Kt) P1/capsid differences among isolates were plotted as a function of total time of evolutionary separation, 3CP transitions (and, consequently, total 3CP substitutions) began to saturate before 10 years (Fig. 7A). By 20 years of total evolutionary divergence, uncorrected pairwise comparisons would underestimate the actual number of 3CP transitions and total 3CP substitutions by ∼40%. In contrast, 3CP transversions saturated much more slowly, and at 20 years the predicted underestimate from pairwise comparisons was only ∼10% (Fig. 7A).
When 3CP transition differences were corrected by application of the REV substitution model (91), using the ML estimates of the nucleotide substitution rate parameters (Fig. 5), the period of apparently linear accumulation of 3CP transitions was extended to ∼10 years (Fig. 7B). However, by 20 years of evolutionary divergence, saturation of 3CP transitions was evident, and REV-corrected pairwise comparisons of sequences of the most divergent isolates were predicted to underestimate the actual number of 3CP transitions by ∼10% (Fig. 7B), illustrating the effects of increased saturation of variable sites on even the most robust substitution models (Fig. 3) (26, 34). In contrast, the REV model was able to fully correct for the predicted limited saturation of 3CP transversions at 20 years (Fig. 7B).
Predicted useful ranges of the Ks, As, and Bs clocks.
The above analyses suggest that comparing the number of P1/capsid 3CP differences between moderately divergent poliovirus isolates may be used to estimate their total time of evolutionary separation for up to ∼20 years. Pairwise transversion differences can be used without correction for time estimates of up to 20 years, but transition differences require correction for time estimates in the 10- to 20-year range. Because no continuous, well-defined poliovirus lineages with isolates having more than 20 years of total evolutionary separation have been identified, we cannot rigorously apply the above approach beyond 20 years. Therefore, we applied mathematical modeling to simulate the evolution of P1/capsid 3CP substitutions from the VEN81-1 root (see Fig. S2 in the supplemental material) in order to investigate the saturation kinetics of transitions and transversions over an ∼100-year period (Fig. 7C). Simulations were performed by using the program mutate in MATLAB, applying the initial 3CP base distribution vector for VEN81-1 and a substitution matrix based upon the relative frequencies of specific base changes given in Fig. 5, but with the transversion frequencies increased 1.8-fold to correct for the observation that only ∼56% of P1/capsid 3CPs were fourfold degenerate sites. Simulations were performed for a total of 200 time steps (equivalent to ∼6 months of evolution per time step), and the abscissa of the plot of the simulated saturation curves was scaled to years by assuming a rate of 0.03 substitutions/3CP site/year. Across the 0- to 20-year time interval, the saturation curves for 3CP transitions, transversions, and total substitutions in the P1/capsid region predicted by the simulation (Fig. 7C, boxed area) were very similar to those obtained by rerooting of the natural sequences (Fig. 7A). Beyond 20 years, the simulation predicted that P1/capsid 3CP transition differences would reach a maximum of ∼40% at ∼65 years of evolution (and then gradually decline), in excellent agreement with the observed 3CP transition differences (up to 42% in VP1) across divergent type 1 poliovirus genotypes (data not shown). Transversions at fourfold degenerate 3CPs were predicted to gradually saturate, and by 100 years they would be fixed into ∼23% of fourfold degenerate 3CPs (Fig. 7C), well below the saturation limit (∼37% in VP1) observed across highly divergent type 1 poliovirus genotypes. At 100 years, the increase in total 3CP substitutions was predicted by the simulation to be driven exclusively by accumulation of transversions, which would constitute an increasing proportion of the total number of substitutions (Fig. 7C).
DISCUSSION
We have calibrated five different poliovirus molecular clocks based upon the rates of Kt, Ks, As, Bs, and Ka substitutions in the P1/capsid region of circulating type 1 polioviruses. The rapid Kt and K′s clocks were driven primarily by the A′s clock, whereas the B′s clock was ∼10-fold slower, and the more stochastic K′a clock was ∼30-fold slower. The Kt, K′s, and A′s clocks are useful in high-resolution molecular epidemiologic studies supporting the current drive to eradicate polio (85). In contrast, the B′s clock has potential for estimating more distant evolutionary events (26, 32), better resolving different poliovirus genotypes, and providing a broader overview of the global patterns of poliovirus circulation and the occurrence of displacement events. In addition, use of sequence alignments showing only transversion differences can facilitate recognition of recombination breakpoints that would otherwise be obscured by the high background of transitions (J. Jorba, unpublished results).
The precision of molecular clock calibrations is a function of the evolution rate, the time interval for sampling, the sequence length (21), and the availability of biological material with a well-defined evolutionary history. Each of these factors was favorable in this study. The Kt evolution rate of 1.03 × 10⁻² substitutions/site/year for the poliovirus P1/capsid region is among the highest reported for any RNA virus (17), is lower than the fastest rate reported for equine infectious anemia virus during persistent infection (gp90env; 5.5 × 10⁻²) (48), is similar to rates reported for foot-and-mouth disease virus (complete genome; 8.2 × 10⁻³) (13), influenza A virus (hemagglutinin; 6.3 × 10⁻³) (27), porcine reproductive and respiratory syndrome virus (ORF 3; 5.8 × 10⁻³) (28), and enterovirus 71 (VP1; 4.2 × 10⁻³) (5), and is higher than the rates reported for other rapidly evolving viruses, such as human immunodeficiency virus type 1 (gp160env; 2.4 × 10⁻³) (44), human respiratory syncytial virus (G; 1.9 × 10⁻³) (98), and hepatitis C virus (NS3; 1.5 × 10⁻³) (67).
Our studies were also facilitated by the availability of isolates representing well-defined evolutionary pathways obtained over a 10-year period. The 1981 isolates from Venezuela were closely related to the true imported founder virus, and increasingly sensitive poliovirus surveillance in the Americas (16, 64) yielded an ample number of well-documented direct descendants of the founder virus. Although comprehensive sequence data sets now exist for poliovirus isolates from other regions of endemicity (7, 23), the evolutionary pathways in most areas of endemicity are complex, and isolates closely related to the overall common founder are not generally available (31). The evolutionary pathways of outbreaks are usually well defined, but most outbreaks are of short duration (usually <1 year), precluding extended observation (8, 63).
Sequences within the P1/capsid region comprise the widest interval that can be used routinely to follow poliovirus lineages. Recombination within the P2 and P3 noncapsid and 5′-UTR regions is frequent among circulating polioviruses (33, 39, 51, 90), introducing a potential source of distortion to molecular clocks. Indeed, multiple rounds of recombination with heterologous species C enteroviruses (6) had occurred during the 10 years of circulation of the Andean lineages, but none of the breakpoints mapped within the P1/capsid region (unpublished results). Intertypic or intergenotypic recombination within the P1/capsid region occurs only rarely, and the known crossovers map within 90 nt of the start codon (unpublished results) and 120 nt of the P1/P2 junction (3, 52, 55).
The global evolutionary record for poliovirus is fragmentary, consisting of multiple geographically separate genotypes (40). No extended evolutionary record exists for any specific genotype, and the divergence times for even the most closely related genotypes are presently unknown. Reasonable estimations of divergence times will require a better understanding of the evolutionary range of the dating methods to be used. To facilitate these analyses, we applied two different approaches to overcome the limitations in the available biological record. Rerooting of the phylogenetic trees of the natural sequences enabled us to model the saturation of As and Bs substitutions for up to 20 years, because the early divergence of the Andean lineages effectively doubled the total evolutionary time available for analysis. The initial rates of As and Bs substitutions estimated by rerooting closely corresponded to the rates obtained by linear regression and other methods. Beyond 20 years, it was necessary to apply a second approach, using computer simulation based upon the inferred frequencies of specific base changes. The saturation curves for 3CP transitions (>99% of which were As substitutions) and 3CP transversions (95% of which were Bs substitutions) generated by the two different approaches were in excellent agreement over the 0- to 20-year period open to comparison and were similar to the predictions of the K2P formula at a transition/transversion ratio of 10 (26, 42). The predictions of the simulation were also consistent with the observed VP1 sequence differences across divergent poliovirus genotypes. However, such comparisons explore the limits of 3CP saturation but provide no additional information about the saturation kinetics. Further investigation of the time course for 3CP saturation, especially for transversions, will require comparisons across closely related genotypes.
The simulation predicted that the rate of accumulation of Bs substitutions will decline over time and will be ∼60% of the initial rate at 100 years. Because the CIs for the estimated divergence times will widen as Bs substitutions approach saturation, determination of deeper evolutionary relationships beyond the useful range of the poliovirus Bs clock will require calibration of even slower molecular clocks. Poliovirus clocks based on the component rates for fixation of Ka substitutions, similar to earlier studies on flaviviruses (96), may hold promise. The observation that fixation of P1/capsid amino acid replacements occurs primarily by genetic drift suggests that it may be possible to develop refined poliovirus protein clocks with only limited recourse to site-specific rate adjustments.
A general problem with rapidly evolving RNA viruses is that broader evolutionary trends are difficult to discern (36), and phylogenetic trees of natural isolates are often complex. Phylogenetic trees summarizing only P1/capsid Bs substitutions across poliovirus genotypes have revealed previously unrecognized relationships among some genotypes, and the dates of divergence of those genotypes have been estimated using the Bs clock (unpublished results). These relationships reflect past patterns of transmission during the period of widespread polio endemicity, conditions quite different from the current phase of localized endemicity (85). Understanding of past transmission pathways may contribute to a better understanding of current risks of poliovirus spread from the remaining foci of endemicity. Similar analyses of other rapidly evolving RNA viruses, especially agents of vaccine-preventable diseases known to have significant transition biases (13, 71, 97), may aid in the development of improved strategies for their control.
Supplementary Material
Acknowledgments
We thank Jorge Boshell, Rosalba Salas, Edson da Silva, and Gina Tambini for sharing their poliovirus isolates with us, Naomi Dybdahl-Sissoko, Deborah Moore, Annelet Vincent, and A. J. Williams for excellent technical assistance, and David Kilpatrick for designing many of the sequencing primers used in this study. We thank Albert Bosch for encouragement and helpful discussions and three anonymous reviewers for constructive comments.
The findings and conclusions in this report are those of the authors and do not necessarily represent the views of the funding agency.
Footnotes
Published ahead of print on 20 February 2008.
Supplemental material for this article may be found at http://jvi.asm.org/.
REFERENCES
- 1.Allman, E. S., and J. A. Rhodes. 2004. Mathematical models in biology: an introduction. Cambridge University Press, New York, NY.
- 2.Arnold, J. J., and C. E. Cameron. 2004. Poliovirus RNA-dependent RNA polymerase (3Dpol): pre-steady-state kinetic analysis of ribonucleotide incorporation in the presence of Mg2+. Biochemistry 435126-5137. [DOI] [PMC free article] [PubMed] [Google Scholar]
- 3.Blomqvist, S., A. L. Bruu, M. Stenvik, and T. Hovi. 2003. Characterization of a recombinant type 3/type 2 poliovirus isolated from a healthy vaccinee and containing a chimeric capsid protein VP1. J. Gen. Virol. 84573-580. [DOI] [PubMed] [Google Scholar]
- 4.Blondel, B., R. Crainic, O. Fichot, G. Dufraisse, A. Candréa, D. Diamond, M. Girard, and F. Horaud. 1986. Mutations conferring resistance to neutralization with monoclonal antibodies in type 1 poliovirus can be located outside or inside the antibody-binding site. J. Virol. 5781-90. [DOI] [PMC free article] [PubMed] [Google Scholar]
- 5.Brown, B. A., M. S. Oberste, J. P. Alexander, Jr., M. L. Kennett, and M. A. Pallansch. 1999. Molecular epidemiology and evolution of enterovirus 71 strains isolated from 1970 to 1998. J. Virol. 739969-9975. [DOI] [PMC free article] [PubMed] [Google Scholar]
- 6.Brown, B. A., M. S. Oberste, K. Maher, and M. Pallansch. 2003. Complete genomic sequencing shows that polioviruses and members of human enterovirus species C are closely related in the non-capsid coding region. J. Virol. 778973-8984. [DOI] [PMC free article] [PubMed] [Google Scholar]
- 7.Centers for Disease Control and Prevention. 2005. Laboratory surveillance for wild and vaccine-derived polioviruses, January 2004-June 2005. Morb. Mortal. Wkly. Rep. 54958-961. [PubMed] [Google Scholar]
- 8.Centers for Disease Control and Prevention. 2006. Resurgence of wild poliovirus type 1 transmission and consequences of importation—21 countries, 2002-2005. Morb. Mortal. Wkly. Rep. 55145-150. [PubMed] [Google Scholar]
- 9.Cherkasova, E. A., M. L. Yakovenko, G. V. Rezapkin, E. A. Korotkova, O. E. Ivanova, T. P. Eremeeva, L. I. Krasnoproshina, N. I. Romanenkova, N. R. Rozaeva, L. Sirota, V. I. Agol, and K. M. Chumakov. 2005. Spread of vaccine-derived poliovirus from a paralytic case in an immunodeficient child: an insight into the natural evolution of oral polio vaccine. J. Virol. 791062-1070. [DOI] [PMC free article] [PubMed] [Google Scholar]
- 10.Chiba, Y., H. Murakami, M. Kobayashi, H. Shimizu, H. Yoshida, T. Yoneyama, T. Miyamura, J. Yu, and L. Zhang. 2000. A case of poliomyelitis associated with infection of wild poliovirus in Qinghai Province, China, in October 1999. Jpn. J. Infect. Dis. 53135-136. [PubMed] [Google Scholar]
- 11.Comeron, J. M. 1999. K-Estimator: calculation of the number of nucleotide substitutions per site and the confidence intervals. Bioinformatics 15763-764. [DOI] [PubMed] [Google Scholar]
- 12.Comeron, J. M. 1995. A method for estimating the numbers of synonymous and nonsynonymous substitutions per site. J. Mol. Evol. 411152-1159. [DOI] [PubMed] [Google Scholar]
- 13.Cottam, E. M., D. T. Haydon, D. J. Paton, J. Gloster, J. W. Wilesmith, N. P. Ferris, G. H. Hutchings, and D. P. King. 2006. Molecular epidemiology of the foot-and-mouth disease virus outbreak in the United Kingdom in 2001. J. Virol. 8011274-11282. [DOI] [PMC free article] [PubMed] [Google Scholar]
- 14.De, L., C.-F. Yang, E. da Silva, J. Boshell, P. Cáceres, J. R. Gómez, M. Pallansch, and O. Kew. 1997. Genotype-specific RNA probes for the direct identification of wild polioviruses by blot hybridization. J. Clin. Microbiol. 352834-2840. [DOI] [PMC free article] [PubMed] [Google Scholar]
- 15.de la Torre, J. C., C. Giachetti, B. L. Semler, and J. J. Holland. 1992. High frequency of single-base transitions and extreme frequency of precise multiple-base reversion mutations in poliovirus. Proc. Natl. Acad. Sci. USA 892531-2535. [DOI] [PMC free article] [PubMed] [Google Scholar]
- 16.de Quadros, C. A., J. K. Andrus, J. M. Olive, C. Guerra de Macedo, and D. A. Henderson. 1992. Polio eradication from the Western Hemisphere. Annu. Rev. Public Health 13239-252. [DOI] [PubMed] [Google Scholar]
- 17.Domingo, E. 2007. Virus evolution, p. 389-421. In D. M. Knipe, P. M. Howley, D. E. Griffin, R. A. Lamb, M. A. Martin, B. Roizman, and S. E. Straus (ed.), Fields virology, 5th ed., vol. 1. Lippincott Williams & Wilkins, Philadelphia, PA. [Google Scholar]
- 18.Domingo, E., C. Escarmís, N. Sevilla, A. Moya, S. Elena, J. Quer, I. S. Novella, and J. J. Holland. 1996. Basic concepts in RNA virus evolution. FASEB J. 10859-864. [DOI] [PubMed] [Google Scholar]
- 19.Drake, J. W. 1993. Rates of spontaneous mutation among RNA viruses. Proc. Natl. Acad. Sci. USA 904171-4175. [DOI] [PMC free article] [PubMed] [Google Scholar]
- 20.Drummond, A., O. G. Pybus, and A. Rambaut. 2003. Inference of viral evolutionary rates from molecular sequences. Adv. Parasitol. 54331-358. [DOI] [PubMed] [Google Scholar]
- 21.Drummond, A. J., O. G. Pybus, A. Rambaut, R. Forsberg, and A. G. Rodrigo. 2003. Measurably evolving populations. Trends Ecol. Evol. 18481-488. [Google Scholar]
- 22.Drummond, A. J., and A. Rambaut. 2006. BEAST v1.4. http://beast.bio.ed.ac.uk.
- 23.El Bassioni, L., I. Barakat, E. Nasr, E. M. de Gourville, T. Hovi, S. Blomqvist, C. Burns, M. Stenvik, H. Gary, O. M. Kew, M. A. Pallansch, and M. H. Wahdan. 2003. Prolonged detection of indigenous wild polioviruses in sewage from communities in Egypt. Am. J. Epidemiol. 158807-815. [DOI] [PubMed] [Google Scholar]
- 24.Fares, M. A., A. Moya, C. Escarmís, E. Baranowski, E. Domingo, and E. Barrio. 2001. Evidence for positive selection in the capsid protein-coding region of the foot-and-mouth-disease virus (FMDV) subjected to experimental passage regimens. Mol. Biol. Evol. 1810-21. [DOI] [PubMed] [Google Scholar]
- 25.Felsenstein, J. 1981. Evolutionary trees from DNA sequences: a maximum likelihood approach. J. Mol. Evol. 17368-376. [DOI] [PubMed] [Google Scholar]
- 26.Felsenstein, J. 2004. Inferring phylogenies. Sinauer Associates, Sunderland, MA.
- 27.Fitch, W. M. 1996. The variety of human virus evolution. Mol. Phylogenet. Evol. 5247-258. [DOI] [PubMed] [Google Scholar]
- 28.Forsberg, R., M. B. Oleksiewicz, A. M. Petersen, J. Hein, A. Botner, and T. Storgaard. 2001. A molecular clock dates the common ancestor of European-type porcine reproductive and respiratory syndrome virus at more than 10 years before the emergence of disease. Virology 289174-179. [DOI] [PubMed] [Google Scholar]
- 29.Fourment, M., and M. J. Gibbs. 2006. PATRISTIC: a program for calculating patristic distances and graphically comparing the components of genetic change. BMC Evol. Biol. 61. [DOI] [PMC free article] [PubMed] [Google Scholar]
- 30.Galtier, N., M. Gouy, and C. Gautier. 1996. SEAVIEW and PHYLO_WIN: two graphic tools for sequence alignment and molecular phylogeny. Comput. Appl. Biosci. 12543-548. [DOI] [PubMed] [Google Scholar]
- 31.Gavrilin, G. V., E. A. Cherkasova, G. Y. Lipskaya, O. M. Kew, and V. I. Agol. 2000. Evolution of circulating wild poliovirus and of vaccine-derived poliovirus in an immunodeficient patient: a unifying model. J. Virol. 747381-7390. [DOI] [PMC free article] [PubMed] [Google Scholar]
- 32.Goldstein, D. B., and D. D. Pollock. 1994. Least squares estimation of molecular distance—noise abatement in phylogenetic reconstruction. Theor. Popul. Biol. 45219-226. [DOI] [PubMed] [Google Scholar]
- 33.Guillot, S., V. Caro, N. Cuervo, E. Korotkova, M. Combiescu, A. Persu, A. Aubert-Combiescu, F. Delpeyroux, and R. Crainic. 2000. Natural genetic exchanges between vaccine and wild poliovirus strains in humans. J. Virol. 748434-8443. [DOI] [PMC free article] [PubMed] [Google Scholar]
- 34.Hillis, D. M., B. K. Mable, and C. Moritz. 1996. Applications of molecular systematics, p. 515-543. In D. M. Hillis, C. Moritz, and B. K. Mable (ed.), Molecular systematics, 2nd ed. Sinauer Associates, Sunderland, MA.
- 35.Hogle, J. M., M. Chow, and D. J. Filman. 1985. The three-dimensional structure of poliovirus at 2.9 Å resolution. Science 2291358-1365. [DOI] [PubMed] [Google Scholar]
- 36.Holmes, E. C. 2003. Molecular clocks and the puzzle of RNA virus origins. J. Virol. 773893-3897. [DOI] [PMC free article] [PubMed] [Google Scholar]
- 37.Huelsenbeck, J. P., and K. A. Crandall. 1997. Phylogeny estimation and hypothesis testing using maximum likelihood. Annu. Rev. Ecol. Syst. 28437-466. [Google Scholar]
- 38.Jenkins, G. M., A. Rambaut, O. G. Pybus, and E. C. Holmes. 2002. Rates of molecular evolution in RNA viruses: a quantitative phylogenetic analysis. J. Mol. Evol. 54156-165. [DOI] [PubMed] [Google Scholar]
- 39.Kew, O. M., V. Morris-Glasgow, M. Landaverde, C. Burns, J. Shaw, Z. Garib, J. André, E. Blackman, C. J. Freeman, J. Jorba, R. Sutter, G. Tambini, L. Venczel, C. Pedreira, F. Laender, H. Shimizu, T. Yoneyama, T. Miyamura, H. van der Avoort, M. S. Oberste, D. Kilpatrick, S. Cochi, M. Pallansch, and C. de Quadros. 2002. Outbreak of poliomyelitis in Hispaniola associated with circulating type 1 vaccine-derived poliovirus. Science 296356-359. [DOI] [PubMed] [Google Scholar]
- 40.Kew, O. M., M. N. Mulders, G. Y. Lipskaya, E. E. da Silva, and M. A. Pallansch. 1995. Molecular epidemiology of polioviruses. Semin. Virol. 6401-414. [Google Scholar]
- 41.Kew, O. M., and M. A. Pallansch. 2002. The mechanism of polio eradication, p. 481-491. In B. L. Semler and E. Wimmer (ed.), Molecular biology of picornaviruses. ASM Press, Washington, DC.
- 42.Kimura, M. 1980. A simple method for estimating evolutionary rates of base substitutions through comparative studies of nucleotide sequences. J. Mol. Evol. 16111-120. [DOI] [PubMed] [Google Scholar]
- 43.Kinnunen, L., T. Pöyry, and T. Hovi. 1991. Generation of virus genetic lineages during an outbreak of poliomyelitis. J. Gen. Virol. 722483-2489. [DOI] [PubMed] [Google Scholar]
- 44.Korber, B., M. Muldoon, J. Theiler, F. Gao, R. Gupta, A. Lapedes, B. H. Hahn, S. Wolinsky, and T. Bhattacharya. 2000. Timing the ancestor of the HIV-1 pandemic strains. Science 2881789-1796. [DOI] [PubMed] [Google Scholar]
- 45.Koshi, J. M., and R. A. Goldstein. 1996. Probabilistic reconstruction of ancestral protein sequences. J. Mol. Evol. 42313-320. [DOI] [PubMed] [Google Scholar]
- 46.Kuge, S., N. Kawamura, and A. Nomoto. 1989. Strong inclination toward transition mutation in nucleotide substitutions by poliovirus replicase. J. Mol. Biol. 207175-182. [DOI] [PubMed] [Google Scholar]
- 47.Kumar, S., K. Tamura, and M. Nei. 2004. MEGA3: integrated software for molecular evolutionary genetics analysis and sequence alignment. Brief. Bioinform. 5150-163. [DOI] [PubMed] [Google Scholar]
- 48.Leroux, C., J. K. Craigo, C. J. Issel, and R. C. Montelaro. 2001. Equine infectious anemia virus genomic evolution in progressor and nonprogressor ponies. J. Virol. 754570-4583. [DOI] [PMC free article] [PubMed] [Google Scholar]
- 49.Li, W.-H. 1993. Unbiased estimation of the rates of synonymous and nonsynonymous substitution. J. Mol. Evol. 3696-99. [DOI] [PubMed] [Google Scholar]
- 50.Li, W.-H., C.-I. Wu, and C.-C. Luo. 1985. A new method for estimating synonymous and nonsynonymous rates of nucleotide substitution considering the relative likelihood of nucleotide and codon changes. Mol. Biol. Evol. 2150-174. [DOI] [PubMed] [Google Scholar]
- 51.Liu, H.-M., D.-P. Zheng, L.-B. Zhang, M. S. Oberste, O. M. Kew, and M. A. Pallansch. 2003. Serial recombination during circulation of type 1 wild-vaccine recombinant polioviruses in China. J. Virol. 7710994-11005. [DOI] [PMC free article] [PubMed] [Google Scholar]
- 52.Liu, H.-M., D.-P. Zheng, L.-B. Zhang, M. S. Oberste, M. A. Pallansch, and O. M. Kew. 2000. Molecular evolution of a type 1 wild-vaccine poliovirus recombinant during widespread circulation in China. J. Virol. 7411153-11161. [DOI] [PMC free article] [PubMed] [Google Scholar]
- 53.Martín, J., G. Dunn, R. Hull, V. Patel, and P. D. Minor. 2000. Evolution of the Sabin strain of type 3 poliovirus in an immunodeficient patient during the entire 637-day period of virus excretion. J. Virol. 743001-3010. [DOI] [PMC free article] [PubMed] [Google Scholar]
- 54.Martín, J., K. Odoom, G. Tuite, G. Dunn, N. Hopewell, G. Cooper, C. Fitzharris, K. Butler, W. W. Hall, and P. D. Minor. 2004. Long-term excretion of vaccine-derived poliovirus by a healthy child. J. Virol. 7813839-13847. [DOI] [PMC free article] [PubMed] [Google Scholar]
- 55.Martín, J., E. Samoilovich, G. Dunn, A. Lackenby, E. Feldman, A. Heath, E. Svirchevskaya, G. Cooper, M. Yermalovich, and P. D. Minor. 2002. Isolation of an intertypic poliovirus capsid recombinant from a child with vaccine-associated paralytic poliomyelitis. J. Virol. 7610921-10928. [DOI] [PMC free article] [PubMed] [Google Scholar]
- 56.Minor, P. D. 1990. Antigenic structure of picornaviruses. Curr. Top. Microbiol. Immunol. 161121-154. [DOI] [PubMed] [Google Scholar]
- 57.Nomoto, A., T. Omata, H. Toyoda, S. Kuge, H. Horie, Y. Kataoka, Y. Genba, Y. Nakano, and N. Imura. 1982. Complete nucleotide sequence of the attenuated poliovirus Sabin 1 strain genome. Proc. Natl. Acad. Sci. USA 795793-5797. [DOI] [PMC free article] [PubMed] [Google Scholar]
- 58.Nottay, B. K., O. M. Kew, M. H. Hatch, J. T. Heyward, and J. F. Obijeski. 1981. Molecular variation of type 1 vaccine-related and wild polioviruses during replication in humans. Virology 108405-423. [DOI] [PubMed] [Google Scholar]
- 59.Olsen, G. J., H. Matsuda, R. Hagstrom, and R. Overbeek. 1994. fastDNAmL: a tool for construction of phylogenetic trees of DNA sequences using maximum likelihood. Comput. Appl. Biosci. 1041-48. [DOI] [PubMed] [Google Scholar]
- 60.Page, G. S., A. G. Mosser, J. M. Hogle, D. J. Filman, R. R. Rueckert, and M. Chow. 1988. Three-dimensional structure of poliovirus serotype 1 neutralizing determinants. J. Virol. 621781-1794. [DOI] [PMC free article] [PubMed] [Google Scholar]
- 61.Palmenberg, A. C., and J.-Y. Sgro. 1997. Topological organization of picornaviral genomes: statistical prediction of RNA structural signals. Semin. Virol. 8231-241. [Google Scholar]
- 62.Pamilo, P., and N. O. Bianchi. 1993. Evolution of the ZFX and ZFY genes: rates and interdependence between the genes. Mol. Biol. Evol. 10271-281. [DOI] [PubMed] [Google Scholar]
- 63.Patriarca, P. A., R. W. Sutter, and P. M. Oostvogel. 1997. Outbreaks of paralytic poliomyelitis. 1976-1995. J. Infect. Dis. 175(Suppl. 1)S165-S172. [DOI] [PubMed] [Google Scholar]
- 64.Pinheiro, F. P., O. Kew, M. H. Hatch, C. M. Silveira, and C. A. de Quadros. 1997. Eradication of wild polioviruses from the Americas. II. Wild poliovirus surveillance: laboratory issues. J. Clin. Microbiol. 175(Suppl. 1)S43-S49. [DOI] [PubMed] [Google Scholar]
- 65.Posada, D., and T. R. Buckley. 2004. Model selection and model averaging in phylogenetics: advantages of Akaike information criterion and Bayesian approaches over likelihood ratio tests. Syst. Biol. 53793-808. [DOI] [PubMed] [Google Scholar]
- 66.Posada, D., and K. A. Crandall. 1998. MODELTEST: testing the model of DNA substitution. Bioinformatics 14817-818. [DOI] [PubMed] [Google Scholar]
- 67.Quer, J., J. I. Esteban, J. Cos, S. Sauleda, L. Ocana, M. Martell, T. Otero, M. Cubero, E. Palou, P. Murillo, R. Esteban, and J. Guardia. 2005. Effect of bottlenecking on evolution of the nonstructural protein 3 gene of hepatitis C virus during sexually transmitted acute resolving infection. J. Virol. 7915131-15141. [DOI] [PMC free article] [PubMed] [Google Scholar]
- 68.Racaniello, V. R., and D. Baltimore. 1981. Molecular cloning of poliovirus cDNA and determination of the complete nucleotide sequence of the viral genome. Proc. Natl. Acad. Sci. USA 784887-4891. [DOI] [PMC free article] [PubMed] [Google Scholar]
- 69.Rambaut, A. 2000. Estimating the rate of molecular evolution: incorporating non-contemporaneous sequences into maximum likelihood phylogenies. Bioinformatics 16395-399. [DOI] [PubMed] [Google Scholar]
- 70.Rico-Hesse, R., M. A. Pallansch, B. K. Nottay, and O. M. Kew. 1987. Geographic distribution of wild poliovirus type 1 genotypes. Virology 160311-322. [DOI] [PubMed] [Google Scholar]
- 71.Rima, B. K., J. A. Earle, K. Baczko, V. ter Meulen, U. G. Liebert, C. Carstens, J. Carabaña, M. Caballero, M. L. Celma, and R. Fernandez-Muñoz. 1997. Sequence divergence of measles virus haemagglutinin during natural evolution and adaptation to cell culture. J. Gen. Virol. 7897-106. [DOI] [PubMed] [Google Scholar]
- 72.Ronquist, F., and J. P. Huelsenbeck. 2003. MrBayes 3: Bayesian phylogenetic inference under mixed models. Bioinformatics 191572-1574. [DOI] [PubMed] [Google Scholar]
- 73.Rothberg, P. G., and E. Wimmer. 1981. Mononucleotide and dinucleotide frequencies, and codon usage in poliovirion RNA. Nucleic Acids Res. 96221-6229. [DOI] [PMC free article] [PubMed] [Google Scholar]
- 74.Shimizu, H., B. Thorley, F. J. Paladin, K. A. Brussen, V. Stambos, L. Yuen, A. Utama, Y. Tano, M. Arita, H. Yoshida, T. Yoneyama, A. Benegas, S. Roesel, M. Pallansch, O. Kew, and T. Miyamura. 2004. Circulation of type 1 vaccine-derived poliovirus in the Philippines in 2001. J. Virol. 7813512-13521. [DOI] [PMC free article] [PubMed] [Google Scholar]
- 75.Shulman, L. M., R. Handsher, S.-J. Yang, C.-F. Yang, J. Manor, A. Vonsover, Z. Grossman, M. Pallansch, E. Mendelson, and O. M. Kew. 2000. Resolution of the pathways of poliovirus type 1 transmission during an outbreak. J. Clin. Microbiol. 38945-952. [DOI] [PMC free article] [PubMed] [Google Scholar]
- 76.Swofford, D. L. 2002. PAUP*. Phylogenetic analysis using parsimony (*and other methods), version 4. Sinaeur Associates, Sunderland, MA.
- 77.Swofford, D. L., G. J. Olsen, D. J. Wadell, and D. M. Hillis. 1996. Phylogenetic inference, p. 407-514. In D. M. Hillis, C. Moritz, and B. K. Mable (ed.), Molecular systematics, 2nd ed. Sinauer Associates, Sunderland, MA.
- 78.Tamura, K., and M. Nei. 1993. Estimation of the number of nucleotide substitutions in the control region of mitochondrial DNA in humans and chimpanzees. Mol. Biol. Evol. 10512-526. [DOI] [PubMed] [Google Scholar]
- 79.Toyoda, H., M. M. Kohara, Y. Kataoka, T. Suganuma, T. Omata, N. Imura, and A. Nomoto. 1984. Complete nucleotide sequences of all three poliovirus serotype genomes: implication for genetic relationship, gene function and antigenic determinants. J. Mol. Biol. 174561-585. [DOI] [PubMed] [Google Scholar]
- 80.Twiddy, S. S., E. C. Holmes, and A. Rambaut. 2003. Inferring the rate and time-scale of dengue virus evolution. Mol. Biol. Evol. 20122-129. [DOI] [PubMed] [Google Scholar]
- 81.Ward, C. D., and J. B. Flanegan. 1992. Determination of the poliovirus RNA polymerase error frequency at eight sites in the viral genome. J. Virol. 663784-3793. [DOI] [PMC free article] [PubMed] [Google Scholar]
- 82.Wells, V. R., S. J. Plotch, and J. J. DeStefano. 2001. Determination of the mutation rate of poliovirus RNA-dependent RNA polymerase. Virus Res. 74119-132. [DOI] [PubMed] [Google Scholar]
- 83.Wiegers, K., H. Uhlig, and R. Dernick. 1988. Evidence for a complex structure of neutralization antigenic site I of poliovirus type 1 Mahoney. J. Virol. 621845-1848. [DOI] [PMC free article] [PubMed] [Google Scholar]
- 84.Wimmer, E., C. U. Hellen, and X. Cao. 1993. Genetics of poliovirus. Annu. Rev. Genet. 27353-436. [DOI] [PubMed] [Google Scholar]
- 85.World Health Organization. 2007. Progress towards interrupting wild poliovirus transmission, January 2006-May 2007. Wkly. Epidemiol. Rec. 82245-251. [PubMed] [Google Scholar]
- 86.Wright, F. 1990. The effective number of codons used in a gene. Gene 8723-29. [DOI] [PubMed] [Google Scholar]
- 87.Xia, X., and Z. Xie. 2001. DAMBE: software package for data analysis in molecular biology and evolution. J. Hered. 92371-373. [DOI] [PubMed] [Google Scholar]
- 88.Xia, X., and Z. Xie. 2002. Protein structure, neighbor effect, and a new index of amino acid dissimilarities. Mol. Biol. Evol. 1958-67. [DOI] [PubMed] [Google Scholar]
- 89.Yang, C.-F., H.-Y. Chen, J. Jorba, H.-C. Sun, S.-J. Yang, H.-C. Lee, Y.-C. Huang, T.-Y. Lin, P.-J. Chen, H. Shimizu, Y. Nishimura, A. Utama, M. Pallansch, T. Miyamura, O. Kew, and J.-Y. Yang. 2005. Intratypic recombination among lineages of type 1 vaccine-derived poliovirus emerging during chronic infection of an immunodeficient patient. J. Virol. 7912623-12634. [DOI] [PMC free article] [PubMed] [Google Scholar]
- 90.Yang, C.-F., T. Naguib, S.-J. Yang, E. Nasr, J. Jorba, N. Ahmed, R. Campagnoli, H. van der Avoort, H. Shimizu, T. Yoneyama, T. Miyamura, M. A. Pallansch, and O. Kew. 2003. Circulation of endemic type 2 vaccine-derived poliovirus in Egypt, 1983 to 1993. J. Virol. 778366-8377. [DOI] [PMC free article] [PubMed] [Google Scholar]
- 91.Yang, Z. 1994. Estimating the pattern of nucleotide substitution. J. Mol. Evol. 39105-111. [DOI] [PubMed] [Google Scholar]
- 92.Yang, Z. 1994. Maximum likelihood phylogenetic estimation from DNA sequences with variable rates over sites: approximate methods. J. Mol. Evol. 39306-314. [DOI] [PubMed] [Google Scholar]
- 93.Yang, Z. 1997. PAML: a program package for phylogenetic analysis by maximum likelihood. Comput. Appl. Biosci. 13555-556. [DOI] [PubMed] [Google Scholar]
- 94.Yang, Z., S. Kumar, and M. Nei. 1995. A new method of inference of ancestral nucleotide and amino acid sequences. Genetics 1411641-1650. [DOI] [PMC free article] [PubMed] [Google Scholar]
- 95.Yang, Z., and R. Nielsen. 2000. Estimating synonymous and nonsynonymous substitution rates under realistic evolutionary models. Mol. Biol. Evol. 1732-43. [DOI] [PubMed] [Google Scholar]
- 96.Zanotto, P. M., E. A. Gould, G. F. Gao, P. H. Harvey, and E. C. Holmes. 1996. Population dynamics of flaviviruses revealed by molecular phylogenies. Proc. Natl. Acad. Sci. USA 93548-553. [DOI] [PMC free article] [PubMed] [Google Scholar]
- 97.Zhou, Y., H. Ushijima, and T. K. Frey. 2007. Genomic analysis of diverse rubella virus genotypes. J. Gen. Virol. 88932-941. [DOI] [PubMed] [Google Scholar]
- 98.Zlateva, K. T., P. Lemey, E. Moes, A.-M. Vandamme, and M. Van Ranst. 2005. Genetic variability and molecular evolution of the human respiratory syncytial virus subgroup B attachment G protein. J. Virol. 799157-9167. [DOI] [PMC free article] [PubMed] [Google Scholar]
Associated Data
This section collects any data citations, data availability statements, or supplementary materials included in this article.