

Abstract
The affinity of microbial cells for hydrophobic interfaces is important because it directly affects the efficiency of various bioprocesses, including green biotechnologies. The toluene-degrading bacterium Acinetobacter sp. strain Tol 5 has filamentous appendages and a hydrophobic cell surface, shows high adhesiveness to solid surfaces, and self-agglutinates. A “bald” mutant of this bacterium, strain T1, lacks the filamentous appendages and has decreased adhesiveness but retains a hydrophobic cell surface. We investigated the interaction between T1 cells and an organic solvent dispersed in an aqueous matrix. During a microbial-adhesion-to-hydrocarbon (MATH) test, which is frequently used to measure cell surface hydrophobicity, T1 cells adhered to hexadecane droplet surfaces in a monolayer, whereas wild-type cells aggregated on the droplet surfaces. The adsorbed T1 cells on the hexadecane surfaces hindered the coalescence of the droplets formed by vortexing, stabilizing the emulsion phase. Following the replacement of the aqueous phase with fresh pure water after the MATH test, a proportion of the T1 cells that had adsorbed to the hydrocarbon surface detached during further vortexing, suggesting a reversible adsorption of T1 cells. The final ratio of the adhering cells to the total cells in the detachment test coincided with that in the MATH test. The adhesion of T1 cells to the hydrocarbon surface conformed to the Langmuir adsorption isotherm, which describes reversible monolayer adsorption. Reversible monolayer adsorption should be useful for green technologies employing two-liquid-phase partitioning systems and for bioremediation because it allows effective reaction and transport of hydrophobic substrates at oil-water interfaces.
The affinity of microbial cells for hydrophobic interfaces is an important property that directly affects the efficiency of various bioprocesses, such as bioremediation, waste treatment, and green biotechnologies, using whole microbial cells. This affinity for hydrophobic surfaces, i.e., cell surface hydrophobicity, has been measured using several methods, such as hydrophobic interaction chromatography (22), contact angle measurement (1, 3), and microbial-adhesion-to-hydrocarbon (MATH) testing (21). Because the results of these tests are relevant only for particular populations of microbial strains and remain open to interpretation (9, 20, 23), the appropriate test depends on the purpose of the measurement.
Although the outcome of MATH tests is affected not only by hydrophobic interactions but also by van der Waals and electrostatic interactions (2, 4, 24, 25), in this test method, the behavior of microbial cells in a two-liquid-phase system and the interaction of the cells with an organic phase, including the affinity of the cells for the organic surface, can be directly evaluated. Therefore, this method provides the best index when considering and designing systems in which microbial conversion at the interface between the aqueous and organic phases is expected. These systems have received increasing attention for use in bioremediation and/or the treatment of oil-contaminated aqueous fields, as well as for microbial conversion in two-liquid-phase partitioning reactors (8, 14, 18).
The toluene-degrading bacterium Acinetobacter sp. strain Tol 5, which was isolated from a biofilter system for off-gas treatment containing toluene, has a highly hydrophobic cell surface and shows high adhesiveness to solid surfaces (13). We have found that Tol 5 cells have filamentous appendages that are responsible for the high adhesiveness (16). Bald cells of a mutant strain (T1) of this bacterium lack these appendages and have weaker adhesiveness to solid surfaces (15). In the current report, we demonstrate a unique interaction between T1 cells and the liquid surfaces of organic solvents.
MATERIALS AND METHODS
Culture conditions.
Wild-type (WT) and mutant strains of Acinetobacter sp. strain Tol 5 were grown in 20 ml of basal salt (BS) medium (16) supplemented with 10 μl of toluene in a 100-ml Erlenmeyer flask. The flask was capped with a rubber stopper and shaken at 115 rpm and 28°C.
MATH and detachment tests.
Bacterial cells were harvested at the stationary growth phase by centrifugation, washed with sterile water, and resuspended to an optical density at 660 nm (OD660) of ∼0.5 in BS medium (pH 7.0) or fresh ultrapure water (pH 6.1) produced by reverse osmosis. Aliquots (1 ml) of the cell suspension were transferred to test tubes (100-mm by 10.5-mm internal diameter), and 10 to 1,000 μl of hexadecane was added. After vigorous vortex mixing for 5 to 60 s, the OD660 of the aqueous layer was measured. The MATH value was calculated from the change in OD660 as follows:
 |
(1) |
For the kinetic MATH test, a number of test tubes equal to the number of time points were prepared and subjected to the MATH test described above. Each test tube was vortexed until the time point for measurement, and 800 μl of the aqueous phase was transferred to a cuvette for measurement of the OD660. To avoid the reduction of volume, different test tubes were used for each measurement. The MATH values obtained from each time point were plotted against vortex time.
For the detachment test, the aqueous layer was removed after the MATH test, leaving the emulsion layer containing hexadecane droplets. The same volume of pure water as that removed was carefully delivered along the inner wall of the test tube. After vortex mixing for 5 to 60 s, the two phases were allowed to separate, and the OD660 of the aqueous phase was measured again to determine the concentration of the cells detached from the hexadecane surface. The ratio (R) of the number of cells still adhering to the solvent surface to the total number of cells was determined from equation 2:
 |
(2) |
where OD660 initially adhering is the OD660 value for the cells adhering at the start of the detachment test and is equal to the number of adherent cells in the MATH test. The OD660 initially adhering is calculated from equation 3:
 |
(3) |
Measurement of the ζ potentials of bacterial cells.
Bacterial cells were harvested at the stationary growth phase by centrifugation, washed with and resuspended in 9.4 mM phosphate-buffered saline (pH 7.4), and diluted to 40 mg dry cells/liter. The ζ potential was measured at 25°C by electrophoretic light scattering using an ELS-800 particle size analyzer (Otsuka Electronics Co., Ltd., Japan). Aggregating WT cells were dispersed by homogenization before the measurement.
Visualization of cell adhesion to glassware.
After the MATH test, both phases were removed with a pipette, and the test tube was air dried. Cells adhering to the surface of the test tube were stained with 7 ml of 0.1% safranine solution for 30 s (11). After the staining, the safranine solution was removed with a pipette, and the inner wall of the test tube was washed twice with BS medium and air dried. The adhering cells were stained red. After a picture was taken, 1 ml of BS medium was added to the test tube, and then the adherent cells were removed from the inner wall of the test tube by ultrasonication. Absorbance at 520 nm was measured for a semiquantification of the adherence of the cells.
Microscopy and analysis of the emulsion.
The stable emulsion obtained in the MATH test was observed using a digital microscope with an ultralong working distance lens (Keyence VH-8000 or VHX-200 microscopes with a VH-Z450 lens) to visualize the cells adhering to the spherical hexadecane droplets with diameters of several tens to hundreds of micrometers. To measure the size of the hexadecane droplets formed by vortex mixing, an unstable dispersion without cells was sampled using a sampling device that enables the dispersion to be fixed instantaneously (12, 14). This device traps the dispersion between two transparent glass plates for direct observation with a microscope. Images were captured with a charge-coupled-device camera, and the droplet sizes were analyzed using Scion Image (Scion Corporation, Frederick, MA). At least 500 droplets were measured to determine the mean diameter and the specific surface area.
RESULTS
Affinity of Acinetobacter strains for the hydrocarbon phase.
To determine the difference in the behaviors of the WT and the “bald” mutant T1 strains of Acinetobacter sp. strain Tol 5 during the MATH test, we compared the changes in the MATH value as a function of vortex time. This kinetic approach revealed that although the MATH values for T1 are high, they are lower than those for the WT strain (Fig. 1). Microscopic examination of the bacterial cells in the emulsion formed in the MATH test showed that WT cells adhere to hexadecane droplets and form aggregates. It appeared that many of the cells adhered to other cells and therefore indirectly to the hexadecane droplets (Fig. 2a). In contrast, T1 cells adhered directly to the surfaces of the hexadecane droplets as a monolayer and did not aggregate (Fig. 2b and c). Microscopic analysis also showed that bacterial cells were not entrapped in the hexadecane droplets. These results demonstrated that the MATH test does not simply represent the affinity of microbial cells for solvent surfaces but also includes cell agglutination. Thus, the lower MATH values for T1 cells than those for WT cells do not necessarily imply a lower affinity of T1 cells for the hydrocarbon phase. Furthermore, the measured ζ potentials of the WT cells and T1 cells were −13.2 and −3.17 mV, respectively. These data imply that the surface potential of the T1 cells is smaller than that of the WT cells; T1 cells are more hydrophobic than WT cells.
FIG. 1.

Comparison of the MATH values for the WT (circles) and T1 (squares) strains of Acinetobacter sp. strain Tol 5. Hexadecane (200 μl) was added to 1 ml of the cell suspension in BS medium and then vortexed. Results are the means (symbols) ± standard deviations (error bars) obtained from three independent cultures.
FIG. 2.

Photomicrographs of microbial adhesion to hexadecane droplets during the MATH test. Bars, 10 μm. A sample of the emulsion formed in the MATH test was placed on a slide glass, covered with a coverslip (a, b) or left uncovered (c), and viewed under a Keyence VH-8000 microscope (a, b) or a VHX-200 (c). (a) WT cells not only adhere to the hexadecane surface but also self-agglutinate to form cell clumps. (b) T1 cells show monolayer adsorption to the surfaces of hexadecane droplets. The yellow dots, which look like sesame seeds, are the microbial cells adhering to the hexadecane droplets in a monolayer. The black boundary surrounding the hexadecane droplets is the interference band of the light, which arises when the light microscope lens is focused on the cells on the spherical droplet surfaces. Clear zones seen at the center of the three largest hexadecane droplets are areas compressed by the coverslip. (c) T1 cells on a hexadecane droplet observed under a different microscope with different focusing and light conditions from those for the image in panel b to avoid the interference band. This image also shows monolayer adsorption of T1 cells to the surface of a hexadecane droplet.
Operational factors affecting the MATH value.
Although the MATH test is frequently employed to study cell hydrophobicity, the procedure has not been standardized; operational conditions, such as the solvent used, the relative volumes of the aqueous and organic phases, and the ionic strength and pH of the aqueous phase, could greatly affect the results. We examined the effects of changing the operational conditions that do not directly affect cell viability, namely, the volume of the organic phase and the ionic strength of the aqueous phase. We used hexadecane in these experiments because it is nontoxic for many bacterial strains, including strain Tol 5, and the most frequently employed solvent for the MATH test.
When we increased the amount of hexadecane from 10 to 1,000 μl while keeping the aqueous phase at 1 ml, the MATH value of T1 increased up to 400 μl of added hexadecane, after which it decreased (Fig. 3a). When less than 200 μl of hexadecane was added in the MATH test, a lower aqueous phase and an upper emulsion phase containing very fine droplets of hexadecane were formed after allowing the test tubes to stand for several minutes (Fig. 3b). The emulsion was stable, and the hexadecane droplets did not coalesce. When more than 400 μl of hexadecane was added, organic (top), emulsion (middle), and aqueous (bottom) phases were formed. The volume of the organic phase increased with the volume of added hexadecane. This emulsion comprised much larger droplets of hexadecane than did emulsions formed using less than 200 μl of hexadecane. The state and volume of the emulsion formed by the MATH test were consistent with the MATH value; specifically, fine droplets and a large volume of the emulsion phase corresponded to a high MATH value. When the volume of added hexadecane was too large, the aqueous and organic phases remained separate and effective mixing was not attained. Thus, the hexadecane droplets formed with low efficiency, resulting in the lack of a hexadecane surface for cell adherence.
FIG. 3.

Effect of hexadecane volume in the MATH test. Various volumes of hexadecane up to 1 ml were added to 1 ml of T1 cell suspension in BS medium and analyzed using the MATH test. The MATH values (a) and the appearance of the test tubes (b) after vortex mixing for 30 s are shown. The results plotted in the graph (a) are the means (symbols) ± standard deviations (error bars) obtained from three independent cultures.
The MATH value is thought to include the adhesion of microbial cells not only to hydrocarbons but also to glassware. Adhesion to glassware should be minimized when the MATH test is employed in order to examine the interaction between microbial cells and hydrocarbons. According to the Derjaguin-Landau-Verwey-Overbeek theory, which has been applied to microbial adhesion to solid surfaces (19), microbial adhesion decreases as the ionic strength decreases (15). Therefore, the use of pure water is expected to minimize cell adhesion to glassware. This was confirmed by staining cells adhered to glassware with safranine after the MATH test. Figure 4 clearly shows that there is less cell adhesion to glassware when the MATH test is performed using pure water than when it is performed with BS medium (ionic strength = 0.34 M). Microscopy, measurement of the OD660, and CFU testing confirmed that T1 cells did not lyse or change in shape during the test, even in pure water, indicating that they were not damaged by low osmotic pressure (data not shown). Therefore, in the following experiments, the MATH test was carried out in pure water and with less than 200 μl of hexadecane.
FIG. 4.

T1 cells adhering to glassware during the MATH test. The T1 cells suspended in 1 ml of BS medium (ionic strength = 0.34 mol/liter) or pure water were subjected to the MATH test with 200 μl of hexadecane for the indicated amounts of time. The adherent cells were stained with safranine. (a) Photographs of cells adhering to the inner walls of the test tubes during the MATH tests in BS medium (top) and pure water (bottom). (b) Semiquantitative data obtained by the measurement of absorbance at 520 nm of the resuspension of the adherent cells in BS medium. Open and filled circles represent the adherent cells during the MATH tests in BS medium and pure water, respectively. The results are the means (symbols) ± standard deviations (error bars) obtained from three independent experiments.
Reversibility of cell adhesion to the hydrocarbon surface.
We next investigated the reversibility of T1 cell adhesion to the hexadecane surface. After the MATH test, the total aqueous phase was replaced by the same volume of fresh pure water and then mixed by vortexing. During vortex mixing, cell release from the hexadecane surface into the aqueous phase was monitored by measuring the OD660 of the aqueous phase. During this detachment test, a fraction of the T1 cells detached from the hexadecane surface into the fresh pure water (Fig. 5a). The final fraction of the adsorbed cells in the detachment test coincided with that obtained in the MATH test (Fig. 5a). The agreement of the final values for the fraction of adsorbed cells obtained in the MATH and detachment tests suggests the achievement of an adsorption equilibrium. Thus, the adhesion of T1 cells to the hexadecane surface appeared to be reversible. In contrast, WT cells did not detach from the organic surface (Fig. 5b). Therefore, the adhesion of WT cells to the hexadecane surface appears to be irreversible.
FIG. 5.

Fraction of the cells adsorbing to the hexadecane surface. Hexadecane (200 μl) was added to 1 ml of the cell suspension of T1 (a) and the WT (b) in pure water and then subjected to the MATH test for 60 s (filled circles). After the MATH test, the total aqueous phase was replaced with the same volume of fresh pure water. The detachment test was carried out by measuring the OD660 of the aqueous solution during subsequent vortexing, and the fraction of cells remaining on the hexadecane surfaces was plotted (open circles). The results are the means (symbols) ± standard deviations (error bars) obtained from three independent cultures.
Description of the MATH test using an adsorption isotherm.
We tried to describe the adhesion of T1 cells to the organic surface using an adsorption isotherm. For this purpose, dispersion was sampled during vortex mixing, and the specific surface areas of the hexadecane droplets formed were measured by microscopy followed by digital image analysis. Each histogram in Fig. 6 shows the size distribution of more than 500 droplets in the dispersion containing 50 or 100 μl of hexadecane in 1 ml of pure water. The mean diameters of the droplets were 97 and 110 μm, and their specific surface areas per volume of hexadecane were 23 and 18 mm2/mm3, respectively. Therefore, the specific surface areas per total liquid volume during vortex mixing were 1,150 and 1,640 mm2/ml, respectively.
FIG. 6.

Size distribution of hexadecane droplets formed by vortex mixing. To 1 ml of pure water, 50 μl (a) or 100 μl (b) of hexadecane was added, and the mixture was vortexed. During vortex mixing, a sample of the emulsion was trapped between the glass plates, and the droplet size distribution was analyzed by microscopy followed by digital image analysis.
To obtain the adsorption isotherm, cell suspensions containing various concentrations of T1 cells in pure water (OD660, from 0.1 to 2.5) were prepared and subjected to the MATH test with 50 and 100 μl of hexadecane for 30 s. The cell concentration corresponding to an OD660 of 1.0 was experimentally determined by CFU counting to be 8.4 × 10⁸ cells/ml. Thus, the OD660 values were converted to the number of cells suspended per unit volume of the aqueous phase. The number of cells adsorbed to hexadecane in the MATH test was calculated from the total number of cells in the test tube, the concentration of suspended cells, and the specific surface area, determined as described above, and then plotted against the suspended cell concentration (Fig. 7). The bacterial cells and the hexadecane droplets were regarded as adsorbate and adsorbent, respectively, to describe the plotted data using an adsorption isotherm. Because our results indicated that T1 cells reversibly adsorb to the hexadecane surface as a monolayer, we used the Langmuir adsorption isotherm:
 |
(4) |
where Y is the amount of the adsorbate adsorbed per unit surface area and corresponds to the number of bacterial cells adsorbed per unit of the hexadecane surface area at equilibrium (cells/mm2 hexadecane), Ymax is the amount of adsorption at saturation and corresponds to the maximum number of bacterial cells that can adsorb to the hexadecane surface (cells/mm2 hexadecane), X is the concentration of the adsorbate in a bulk liquid and corresponds to the concentration of the suspended cells at equilibrium (cells/ml), and a is the adsorption equilibrium constant (ml/cells). Curve fitting of equation 4 was performed for the experimental plots (Fig. 7). We found that the Langmuir adsorption isotherm described by equation 5 was in good agreement with the experimental data:
 |
(5) |
This implies that the maximum number of T1 cells that can bind to the hexadecane surface is 2.8 × 10⁵ cells/mm2. Thus, the adhesion of T1 cells to the organic phase in the MATH test can be described by the Langmuir adsorption isotherm, which describes monolayer adsorption.
FIG. 7.

Application of the adsorption isotherm to the results of the MATH test for T1. The MATH test was performed using 1 ml of T1 cell suspension in pure water and 50 μl (open circles) or 100 μl (filled circles) of hexadecane. The solid line represents the curve fit according to the Langmuir adsorption isotherm. The results are the means (symbols) ± standard deviations (error bars) obtained from three independent cultures.
DISCUSSION
Bald cells of the mutant strain T1 of Acinetobacter sp. strain Tol 5 do not aggregate with each other, although their cell surfaces are still hydrophobic. Therefore, the agglutinating property of the WT strain of Acinetobacter sp. strain Tol 5 appears to be due to the cell appendages rather than surface hydrophobicity. In fact, we previously showed field emission scanning electron microscope images of the appendages mediating cell-cell connections and cell clumping of the WT strain (16). In addition, we have just determined the gene locus that is disrupted in T1; a structural gene of an adhesive appendage protein is disrupted by the insertion of Tn5 (our unpublished data). We have also confirmed that there is no polar effect from the insertion on downstream genes within the polycistronic operon by reverse transcriptase PCR of the mRNA set of T1. Therefore, the loss of the self-agglutinating property of T1 is considered to be due solely to the lack of the cell appendages. According to the data of the ζ potentials of the WT cells and T1 cells, the electrostatic repulsion between two cells is smaller in T1 than in the WT, suggesting that T1 cells are more likely to self-agglutinate than WT cells from the point of view of the cell surface physicochemical properties. The reason that the T1 cells adsorb to hydrocarbon surfaces but do not self-agglutinate will be investigated in detail. In any case, owing to this surface hydrophobicity unaccompanied by T1's self-agglutinating property, strain T1 forms a monolayer on hexadecane droplets during the MATH test, a process that can be described by the Langmuir adsorption isotherm.
As seen in Fig. 2 and 3b, the emulsion formed by vortex mixing is stabilized by the T1 cells adhering to the surfaces of the hexadecane droplets. Similarly, Dorobantu et al. reported that Acinetobacter venetianus RAG-1, a hydrophobic bacterium that belongs to the same genus as strain Tol 5, is highly efficient at stabilizing oil-water emulsions (10). The difference between these two strains of Acinetobacter is that RAG-1 cells have agglutinating properties but Tol 5 T1 cells do not. Our results revealed that only the ability to adhere to the organic phase is important for stabilizing emulsions.
Cell adhesion to the surfaces of organic droplets hinders droplet coalescence (10). Vigorous mixing by vortexing breaks the organic phase into many droplets, which can coalesce upon collision, resulting in a dynamic equilibrium that generates a distribution of droplet sizes. When the frequency of collision is very low due to a small relative amount of the dispersed phase or when coalescence is hindered, coalescence makes little contribution to the size distribution, and it is instead determined by vesicle fission. During the MATH test, hydrophobic cells immediately adhere to droplets formed by fission of the organic phase during vigorous mixing. This prevents the droplets from coalescing and stabilizes the emulsion. Because bacterial cells only hinder coalescence and do not cause droplet fission, an excessive volume of the organic phase causes inefficient breakdown and reduces the efficiency of emulsion formation (Fig. 3).
In this study, we examined the droplet size distribution to determine the specific surface areas of the hexadecane droplets. As described by Calderbank (6), the mean diameter of droplets in a mixer can be represented by equation 6 when the volume fraction of a dispersed phase is lower than 20% (7):
 |
(6) |
and
 |
(7) |
where D32, L, NWe, φ, and C are the Sauter mean diameter, impeller diameter, Weber number, volume fraction of the dispersed phase, and an empirical constant, respectively. The specific surface area, A, can be obtained using equation 8:
 |
(8) |
This description is for a stirred tank with an impeller, whereas the MATH test is carried out by vigorous stirring in a test tube by vortex mixing. Despite this difference, both systems are common in terms of the droplet size distribution determined by fission when two immiscible liquid phases are stirred. Therefore, the Sauter mean diameter of droplets formed by vortex mixing can be represented by equation 9:
 |
(9) |
When 50 and 100 μl of hexadecane are added to 1 ml of water, the values of φ are 0.0476 and 0.0909, respectively, and the specific surface areas can be represented by equations 10 and 11, respectively:
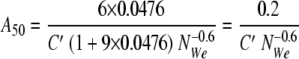 |
(10) |
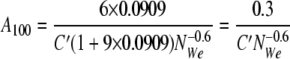 |
(11) |
Therefore, A100 divided by A50 is equal to 1.5. This value is close to that calculated from the experimental data (1,640/1,150 = 1.43).
To our knowledge, this is the first report showing monolayer adsorption of bacterial cells to hydrocarbon surfaces that can be described by the Langmuir adsorption isotherm. The adsorption equilibrium constant, a, and the saturated amount of adsorption, Ymax, in this isotherm represent the cell surface hydrophobicity of the bacteria. Lichtenberg et al. first proposed the kinetic MATH test and expressed the results as the removal rate (17). When the adherence of bacterial cells is a reversible equilibrium process, however, adsorption isotherms are more useful and appropriate. While the Langmuir adsorption isotherm is applicable to monolayer adsorption like that of T1 cells, the Brunauer-Emmett-Teller (BET) adsorption isotherm seems to be useful for the adherence of cells that self-agglutinate. To apply this adsorption isotherm, however, there is an assumption that the interaction of the adsorbate with the adsorbent is much larger than that of the adsorbate substances with each other so that the mutual interaction among the adsorbate substances is negligible. This is not likely to be the case for WT cells of Tol 5, which may quickly self-agglutinate before adhering to organic surfaces; it is more likely that the formed cell clumps adhere to organic surfaces than that individual cells adhere to the other cells that have initially adhered to the organic surfaces.
The maximum number of T1 cells that can adhere to the surfaces of hexadecane droplets was simulated to be 2.8 × 10⁵ cells/mm2. The projection area of a T1 cell is approximately 5.7 × 10⁻⁷ mm2 if it is assumed to be an ellipse with a major axis of 1.2 μm and a minor axis of 0.6 μm, as estimated by electron microscopy (16). Therefore, 2.8 × 10⁵ cells occupy 0.16 mm2, corresponding to 16% of the unit surface. This seems reasonable because the rod-shaped bacterial cells cannot always be arranged to completely cover the spherical surfaces of the oil droplets, as seen in Fig. 2b and c.
Specifically, the Langmuir adsorption isotherm is a mathematical description of reversible monolayer adsorption, which supports the results shown in Fig. 5. Busscher et al. explained the reversible adhesion of some bacterial strains to solid surfaces with surface free energy (5). Despite the difference between solid and liquid surfaces, a similar approach might be useful for explaining the mechanism of the reversible adsorption of T1 cells to the hydrocarbon surface. For the utilization of bacterial cells in a two-liquid-phase partitioning system for microbial conversion, reversible adsorption in a monolayer state will be advantageous, because bacterial cells can effectively access substrates dissolved in the organic solvent phase and because the effect of toxic substrates dissolved in the organic solvent phase on the adhering cells can be minimized by substitution with fresh or recovered cells suspended in the aqueous phase.
In summary, the bald strain T1, a mutant of Acinetobacter sp. strain Tol 5 that lacks filamentous appendages and thereby the agglutinating property, adsorbed as a monolayer to a hydrocarbon surface in a manner described by the Langmuir adsorption isotherm. This interesting property will be useful for the development of green technology using two-liquid-phase partitioning systems and for bioremediation at oil-contaminated sites because the bacterium should allow the efficient reaction and/or transport of chemicals at the oil-water interface. We are currently investigating the properties of several WT strains that have the same ability as the T1 strain to adsorb to hydrocarbon surfaces.
Acknowledgments
This work was supported by a grant-in-aid for scientific research (no. 16360409) from the Japan Society for the Promotion of Science.
Footnotes
Published ahead of print on 29 February 2008.
REFERENCES
- 1.Absolom, D. R., F. V. Lamberti, Z. Policova, W. Zingg, C. J. van Oss, and A. W. Neumann. 1983. Surface thermodynamics of bacterial adhesion. Appl. Environ. Microbiol. 46:90-97. [DOI] [PMC free article] [PubMed] [Google Scholar]
- 2.Ahimou, F., M. Paquot, P. Jacques, P. Thonart, and P. G. Rouxhet. 2001. Influence of electrical properties on the evaluation of the surface hydrophobicity of Bacillus subtilis. J. Microbiol. Methods 45:119-126. [DOI] [PubMed] [Google Scholar]
- 3.Busscher, H. J., A. H. Weerkamp, H. C. van der Mei, A. W. J. van Pelt, H. P. de Jong, and J. Arends. 1984. Measurement of the surface free energy of bacterial cell surfaces and its relevance for adhesion. Appl. Environ. Microbiol. 48:980-983. [DOI] [PMC free article] [PubMed] [Google Scholar]
- 4.Busscher, H. J., B. van de Belt-Gritter, and H. C. van der Mei. 1995. Implications of microbial adhesion to hydrocarbons for evaluating cell surface hydrophobicity. 1. Zeta potentials of hydrocarbon droplets. Colloids Surf. B 5:111-116. [Google Scholar]
- 5.Busscher, H. J., M. H. W. J. C. Uyen, A. H. Weerkamp, W. J. Postma, and J. Arends. 1986. Reversibility of adhesion of oral streptococci to solids. FEMS Microbiol. Lett. 35:303-306. [Google Scholar]
- 6.Calderbank, P. H. 1958. Physical rate processes in industrial fermentation. Part 1. The interfacial area in gas-liquid contacting with mechanical agitation. Trans. Inst. Chem. Eng. 36:443-463. [Google Scholar]
- 7.Chen, H. T., and S. Middleman. 1967. Drop size distribution in agitated liquid-liquid systems. AIChE J. 13:989-995. [Google Scholar]
- 8.Daugulis, A. J. 1997. Partitioning bioreactors. Curr. Opin. Biotechnol. 8:169-174. [DOI] [PubMed] [Google Scholar]
- 9.Dillon, J. K., J. A. Fuerst, A. C. Hayward, and G. H. G. Davis. 1986. A comparison of five methods for assaying bacterial hydrophobicity. J. Microbiol. Methods 6:13-19. [Google Scholar]
- 10.Dorobantu, L. S., A. K. C. Yeung, J. M. Foght, and M. R. Gray. 2004. Stabilization of oil-water emulsions by hydrophobic bacteria. Appl. Environ. Microbiol. 70:6333-6336. [DOI] [PMC free article] [PubMed] [Google Scholar]
- 11.Heilmann, C., O. Schweizer, C. Gerke, N. Vanittanakom, D. Mack, and F. Götz. 1996. Molecular basis of intercellular adhesion in the biofilm-forming Staphylococcus epidermidis. Mol. Microbiol. 20:1083-1091. [DOI] [PubMed] [Google Scholar]
- 12.Hori, K., M. Yamaji, Y. Tanji, H. Unno, and Y. Ishikawa. 2002. A new device for in situ sampling of dispersion for image analysis. Meas. Sci. Technol. 13:N27-N29. [Google Scholar]
- 13.Hori, K., S. Yamashita, S. Ishii, M. Kitagawa, Y. Tanji, and H. Unno. 2001. Isolation, characterization and application to off-gas treatment of toluene degrading bacteria. J. Chem. Eng. Jpn. 34:1120-1126. [Google Scholar]
- 14.Hori, K., Y. Matsuzaki, Y. Tanji, and H. Unno. 2002. Effect of dispersing oil phase on the biodegradability of a solid alkane dissolved in non-biodegradable oil. Appl. Microbiol. Biotechnol. 59:574-579. [DOI] [PubMed] [Google Scholar]
- 15.Ishii, S., H. Unno, S. Miyata, and K. Hori. 2006. Effect of cell appendages on the adhesion property of a highly adhesive bacterium, Acinetobacter sp. Tol 5. Biosci. Biotechnol. Biochem. 70:2635-2640. [DOI] [PubMed] [Google Scholar]
- 16.Ishii, S., J. Koki, H. Unno, and K. Hori. 2004. Two morphological types of cell appendages on a strongly adhesive bacterium, Acinetobacter sp. strain Tol 5. Appl. Environ. Microbiol. 70:5026-5029. [DOI] [PMC free article] [PubMed] [Google Scholar]
- 17.Lichtenberg, D., M. Rosenberg, N. Sharfman, and I. Ofek. 1985. A kinetic approach to bacterial adherence to hydrocarbon. J. Microbiol. Methods 4:141-146. [Google Scholar]
- 18.Malinowski, J. J. 2001. Two-phase partitioning bioreactors in fermentation technology. Biotechnol. Adv. 19:525-538. [DOI] [PubMed] [Google Scholar]
- 19.Marshall, K. C., R. Stout, and R. Mitchell. 1971. Mechanism of the initial events in the sorption of marine bacteria to surface. J. Gen. Microbiol. 68:337-348. [Google Scholar]
- 20.Mozes, N., and P. G. Rouxhet. 1987. Methods for measuring hydrophobicity of microorganisms. J. Microbiol. Methods 6:99-112. [Google Scholar]
- 21.Rosenberg, M., D. Gutnick, and E. Rosenberg. 1980. Adherence of bacteria to hydrocarbons: a simple method for measuring cell-surface hydrophobicity. FEMS Microbiol. Lett. 9:29-33. [Google Scholar]
- 22.Stenström, T. A. 1989. Bacterial hydrophobicity, an overall parameter for the measurement of adhesion potential to soil particles. Appl. Environ. Microbiol. 55:142-147. [DOI] [PMC free article] [PubMed] [Google Scholar]
- 23.Van der Mei, H. C., A. H. Weerkamp, and H. J. Busscher. 1987. A comparison of various methods to determine hydrophobic properties of streptococcal cell surfaces. J. Microbiol. Methods 6:277-287. [Google Scholar]
- 24.Van der Mei, H. C., B. van de Belt-Gritter, and H. J. Busscher. 1995. Implications of microbial adhesion to hydrocarbons for evaluating cell surface hydrophobicity. 2. Adhesion mechanisms. Colloids Surf. B 5:117-126. [Google Scholar]
- 25.van der Mei, H. C., J. de Vries, and H. J. Busscher. 1993. Hydrophobic and electrostatic cell surface properties of thermophilic dairy streptococci. Appl. Environ. Microbiol. 59:4305-4312. [DOI] [PMC free article] [PubMed] [Google Scholar]